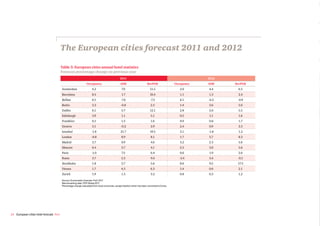
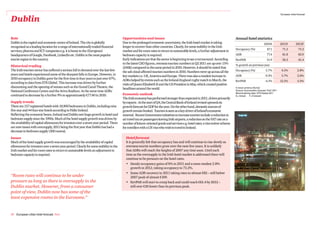
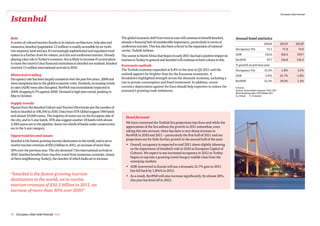
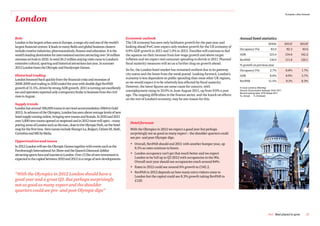
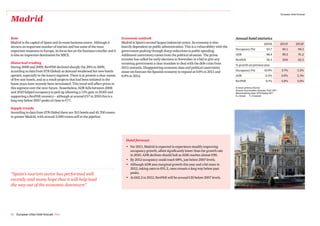
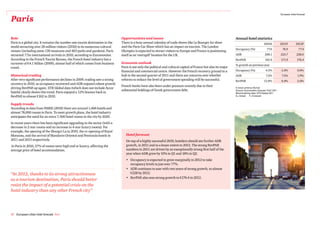
www.pwc.com/hospitality


                          Best placed to grow
                          European cities hotel forecast 2011 & 2012
October 2011

NEW hotel forecast for
17 European cities
In this issue
                Introduction                          4
                Key findings                          5
                Setting the scene                     6
                The cities best placed to grow        7
                Economic and travel outlook          15
                The European cities hotel forecast   23
                Appendix: methodology                43
                Contacts                             47


                                                          PwC Best placed to grow   3
Introduction
                                               Europe has the biggest hotel and travel market in the world, but its cities and its hotel markets are undergoing change. Countries
                                               and cities alike are being buffeted by new economic, social, technological, environmental and political currents. Europe has
                                               already begun to feel the winds of change as the old economic order shifts eastwards and economic growth becomes more elusive.
                                               While some cities struggle, hotel markets in other, often bigger and better connected cities prosper. For many countries provincial
                                               markets have been hit harder than those in the larger cities.
                                               In this report we look forward to 2012 and ask which European cities’ hotel sectors are best placed to take advantage of the
                                               changing economic order. Are these the cities of the so called ‘old’ Europe or the cities of the fast growing ‘emerging’ economies
                                               such as Istanbul and Moscow? What will be driving the growth? What obstacles do they face? Will the glut of new hotel rooms built
                                               in the boom years prove difficult to digest?
                                               The 17 cities in this report are all important tourist destinations. Some are capitals or regional centres, some combine roles as
                                               leading international financial and asset management centres, transportation hubs or tourism and conference destinations. Some
                                               like London and Paris are major economies in their own right, of a size larger than medium-sized national economies such as
                                               Sweden or Switzerland. We have provided some city rankings for comparison, but of course it’s not just about growth rates. Each
                                               city operates at differing levels of maturity and profitability and they are all at different stages in the hotel cycle, reflecting wider
                                               global and domestic macroeconomic drivers as well as demand elements specific to that city.
                                               This report combines PwC’s* recognised econometric forecasting and macro-consulting expertise with its extensive hotel and
                                               travel capability across Europe. We have forecast the outlook for demand, average daily rates (ADR) and revenue per available
                                               room (RevPAR). The economic forecasts were generated based on PwC’s own economic forecast scenarios (September 2011).
                                               Details of the method and assumptions used to compile the forecasts can be found in the appendix. We have used a variety of
                                               reputable statistical sources which include: hotel benchmark data series and supply data from STR Global; other supply and
                                               tourism data from national tourism organisations, Lodging Econometrics, Euromonitor International and other commercial
                                               sources; and economic data from Eurostat, Turkstat, National Central Banks and Thomson Reuters DataStream.


4 European cities hotel forecast PwC * “PwC” refers to the network of member firms of PricewaterhouseCoopers International Limited (PwCIL), or, as the context requires, individual member firms of the PwC network.
Key findings
                                10         key findings
                                1.    Despite unsettled times hotels remain a bright and resilient sector.
“Most markets bounced back
                                2.    Different themes play out across the cities but most have bounced back from the past downturn, when declines in
in 2010 and 2011, although            RevPAR of 20% or more were common.
many still remain below their
pre-recession RevPAR peaks”     3.    Still, hotels in many cities remain below pre-recession RevPAR peaks.

                                4.    Cities like London, Paris, Istanbul and Amsterdam stand out from the crowd with strong recoveries.

                                5.    The five cities forecast to show highest annual RevPAR growth from 2010 to 2012 are: Stockholm (11.3%),
                                      Istanbul (10.0%), Amsterdam (9.0%), Dublin (8.8%) and London (8.3%).

                                6.    For 2011, Istanbul, Dublin and Amsterdam will enjoy double digit RevPAR growth but by 2012 only Stockholm is
                                      expected to see growth in double figures.

                                7.    In other cities where the economic outlook is less bright we see a less inviting outlook for the hotels sector.

                                8.    A word of caution: the star quality of the cities analysed may not be indicative of the state of the hotel sector in the
                                      country as a whole – key cities tend to perform better than provincial locations.

                                9.    There will be support for those cities with relatively resilient domestic economies and in some cases
                                      geo-political events such as the ‘Arab Spring’ may continue to benefit alternative tourism destinations, such
                                      as Istanbul or Barcelona.

                                10.   The impact of austerity measures on consumer, corporate and government spending on travel is a concern. A
                                      continued business travel recovery is crucial to deliver the growth we forecast, but inevitably the economic slowdown
                                      and sovereign debt crisis will weigh on this sector.


                                                                                                                                            PwC Best placed to grow   5
Setting the scene: recent European trading
2011: H1 rebound and H2 slowdown

Each country has its own unique hotel sector characteristics and        Chart 1: 2010 RevPAR in the 17 cities
Europe-wide metrics pose almost as many questions as answers.
We hope that by focusing on European cities this report provides        €200
readers with some interesting comparisons.
                                                                        €175

2010                                                                    €150

That said, it’s useful to try to draw together the recent European      €125
trading scene. The financial downturn in 2008 and 2009 hit the          €100
hotel sector badly and in many cities hotels saw demand slump and
                                                                         €75
prices tumble. For many countries their provincial hotel sectors
saw, and continue to see, harsher trading conditions than the key        €50
cities. Chart 1 shows the RevPAR picture in the cities in this survey    €25
in 2010, a year of steady recovery for many cities and of very robust
                                                                          €0
growth for others. London topped the occupancy league at over                      Paris      Geneva      Zurich     London      Istanbul    Rome     Amsterdam Moscow   Stockholm Barcelona Frankfurt Edinburgh   Vienna   Berlin   Madrid   Dublin   Belfast

83%. After converting ADR and RevPAR from local currencies to            Source: STR Global 2011
                                                                         Note: Calculated from local currencies, except Istanbul which has been converted from Euros.
Euros, Geneva had the highest ADR at €217.5 and Paris the highest
RevPAR at €161.6. A more detailed historical trading picture can
be found in the Cities Forecasts on pages 22 to 42.

2011 to date
2011 is almost over and trading has enjoyed a strong first half for
many. But performance has started to reflect the economic mood
swing since August and according to data from STR Global,
European RevPAR was materially weaker in August than in July.
Occupancy remained firm, but for many countries rates
weakened.
According to a report from Citi Group based on data from STR
Global, core European countries appeared to perform most
strongly e.g. France and Spain delivered strong performances in
August (+8.5% and +8.8%) while Germany was +3% and the
UK was +4.5% in sterling terms. Weaker performing countries
were Turkey, Hungary and Israel.


6 European cities hotel forecast PwC
The cities best placed to grow


                                 PwC Best placed to grow   7
The cities best placed to grow


2011 forecast: waving the recession goodbye?


Many of the cities have managed to wave goodbye to the recession as they            Table 1: the 2011 cities forecast
continue to recover at their own pace and pattern. Some global cities such as       % change on previous year (ranked by RevPAR % growth)
London and Paris have thrived.
                                                                                                                        Occupancy                            ADR               RevPAR

                                                                                    Istanbul                                -1.8%                           21.7%              19.5%
We expected all but one city to see further growth in 2011. Many, like              Dublin                                  6.1%                             5.7%              12.1%
Amsterdam enjoyed a robust 2011 H1 performance. Some, including London              Amsterdam                               4.2%                             7.0%              11.5%
and Barcelona enjoyed an exceptionally strong Q2. Yet, others benefitted from
political events. Others saw stronger growth potential blocked by over supply.      Barcelona                               8.5%                             1.7%              10.4%
Table 4 shows the full 2011 and 2012 forecast. Key results include:                 Rome                                    3.7%                             5.5%              9.4%

Double digit RevPAR growth for a few...                                             London                                 -0.8%                             8.9%              8.1%
                                                                                    Paris                                   -1.0%                            7.5%              6.4%
• We expect four cities to see double digit RevPAR growth in 2011. These are
  Istanbul (by a large margin and with its second successive year of double digit   Vienna                                  1.7%                             4.5%              6.3%
  growth), Dublin, Amsterdam (also its second year of double digit growth) and      Stockholm                               1.8%                             3.7%              5.6%
  Barcelona.                                                                        Edinburgh                               3.9%                             1.1%              5.1%
... and good RevPAR growth for many...                                              Madrid                                  3.7%                             0.9%              4.6%
• 8-10%: London (double digit growth in 2010) and Rome manage strong                Moscow                                  0.4%                             3.7%              4.1%
  growth even if RevPAR doesn’t get into double figures.                            Zurich                                  1.9%                             1.3%              3.2%
• 6-8%: Vienna and Paris (double digit growth in 2010).                             Geneva                                  3.1%                            -0.2%              2.9%
                                                                                    Berlin                                  3.3%                            -0.8%              2.5%
• 4-6%: Moscow, Madrid, Edinburgh and Stockholm.
                                                                                    Frankfurt                               0.1%                             1.5%              1.6%
• 2%-4%: Zurich, Geneva and Berlin (double digit growth in 2010).
                                                                                    Belfast                                 0.1%                            -7.6%              -7.5%
• Less than 2%: Frankfurt (following spectacular 22% RevPAR growth in               Note: Percentage change calculated from local currencies, except Istanbul which has been
                                                                                    converted to Euros.
  2010).
Declines: Belfast where hoteliers could see their third year of RevPAR declines –
albeit the rate of decline appears to be slowing.


8 European cities hotel forecast PwC
The cities best placed to grow


2012 forecast: lonelier at the top


            Despite considerable uncertainty around the economic outlook, the road ahead          Table 2: the 2012 cities forecast
            still looks positive for most of the cities we have analysed, although the rates of   % change on previous year (ranked by RevPAR % growth)
            growth are slowing. But the risks are firmly to the downside.
                                                                                                                                      Occupancy                            ADR                        RevPAR

                                                                                                  Stockholm                               8.6%                             9.5%                       17.3%
            By 2012 it’s likely to become more lonely at the top as double digit RevPAR           London                                  1.7%                             5.7%                        8.3%
            growth eludes most cities ...                                                         Amsterdam                               2.0%                             4.4%                        6.5%
            In 2012 we anticipate only Stockholm will manage double figure RevPAR                 Madrid                                  3.2%                             2.3%                        5.6%
            growth, reflecting the Swedish economy’s strong recovery from recession,              Moscow                                  2.5%                             3.0%                        5.6%
            although it is expected to slow markedly in 2012.
                                                                                                  Dublin                                  2.8%                             2.6%                        5.5%
            ... and more will see lower RevPAR growth than in 2011                                Berlin                                  1.4%                             3.6%                        5.0%
            • 6-8%: London and Amsterdam.                                                         Geneva                                  2.4%                             0.9%                        3.3%
            • 4-6%: Berlin, Madrid, Moscow and Dublin.                                            Paris                                   0.6%                             1.9%                        2.6%

            • 2-4%: Vienna, Barcelona, Paris, Geneva.                                             Barcelona                               1.1%                             1.3%                        2.4%
                                                                                                  Vienna                                  1.4%                             0.6%                        2.1%
            • Less than 2%: Istanbul, Edinburgh, Zurich and Frankfurt. The specific
              reasons are discussed in detail in the City sections but include considerable       Frankfurt                               0.9%                             0.8%                        1.7%
              new openings and some challenging comparisons with 2011.                            Edinburgh                               0.5%                             1.1%                        1.6%
            Declines: marginal declines for Rome and Belfast.                                     Zurich                                  0.8%                             0.3%                        1.2%
                                                                                                  Istanbul                                3.1%                            -1.8%                        1.2%
            Best placed to grow 2010-2012                                                         Rome                                    -3.4%                            3.4%                        -0.1%
            Looking across 2011 and 2012*, the five top performing cities are                     Belfast                                 6.1%                            -6.5%                        -0.9%
            Stockholm (11.3%), Istanbul (10.0%), Amsterdam(9.0%), Dublin (8.8%)                   Note: Percentage change calculated from local currencies, except Istanbul which has been
                                                                                                  converted to Euros.
            and London (8.3%).


            *CAGR 2010-2012                                                                                                                                                          PwC Best placed to grow             9
The cities best placed to grow


Which European city markets
are best placed to grow in 2012?


                                                                                                 Stockholm


                                                                                                                                                                   Moscow
                                                            Edinburgh

                                         Belfast

                                        Dublin
                                                                                    Amsterdam           Berlin
                                                          London

                                                                                           Frankfurt
                                                                   Paris
                                                                                                                 Vienna
                                                                                            Zurich
                                                                           Geneva


                                                                                                       Rome
                                                          Barcelona                                                                              Istanbul
                                                 Madrid


                                                                                                                          Forecast RevPAR growth 2012

10 European cities hotel forecast PwC                                                                                       >16%            6-16%           4-6%      2-4%     0-2%                 <0%
The cities best placed to grow


The fullest cities: London, Edinburgh and Amsterdam


2012 forecast for occupancy

    London
                                                                                      •   Of course it’s not just about growth rates, each city operates
  Edinburgh                                                                               at differing levels of maturity and levels of profitability and
 Amsterdam                                                                                many are at diverse stages of the hotel cycle.
        Paris
                                                                                      •   Looking at occupancy levels, London operates at a very
     Vienna                                                                               high level, virtually full in peak months. We expect
  Stockholm                                                                               2012 will see the capital fill further as the Olympics
     Zurich                                                                               come to town.
   Barcelona                                                                          •   Edinburgh, Amsterdam, Paris, Vienna and Stockholm
    Istanbul                                                                              could all see occupancy in excess of 75% in 2012.
      Dublin
       Berlin
     Geneva
     Madrid
      Belfast
      Rome
   Frankfurt
    Moscow                                                  Average 73%

                  60%                    65%   70%               75%      80%   85%
                                                     Occupancy


Source: Econometric forecast: PwC 2011
Benchmarking data: STR Global 2011                                                                                        PwC Best placed to grow            11
The cities best placed to grow


The most expensive cities: Geneva, Paris and Zurich


2012 forecast for ADR

     Geneva
                                                                                       •   Looking at our ADR predictions for 2012: at one end of the
        Paris                                                                              spectrum are Geneva, Paris and Zurich, where average
      Zurich                                                                               ADR could exceed €200. (For Geneva ADR could be close to
     London                                                                                €265.)
    Istanbul                                                                           •   At the other end of the spectrum Vienna, Madrid,
    Moscow                                                                                 Edinburgh, Berlin, Dublin and Belfast have ADR under
       Rome                                                                                €100.
 Amsterdam                                                                             •   Not so good for hoteliers in these cities at the lower end of
  Stockholm                                                                                the ranking but good value for consumers.
   Frankfurt
   Barcelona
      Vienna
     Madrid
  Edinburgh
       Berlin
      Dublin
      Belfast                                         Average € 136.70
                  €0                     €50   €100   €150       €200    €250   €300

                                                       ADR
Source: Econometric forecast: PwC 2011
Benchmarking data: STR Global 2011


12 European cities hotel forecast PwC
The cities best placed to grow


The highest RevPAR: Geneva, Paris and Zurich (again!)


2012 forecast for RevPAR

     Geneva
                                                                            •   High occupancy and rates growth translates into high
        Paris                                                                   RevPAR forecasts in 2012.
      Zurich
                                                                            •   Geneva may see RevPAR reach €183. Zurich also sees
     London
                                                                                RevPAR over €160 and for London it’s more than €120.
    Istanbul
 Amsterdam                                                                  •   Istanbul, Amsterdam and Rome could all see RevPAR
                                                                                exceed €100.
       Rome
    Moscow
   Barcelona
  Stockholm
   Frankfurt
  Edinburgh
      Vienna
       Berlin
     Madrid
      Dublin
      Belfast                                  Average € 99
                  €0                     €50   €100           €150   €200


Source: Econometric forecast: PwC 2011
Benchmarking data: STR Global 2011


                                                                                                             PwC Best placed to grow            13
14 European cities hotel forecast PwC
Economic and travel outlook


                              PwC Best placed to grow   15
Economic and travel outlook


It’s a divergent economic outlook


Business travel demand is closely aligned to GDP growth, especially the business investment element of growth. Consumer demand for travel depends largely on disposable income levels. Different
macroeconomic variables clearly have a varying impact on cities. Confidence is key and the current outlook is highly uncertain.


Sovereign debt crisis continues into the autumn                       What will these economic trends mean for the hotel sector?
The Eurozone sovereign debt crisis intensified over the summer        We have seen that despite the modest economic performance across European economies in the first half of 2011, the hotels market
and threatened to engulf the larger, “too big to fail” economies      has thrived. During the recession businesses and consumers were expected to cut back on spending which is partially discretionary
of Spain and Italy.                                                   including holidays and business travel. This was indeed the case, with many cities experiencing declines in RevPAR of 20% or more
                                                                      in 2008 and 2009.
There is considerable uncertainty over the outlook for Greece
and other Southern European economies. This has also                  Most markets bounced back in 2010 and 2011, although many still remain below their pre-recession RevPAR peaks. The big
damaged confidence in European banks, many of which have              question now is whether this bounce back will continue for the rest of this year and into 2012 as the sovereign debt crisis threatens
high exposure to sovereign debt.                                      to bring about a double dip recession.
                                                                      The European economic outlook has deteriorated over the last few months. We expect extremely modest growth in most countries
Growth of core Eurozone nations stalled in the first                  with a few exceptions such as Turkey, with growth of 6.2% in 2011 and 3.1% in 2012. Sweden and Russia are also strong performers
half of the year                                                      with growth of over 4.0% expected in 2011, although the global slowdown will take its toll and the Swedish economy is expected to
The latest data suggests that the sovereign debt crisis has spilled   slow markedly in 2012. The weakest performing national economies are expected to be Spain and Italy, which are expected to grow by
into the real economy. Weak growth figures in core nations such       less than 1% this year. See map.
as Germany and France in Q2 2011 have caused growth
                                                                      Overall we think the hotel market will remain resilient, albeit with some differing trends across cities. We expect the strongest
projections for 2011 to be marked down.
                                                                      performers over the next 18 months to be Istanbul, Stockholm and Amsterdam. The hotels sector in each of these cities has shown a
                                                                      searing performance in the first half of the year. Going forward we expect to see support in these cities from relatively resilient
Simultaneous fiscal austerity will act as a drag on                   domestic economies and in some cases geo-political events. Istanbul in particular has experienced exceptional growth in hotels
economic growth going forward                                         demand, as political uncertainty in many other Middle Eastern and North African countries has reduced the numbers of tourists
The majority of European economies are implementing fiscal            elsewhere in the region.
austerity packages to reduce government borrowing and to help
                                                                      In other cities, where the economic outlook is less bright we see a less inviting outlook for the hotels sector. These cities include
ease market concerns over fiscal sustainability.
                                                                      Belfast, where growth is likely to be affected by cuts in public spending; and Frankfurt, where a weak financial sector will weigh on
In the short term, we expect the resulting tax increases and public   business travel in particular.
spending cuts will act as a further drag on economic growth.


16 European cities hotel forecast PwC
Economic and travel outlook


The European sovereign
debt crisis is far from over

Key to economic ‘weathermap’
            Actual   Forecast Forecast
Outlook
                   GDP growth
                                                                                                Sweden
                                                                                                            2010 2011 2012
                                                                                                             5.3       4.3     2.3


                                                                                                                                                                                   Russia
                                            United Kingdom
                                                                                                                                                                                             2010 2011 2012
                                                     2010 2011 2012
                                                                                                                                                                                             4.0    4.4    4.3
                                                     1.8     0.9     1.0


                                                                   Netherlands
                                                                           2010 2011 2012
                   Ireland
                                                                           1.8         1.8      1.2
                             2010 2011 2012
                             -1.0   1.6     1.2
                                                                     Germany
                                                                             2010 2011 2012                                          Austria
                                                                                 3.5     2.6         1.6                                       2010 2011 2012
                                                                                                                                               2.1      2.9    1.9
                                            France
                                                     2010 2011 2012                                  Switzerland
                                                     1.5     1.7     1.5                                         2010 2011 2012
                                                                                                                 2.6     2.0       1.5
                                                                                                                                                     Greece
                                    Spain
                                                                                                                                                              2010 2011 2012
                                              2010 2011 2012
                                                                                             Italy                                                            -4.5   -4.8   -1.2
                                              -0.1   0.6     0.9
                                                                                                        2010 2011 2012
                                                                                                                                                                                    Turkey
                                                                                                           1.2     0.7       0.5
                                                                                                                                                                                              2010 2011 2012
                                                                                                                                                                                              8.9    6.2    3.1


Source: PwC 2011

                                                                                                                                                                                                                  PwC Best placed to grow         17
18 European cities hotel forecast PwC
It’s a competitive and
                                                                                                                                                                                                             Economic and travel outlook


                                                                                                                                          “Istanbul is the fastest growing tourism
challenging travel                                                                                                                        destination in the world, set to receive
                                                                                                                                          tourism revenues of $10.2 billion in 2011, an
market                                                                                                                                    increase of more than 30% over 2010.”

The most visited region
Europe is the most important region of the world for                  Top 20 European destinations by
international travel volumes and also generates huge
numbers of domestic trips. Europe received around 471 million
                                                                      international tourist arrivals
international tourism arrivals in 2010 (+3% on 2009 according
to data from UNWTO). Recovery was slower than in other
regions due to the air traffic disruption caused by the eruption of
the Eyjafjallajokull volcano and the economic uncertainty.
Most travel is intra-regional i.e. Europeans travelling within
Europe. In 2011 Russia and France lead intra-European source
markets. In terms of non-European markets, US arrivals have
been particularly robust.

And the most visited cities                                                                                                                                                          2.3 St Petersburg
                                                                                                                                          Stockholm 2.6
Consumers value holidays and want to travel and Europe can
boast many of the world’s leading and most dynamic cities.                                                                                                                                      3.6 Moscow
However, it’s an increasingly competitive global travel market.
In terms of international tourist arrivals the map shows the most
visited European cities in 2010. Four cities had over 5 million
                                                                               Dublin 4.2
international visitor arrivals – London, Paris, Istanbul and
                                                                                                                          3.9 Amsterdam      2.8 Berlin
Rome. A truly global city, London tops the global as well as                                    London 14.1
European list and receives almost double the volume of                                                                                          3.7 Prague                           3.5 Kiev
international arrivals of the next mega European city, Paris.                                              Paris 7.8
                                                                                                                                Munich 2.1
Barcelona and Dublin follow close behind with 4.5 million and                                                                                      3.4    2.7 Budapest
4.2 million apiece.                                                                                                                             Vienna


                                                                                                                        Barcelona            5.5 Rome
                                                                                                                  4.5                                                            7.5 Istanbul
                                                                                      Madrid 3.2
                                                                                                                            1.1 Palma de Mallorca
                                                                        Lisbon 1.7
                                                                                                                                                                        1.8 Athens


                                                                      2010 international arrivals (in millions)             >8 million    6-8 million     4-6 million
                                                                      Source: Euromonitor International 2011                3-4 million   2-3 million     1-2 million                                PwC Best placed to grow         19
Economic and travel outlook


The spectre of a darker travel outlook looms


                                        Why continue to visit?                             cash strapped consumers may find affording
                                        The reasons for visiting the cities are diverse.   them harder. Hotels are unlikely to be on the
                                        For some like Frankfurt it’s mainly business       ‘shopping list’ for austerity hit households. On a
                                        driven. For others like Berlin it’s a large        positive note, PwC research earlier this year
                                        proportion of leisure travellers. Equally some     showed that holidays remained a top spending
                                        like Berlin are driven by mainly domestic          priority for European households. Interestingly
                                        demand and others like Geneva mainly               other key priorities involved paying down debt.
                                        international. For the global gateway cities       On balance, for many cities leisure travel
                                        it’s a mix, and therein lies their strength.       remains an important demand driver and
                                                                                           consumers have adopted ways of stretching
                                        Europe saw a travel rebound in H1                  their budgets, including ‘shopping clever’ as
                                        2011 ...                                           they trawl the internet, look for deals and
                                        Data from the European Travel Commission           shorten their length of stay.
                                        (ETC) in July 2011 reported encouraging
                                        travel trends showing that Europe enjoyed a        ... but prospects are for a less
                                        rebound in travel to the region during the first   promising H2 2011 and beyond
                                        half of 2011.                                      As global economic worries intensify,
                                        So far the continued business travel recovery      uncertainties around the sustainability of the
                                        has been very good news for the hotel sector as    travel recovery grow. ETC anticipate that
                                        it continues to recover from the 2008/9            growth in travel to Europe will slow in the
                                        financial crisis. Broadly speaking companies       remainder of 2011, as comparisons are made to
                                        acknowledge they have to travel to grow but        stronger performance in 2010 and as the sector
                                        remain down on excess and drive a hard             fights against the challenges of weak economic
                                        bargain looking for value and flexibility.         growth. Overall it is unlikely that travel
                                                                                           volumes and spend will bounce back quickly.
                                        Consumer household budgets remain under            The spectre of a darker travel outlook looms
                                        pressure in many countries and although            over Europe.
                                        holidays remain important for our wellbeing,


20 European cities hotel forecast PwC
Economic and travel outlook


Supply: if you build it,                                                                                                       The concrete mixers and cranes have still been
they may not come                                                                                                              busy in some cities, despite the funding drought


Digesting new supply can be problematic
The current economic climate and financing drought has             The European
slowed up new development across many areas of Europe and
while this may have mitigated some of the impact of the            construction
recessionary slowdown, the concrete mixers and cranes have         pipeline
still been busy.
For others the legacy of past over-building continues to hover
over the sector and the city reports show there are still plenty
of new hotels dragging down occupancy and rates,
e.g. Berlin or Madrid.
Data produced by key hotel benchmarking companies including                                                                    Stockholm
STR Global and Lodging Econometrics track hotel development
                                                                                                                                                                    Moscow
pipelines across Europe and show around 122,000-125,000
rooms in the pipeline in Europe. Of this, some 330-400 hotels             Edinburgh
(54,000-71,000 rooms) are under construction.                        Belfast
                                                                    Dublin
Where are they all being built? STR Global lists the largest                                                 Amsterdam
pipelines (as at July 2011) in UK (particularly London in                            London                                         Berlin
advance of the Olympic Games), Russia (in advance of the
Winter Olympics 2014 and the World Cup in 2018), Germany,                                                                 Frankfurt
Turkey (especially Istanbul), Italy, France, Spain and Austria.                                        Paris                             Vienna
                                                                                                                           Zurich
Cities with considerable hotels under construction as opposed                                          Geneva
to in the pipeline include London, Istanbul, Moscow,
Stockholm, Berlin and Amsterdam. In contrast Geneva has little
new supply planned.                                                                                                                 Rome
                                                                                                    Barcelona                                            Istanbul
                                                                               Madrid


                                                                       New rooms under construction

                                                                           >5,000              2,000-3,000         1,000-2,000        500-1,000   <500


                                                                        Source: STR Global July 2011, Frankfurt PwC Research
                                                                                                                                                                    PwC Best placed to grow          21
22 European cities hotel forecast PwC
The European cities hotel forecast
2011 and 2012


                                     PwC Best placed to grow   23
The European cities forecast 2011 and 2012

                                        Table 3: European cities annual hotel statistics
                                        Forecast percentage change on previous year
                                                                                                2011                                                         2012
                                                               Occupancy                        ADR                       RevPAR                 Occupancy   ADR    RevPAR
                                        Amsterdam                    4.2                         7.0                         11.5                   2.0      4.4     6.5
                                        Barcelona                    8.5                         1.7                         10.4                   1.1      1.3     2.4
                                        Belfast                      0.1                         -7.6                        -7.5                   6.1      -6.5    -0.9
                                        Berlin                       3.3                         -0.8                         2.5                   1.4      3.6     5.0
                                        Dublin                       6.1                         5.7                         12.1                   2.8      2.6     5.5
                                        Edinburgh                    3.9                         1.1                          5.1                   0.5      1.1     1.6
                                        Frankfurt                    0.1                         1.5                          1.6                   0.9      0.8     1.7
                                        Geneva                       3.1                         -0.2                         2.9                   2.4      0.9     3.3
                                        Istanbul                    -1.8                        21.7                         19.5                   3.1      -1.8    1.2
                                        London                      -0.8                         8.9                          8.1                   1.7      5.7     8.3
                                        Madrid                       3.7                         0.9                          4.6                   3.2      2.3     5.6
                                        Moscow                       0.4                         3.7                          4.1                   2.5      3.0     5.6
                                        Paris                       -1.0                         7.5                          6.4                   0.6      1.9     2.6
                                        Rome                         3.7                         5.5                          9.4                   -3.4     3.4     -0.1
                                        Stockholm                    1.8                         3.7                          5.6                   8.6      9.5     17.3
                                        Vienna                       1.7                         4.5                          6.3                   1.4      0.6     2.1
                                        Zurich                       1.9                         1.3                          3.2                   0.8      0.3     1.2

                                        Source: Econometric forecast: PwC 2011
                                        Benchmarking data: STR Global 2011
                                        Percentage change calculated from local currencies, except Istanbul which has been converted to Euros.


24 European cities hotel forecast PwC
PwC Best placed to grow   25
European cities forecast

Amsterdam

Role                                                                           Opportunities and issues                                                        Annual hotel statistics
Amsterdam is the financial and cultural capital of the Netherlands, home to    Amsterdam’s role as a major cluster in business services (such as consulting                             2010A           2011F         2012F
many large Dutch institutions as well as seven of the world’s top 500          and IT), transport and logistics, has helped to drive demand from business
                                                                                                                                                               Occupancy (%)               74.1          77.2            78.7
companies. The Amsterdam Stock Exchange, the oldest stock exchange in          travellers in recent years. We expect this and the relatively robust recovery
the world, is located in the city centre. Amsterdam’s conference centre and    to underpin an expansion in the hotels market. In addition, a meetings          ADR                        119.6         127.9          133.6
main attractions, including its historic canals and museums, draw more         recovery appears underway aided by investment at the key conference and         RevPAR                      88.6          98.7          105.1
than 3.9 million international visitors annually.                              exhibition centre, the RAI.                                                     % growth on previous year

Historical trading                                                             Economic outlook                                                                Occupancy (%)              1.4%          4.2%            2.0%
RevPAR tumbled by 22% in 2009, compared to the prior year, and                 The recession in the Netherlands was milder than many other countries.          ADR                        4.5%           7.0%           4.4%
occupancies fell to 67%, according to data from STR Global, as the             The economy shrunk by a little under 4% in 2009, and has since recovered        RevPAR                    16.5%          11.5%           6.5%
economic recession bit hard. 2010 shows a solid RevPAR recovery. Overall       close to pre-crisis levels. Whilst the Eurozone sovereign crisis is having an
ADR saw a 4.5% gain in 2010 and occupancy climbed back up to 74%.              effect on Amsterdam and the surrounding areas, we still expect the              In local currency (Euros)
                                                                                                                                                               Source: Econometric forecast: PwC 2011
Hotel market performance data shows that for the first half of 2011            economy to continue to grow in 2011 and 2012.                                   Benchmarking data: STR Global 2011
Amsterdam hotels continued to register robust RevPAR gains of 16% and                                                                                          A= Actual      F=Forecast
                                                                               However, the minority government is pursuing a path towards fiscal
are getting closer to pre-recession performance.
                                                                               sustainability by implementing a medium-term consolidation plan which aims
Supply trends                                                                  to reduce the deficit by over 3% of GDP. These measures are already underway
As of July 2011, the Greater-Amsterdam area has around 240 hotels with some    and we expect this to drag on economic growth over the next few years.
24,000 rooms. The number of hotels is estimated to have decreased slightly
compared to April 2010. According to a study by CBRE, many plans for new
hotels exist, either as new construction or through reconversion of existing
property. Data from STR Global suggest there are around 2,100 rooms in the
supply pipeline.
Amsterdam appears to be sticking to hotel policy formulated in 2007 in
which the need for 9,000 extra rooms by 2015 was set out.                         Hotel forecast
Notable hotel openings include the Holiday Inn - Amsterdam at Schiphol            • 2011 is expected to see double digit RevPAR growth of 11.5%
(April 2011), the Mint Hotel – soon to be rebranded a Hilton (June 2011),           driven by both rising rates and strong demand.
Alrov’s Conservatorium Hotel (September 2011) and the Crowne Plaza
                                                                                  • At almost 79% occupancy in 2012 could pip pre recession levels.
(November 2011).
                                                                                  • Strong demand will buoy up ADR growth to nearly €134 in 2012.
                                                                                  • In 2012 Amsterdam could see record RevPAR levels, in nominal
“ The Amsterdam hotel market has seen                                               terms, at €105.
an astonishingly fast recovery and could
soon overtake pre-recession trading”


26 European cities hotel forecast PwC
European cities forecast

Barcelona

Role                                                                             Opportunities and issues                                                        Annual hotel statistics
Barcelona is the capital of the autonomous region of Catalunya and an            The high volume of new rooms in the city is likely to continue to                                        2010A           2011F         2012F
important business centre. It is a popular destination for tourists from all     depress hotel performance. However, the political uncertainty in                Occupancy (%)               67.5          73.3            74.1
over Europe and its hotel structure reflects this. In 2010 Barcelona             North Africa is likely to have a beneficial effect on Spain’s tourism
welcomed 4.5 million international tourist arrivals, according to                                                                                                ADR                        110.8         112.8          114.2
                                                                                 sector overall, including Barcelona.
Euromonitor. It is an important port for cruise ships and a city with a lot of                                                                                   RevPAR                      74.8          82.7           84.7
activity in the MICE sector.                                                     Economic outlook
                                                                                 Barcelona is a key part of the Spanish economy. As well as being a major        % growth on previous year
Barcelona is a key part of the Spanish economy. As well as being a major         tourist hub, the Barcelona area accounts for around a sixth of Spanish          Occupancy (%)              8.4%          8.5%            1.1%
tourist hub, the Barcelona area accounts for around a sixth of Spanish           industrial production, and it attracts approximately a quarter of all foreign   ADR                        1.1%          1.7%           1.3%
industrial production, and attracts approximately a quarter of all foreign       investments to Spain.
investments to Spain.                                                                                                                                            RevPAR                     9.6%          10.4%          2.4%
                                                                                 Despite this, the weakness in the Spanish economy will weigh on the
                                                                                                                                                                 In local currency (Euros)
Historical trading                                                               economy. The government is putting through sharp cuts in government             Source: Econometric forecast: PwC 2011
Over the last few years, RevPAR declined sharply as a combination of             spending, property markets remain paralysed and the banking sector is           Benchmarking data: STR Global 2011
                                                                                                                                                                 A= Actual      F=Forecast
weaker demand and increasing supply impacted hoteliers. But the city             struggling. We expect little or no growth in the Spanish economy over the
remains very popular amongst travellers and occupancy is picking up again        next two years.
as prices fall (tumbling over 16% in 2009 according to data from STR
Global). The increasing number of low-cost flights to the city’s airport and
nearby Girona have been an important factor in stabilising demand. RevPAR
increased by 9.6% in 2010 to around €75, following a 23% drop in 2009.

Supply trends                                                                       Hotel forecast

Supply data from STR Global shows Barcelona has around 460 hotels and               • 2011 Q1 saw occupancy growth of 5% and in Q2 occupancy was
44,000 hotel rooms (as at July 2011). In addition, around 800 rooms are               15% higher than the year before. While our projections expect
listed as in the pipeline for the city. The majority of hotels are four-star/         occupancy to weaken sharply in the second half of the year, the
upscale and above.                                                                    strong Q2 should drive 8.5% occupancy growth in 2011.
                                                                                    • Overall we expect RevPAR to manage a double digit bounce-back in
                                                                                      2011, largely driven by the occupancy recovery.
                                                                                    • In 2012, occupancy and ADR growth is expected to be more
                                                                                      restrained. An ADR gain of 1.3% takes ADR to €114.2, still €16
                                                                                      lower than the peak in 2007.

“Barcelona is well placed to capitalise from a                                      • RevPAR continues to recover slowly creeping up to €84.7, an
                                                                                      encouraging trend but still low compared to past peaks.
recovery in international tourism and occupancy is
picking up again as rates fall – low cost flights have
been an important factor in stabilising demand ”


                                                                                                                                                                                           PwC Best placed to grow            27
European cities forecast

Belfast

Role                                                                                 the Giant’s Causeway World Heritage site, a peace bridge across the           Annual hotel statistics
Belfast is the capital of Northern Ireland (one of 12 regions comprising the UK)     River Foyle in a rejuvenated Londonderry/Derry and the 2012 London                                     2010A           2011F         2012F
and is the region’s business, conference and financial centre. Two of the region’s   Olympics and Belfast’s hoteliers are expecting a busy year.
                                                                                                                                                                   Occupancy (%)               64.0          64.0            67.9
three airports are in the Belfast Metro area, as is a deep-water port that           Nearly a half a million pounds has been invested in Northern Ireland
facilitates cruise ships.                                                            tourism infrastructure and collectively Northern Ireland’s tourism chiefs     ADR                         56.0          51.7            48.3
                                                                                     hope that this will attract more visitors in 2012, persuade them to stay      RevPAR                      35.8          33.1            32.8
Historical trading                                                                   longer and spend more – and then come back and do it again.                   % growth on previous year
2010 was a difficult year for Northern Ireland’s hotel sector. While demand for
self-catering, caravanning and camping grew, the hotel sector suffered due to a      Economic outlook                                                              Occupancy (%)             -3.2%           0.1%           6.1%
reduction in both corporate business travel and the conference market.               Belfast is Northern Ireland’s educational and commercial hub. Fears over      ADR                       -8.6%          -7.6%          -6.5%
Average hotel occupancy was the lowest for a decade, exacerbated by a 7%             the Eurozone debt crisis, and importantly the cutbacks in UK government
                                                                                                                                                                   RevPAR                   -11.6%          -7.5%          -0.9%
increase in room numbers as new hotels, planned before the recession, came           spending are all combining to slow Northern Ireland’s growth. We expect it
on line. Hotels experienced rising operating costs and diluted earnings, with        to be a lacklustre 0.8% in 2011.                                              In local currency (Sterling)
                                                                                                                                                                   Source: Econometric forecast: PwC 2011
occupancy levels, at around 64%, well below the 75% experienced in 2007.             Sluggish growth in the UK and the continued difficulties in the Republic of   Benchmarking data: STR Global 2011
                                                                                                                                                                   A= Actual      F=Forecast
                                                                                     Ireland are further reducing the prospects for Northern Ireland’s exports
Supply trends                                                                        and recovery.
Overall, Northern Ireland has around 140 hotels, with around 7,750 rooms, the
majority in the Belfast Metropolitan area. A spate of hotel investment in the
early 2000s came on stream to coincide with the economic downturn, where
all sectors suffered from the subsequent overcapacity. Recent land acquisitions
and planning applications suggest that confidence may be returning to the
sector as two new hotels are planned.

Opportunities and issues
In 2012, Belfast will recall the centenary of the sinking of the Belfast-built
Titanic on her maiden voyage to New York. The £97 million Titanic
exhibition centre expects half a million visitors in 2012 alone and will                Hotel forecast
become a permanent piece of Belfast’s history. Add a new visitor centre at              • Occupancy remains flat this year but could see around 6% growth
                                                                                          in 2012 taking occupancy to almost 68%
                                                                                        • ADR however continues to struggle and we anticipate further
                                                                                          declines of 7.6% and 6.5% in 2011 and 2012 as rates slump to £48
                                                                                        • Hoteliers could see four years of declines in RevPAR from 2009 to
Belfast hoteliers are expecting a                                                         2012, albeit the rate of decline will hopefully slow to -0.9% in 2012.
better year in 2012 with a new Titanic                                                    At £32.80 RevPAR would be a record low.
exhibition centre and the Olympics


28 European cities hotel forecast PwC
European cities forecast

Berlin

Role                                                                                   Opportunities and issues                                                        Annual hotel statistics
Berlin is the capital of Germany and the centre of the country. It is also a centre    The relatively weak economy in the city is an issue for Berlin. GDP per                                  2010A           2011F         2012F
for life science, arts, IT, services, political and cultural education, research and   capita in Berlin lies about 10% below the German average due to a limited       Occupancy (%)               68.9          71.2           72.2
the media. Tourism consists of a mixture of business and leisure travellers with       number of national and international HQs; a problem that will probably
60% of travellers domestic. Conferences, exhibitions and trade fairs are also                                                                                          ADR                         87.2          86.5           89.6
                                                                                       remain for the mid-term. However, Berlin has the potential to improve its
important demand drivers. In 2010 Berlin attracted 2.8 million international           status as a European metropolitan city, which could affect the hotel            RevPAR                      60.1          61.6           64.7
arrivals, according to data from Euromonitor.                                          industry positively. The city hosts several national and international fairs;   % growth on previous year
                                                                                       this leads to some performance peaks during the year. The new Berlin            Occupancy (%)              2.2%          3.3%            1.4%
Historical trading                                                                     Airport (to be opened in 2012) will improve flight connections to Berlin; a
Occupancy saw steady growth between 2002 and 2007, increasing from                     positive driver for tourism.                                                    ADR                        8.4%          -0.8%          3.6%
59.9% to 69.8% and, although hotel supply in Berlin increased considerably,                                                                                            RevPAR                    10.8%          2.5%           5.0%
tourist numbers grew even more strongly. Occupancy declines in 2008 and                Economic outlook
2009 were moderate, slipping between -1.0 and -1.3 percentage points. In               Berlin’s economy is dominated by the service sector, with around 80% of all     In local currency (Euros)

2010 occupancy recovered to 68.9% and the figures for the six months to                companies doing business in services. Until recently, Germany had looked        Source: Econometric forecast: PwC 2011
                                                                                                                                                                       Benchmarking data: STR Global 2011
June 2011 exceed the prior year level slightly, according to data from STR             immune to the current Eurozone wide economic crisis, but there are signs        A= Actual      F=Forecast

Global. Increasing hotel supply in Berlin has depressed prices. ADR yo-yoed            that growth may slow in the second half of the year as the prospect of
between € 79 (2005) and € 88 (2010).                                                   reduced global demand for German exports begins to take its toll.

Supply trends
According to data from STR Global there are around 600 hotels and over
58,000 rooms in hotels in Berlin, with the share of budget hotels increasing.
There have been around 3,500 new room openings in recent years and
around 3,705 more are in the pipeline. The area around the Berlin main
station (Hauptbahnhof) and Schoenefeld, the location of the new
international airport, are hot spots for several new hotel projects. A
prominent hotel opening will be the Waldorf Astoria between Zoologischer                  Hotel forecast
Garten station and the Memorial Church.
                                                                                          • The 2011 out-turn sees a 3.3% occupancy gain take occupancy to
                                                                                            71.2% and, although ADR sees a marginal decline, a 2.5% RevPAR
                                                                                            gain takes RevPAR to €61.6 – a record.
                                                                                          • In 2012 its more growth and more records broken as occupancy
                                                                                            gains take occupancy levels to 72.2%.
                                                                                          • ADR turns positive in 2012 and at €89.6 is the highest since 2001.
“The area around the Berlin main station
                                                                                          • In 2012 RevPAR could see a further 5% growth, taking it to
(Hauptbahnhof) and Schoenefeld, the location                                                almost €65.
of the new international airport, are hot
spots for several new hotel projects”


                                                                                                                                                                                                 PwC Best placed to grow            29
European cities forecast

Dublin

Role                                                                                   Opportunities and issues                                                                Annual hotel statistics
Dublin is the capital and economic centre of Ireland. The city is globally             Due to the prolonged economic uncertainty, the Irish hotel market is taking                                      2010A           2011F         2012F
recognised as a leading location for a range of internationally traded financial       longer to recover than other countries. Clearly, for some stability in the Irish
                                                                                                                                                                               Occupancy (%)               67.1          71.2            73.2
services; pharma and ICT companies e.g. it is home to the (European)                   market and for room rates to return to sustainable levels, a further adjustment in
headquarters of Google, Facebook, LinkedIn etc. Dublin is the most popular             bedroom capacity is required.                                                           ADR                         77.4          81.8            83.9
tourist region in the country.                                                         Early indications are that the sector is beginning to see a turnaround. According       RevPAR                      51.9          58.2            61.4
                                                                                       to the latest CSO figures, overseas tourism numbers in Q2 2011 are up over 15%          % growth on previous year
Historical trading                                                                     (240k) compared to the same period in 2010. However, it should be noted that
The Irish tourism sector has suffered a serious fall in demand over the last few       the ash cloud affected tourism numbers in 2010. Numbers were up across all the          Occupancy (%)              5.7%           6.1%           2.8%
years and hotels experienced some of the sharpest falls in Europe. However, in         key markets i.e. UK, America and Europe. There was also a modest increase in            ADR                       -9.3%          5.7%            2.6%
2010 occupancy in Dublin grew for the first time in four years to just over 67%,       ADRs helped by events such as the Ireland-England rugby match in March, the             RevPAR                    -4.1%          12.1%           5.5%
according to data from STR Global. This increase was driven by further                 visits of Queen Elizabeth II and the US President in May, which created positive
discounting and the opening of venues such as the Grand Canal Theatre, the             headlines around the world.                                                             In local currency (Euros)
National Conference Centre and the Aviva Stadium. At the same time ADRs                                                                                                        Source: Econometric forecast: PwC 2011
                                                                                                                                                                               Benchmarking data: STR Global 2011
continued to decrease by a further 9% to approximately €77.40 in 2010.                 Economic outlook                                                                        A= Actual      F=Forecast
                                                                                       The Irish economy has performed stronger than expected in 2011, driven primarily
Supply trends                                                                          by exports . At the start of Q4, the Central Bank of Ireland revised upwards its
There are 157 registered hotels with 18,900 bedrooms in Dublin, including nine         growth forecast for GDP for the year. On the other hand, domestic sources of
five-star and 44 four-star hotels according to Fáilte Ireland.                         growth remain limited. Tourism is seen as a key driver of Ireland’s economic
Reflecting the economic boom, Ireland and Dublin saw huge growth in hotel and          renewal. Recent Government initiatives to increase tourism include a reduction in
bedroom supply since the 1990s. Much of the hotel supply growth was driven by          air travel tax on passengers leaving Irish airports, a reduction on the VAT rate on a
the availability of capital allowances for investors over a seven year period. There   number of leisure-oriented goods and services e.g. hotel rates; a visa waiver scheme
are now issues with oversupply, 2011 being the first year that Dublin has had a        for travellers with a UK visa who wish to travel to Ireland.
decrease in bedroom supply (300 rooms).
Issues                                                                                   Hotel forecast
Much of the hotel supply growth was encouraged by the availability of capital            It is generally felt that occupancy has and will continue to rise slowly as
allowances for investors over a seven year period. Clearly for some stability in the     overseas tourist numbers grow over the next few years. It is unlikely
Irish market and for room rates to return to sustainable levels an adjustment in         that ADRs will reach the heights of 2007 any time soon. Until such
bedroom capacity is required.                                                            time as the oversupply in the Irish hotel market is addressed there will
                                                                                         continue to be pressure on the hotel rates.
                                                                                         • Steady occupancy gains of 6% in 2011 and a more modest 2.8%
                                                                                             growth in 2012, taking occupancy to 73.2%.
                                                                                         • Some ADR recovery in 2011 taking rates to almost €82 – still below
“Room rates will continue to be under                                                        2007 peak of almost €109.
pressure as long as there is oversupply in the                                           • RevPAR will start to creep back and could reach €61.4 by 2012 –
Dublin market. However, from a consumer                                                      still over €20 lower than its previous peak.
point of view, Dublin now has some of the
least expensive rooms in the Eurozone.”


30 European cities hotel forecast PwC
European cities forecast

Edinburgh

Role                                                                                Opportunities and issues                                                            Annual hotel statistics
Edinburgh is one of the financial and historical centres of Europe, home to a       A number of events (including the Edinburgh International Festival) are held in                              2010A           2011F         2012F
number of large global financial institutions and a variety of cultural             the city each year, which means that Edinburgh continues to attract a
                                                                                                                                                                        Occupancy (%)               77.7          80.7           81.2
attractions. The city boasts a diverse range of features from Dynamic Earth and     significant number of visitors on a continuing basis. Also, Glasgow will host the
Edinburgh Castle to the Camera Obscura and Royal Yacht Britannia drawing            2014 Commonwealth Games which will have a positive impact on the tourism            ADR                         76.4          77.2           78.0
over 2.5 million visitors each year.                                                prospects for Edinburgh.                                                            RevPAR                      59.3          62.3           63.3
                                                                                                                                                                        % growth on previous year
Historical trading                                                                  Economic outlook
In 2010 RevPAR saw a significant improvement across the year as a whole in                                                                                              Occupancy (%)              3.1%          3.9%           0.5%
                                                                                    Edinburgh has been consistently one of the most prosperous parts of the UK.
comparison to 2009, a sign that the hotel and tourism industry is beginning to      The economy of Edinburgh is largely based around the services sector, with          ADR                        0.5%           1.1%           1.1%
recover following the recession. So far in 2011, this trend has continued as        tourism and financial services being particularly important.                        RevPAR                     3.6%           5.1%          1.6%
Edinburgh hotels have achieved RevPAR levels closer to those witnessed before
                                                                                    There is evidence that the depreciation of sterling against the Euro and other
the economic downturn. RevPAR peaks during August each year when the city                                                                                               In local currency (Sterling)
                                                                                    currencies has provided a significant fillip for the local market, which is         Source: Econometric forecast: PwC 2011
hosts the Edinburgh International Festival which draws visitors to Edinburgh.                                                                                           Benchmarking data: STR Global 2011
                                                                                    popular with international visitors.                                                A= Actual      F=Forecast
Supply trends
As at June 2011, there are 155 hotels in Edinburgh, offering a total of 10,412
rooms. The number of rooms has increased marginally (2.9%) compared to
June 2010. Furthermore, many landlords throughout the city opt for short term
lets during the festival, sometimes earning two or three times more than they
would from letting their property over a long term period.
Edinburgh city council recently stated that, despite some concerns in the city of
over-supply, more hotels are still needed in Edinburgh across all categories.


                                                                                       Hotel forecast
                                                                                       • Occupancy, already high, is expected to end 2011 at around 80.7%
                                                                                         and to nudge up higher still in 2012.
                                                                                       • ADR is also well above the UK regional average and should see a
“In the UK market, Edinburgh has the highest                                             gain of 1.1% taking rates to £78 in 2012.

occupancies and ADR outside London”                                                    • RevPAR levels should reach £63.3 by 2012, almost back to
                                                                                         pre-recession levels.


                                                                                                                                                                                                  PwC Best placed to grow            31
European cities forecast

Frankfurt

Role                                                                               Supply trends                                                                       Annual hotel statistics
Frankfurt is Germany’s financial centre and a leading business hub. It is home     Frankfurt provides around 15,000 rooms in some 117 hotels, according to data                                 2010A           2011F         2012F
to the European Central Bank, the Frankfurt Stock Exchange and the German          from STR Global. Around 58% of the hotel supply is in the four and five star
                                                                                                                                                                       Occupancy (%)               65.5          65.5            66.1
Federal Bank. Business tourism is an important sector for the hotel industry.      segment and mainly caters for business travellers. PwC research suggests
Overnight stays are also generated by the airport, the second largest in Europe.   future new development could generate up to 2,500 additional rooms within           ADR                       112.5          114.2          115.2
The fairground hosts some international fairs. Leisure tourism is relatively       the next three years. New openings will include two Hilton Hotels at the            RevPAR                      73.7          74.9            76.1
weak in comparison.                                                                airport (including a Garden Inn) scheduled for the end of 2011.                     % growth on previous year

Historical trading                                                                 Economic outlook                                                                    Occupancy (%)            12.5%            0.1%           0.9%
Between 2004 to 2007 occupancy in Frankfurt ranged between 62% and 64%,            The three pillars of Frankfurt’s economy are finance, transport, and trade fairs.   ADR                        8.3%          1.5%            0.8%
due to low weekend business volumes. During the financial crisis occupancy         The ongoing Eurozone debt crisis has impacted the financial sector. However,        RevPAR                    21.9%          1.6%            1.7%
fell to 60.7% and 58.2% in 2008 and 2009 respectively. Germany’s remarkable        there are signs of resilient domestic demand even as global demand slows.
economic recovery in 2010 has lead to strong gains taking occupancy back up                                                                                            In local currency (Euros)
                                                                                                                                                                       Source: Econometric forecast: PwC 2011
to 65.5%. Pre-crisis ADR remained relatively stable in 2006 to 2008 (€111 to                                                                                           Benchmarking data: STR Global 2011
€ 113). In 2009 ADR fell 7% to € 105. 2010 saw an 8% boost to almost € 113,                                                                                            A= Actual      F=Forecast

driven by economic growth and a VAT reduction for hotels in Germany in 2010.


                                                                                      Hotel forecast
                                                                                      • After a robust leap in 2010, occupancy is expected to remain flat in
                                                                                        2011 with only around 0.9% growth in 2012, taking occupancy to
                                                                                        just over 66% - high by historic standards.
                                                                                      • ADR remains a little stronger and we anticipate further growth,
                                                                                        although not as strong as in 2010, of 1.5% and 0.8% in 2011 and
“ 2011 saw the biennial Frankfurt Motor Show roar                                       2012 as rates nudge up to €115 – on a par with 2001.
into town as well as the annual Frankfurt Book                                        • ADR drives RevPAR growth of 1.6% and 1.7% in 2011 and 2012,
                                                                                        taking RevPAR to €74.9 and €76.1.
Fair, the biggest book and media fair in the world
with around 7,500 exhibitors from 110 countries.
However due to the ongoing increases in new hotel
supply, room rates achieved during the fair periods
do not reach the levels attained a few years ago.”
32 European cities hotel forecast PwC
European cities forecast

Geneva

Role                                                                                  Opportunities and issues                                                        Annual hotel statistics
Geneva is Switzerland’s second largest tourism destination. An international          The geopolitical developments in the Middle East and Arabic peninsula                                    2010A           2011F         2012F
centre of finance, culture and politics, it hosts many global company                 might affect the ability and willingness of the Middle Eastern clientele to     Occupancy (%)               65.4          67.4           69.0
headquarters, financial institutions and over 100 international organizations,        travel to Geneva for extended summer stays, resulting in material loss of
including the United Nations, the International Red Cross and the WTO.                                                                                                ADR                       300.7          300.0          302.8
                                                                                      revenue for the luxury segment.
Around 70% of visits are for business. Due to its spectacular setting, it is also a                                                                                   RevPAR                    196.6          202.2          208.9
                                                                                      The continued strength of the Swiss Franc has already started to negatively
popular tourism destination and the gateway to western Switzerland’s                                                                                                  % growth on previous year
                                                                                      affect Swiss tourism destinations and a prolonged period of a weak Euro,
mountain resorts.
                                                                                      combined with a further deterioration of European economic performance          Occupancy (%)              6.7%           3.1%          2.4%
Historical trading                                                                    is expected to eventually have a negative effect on the Geneva market.          ADR                       -3.2%          -0.2%          0.9%
Geneva’s recent trading has not been as badly impacted by the global economic         The dearth of new hotel projects should help support the sector.
                                                                                                                                                                      RevPAR                     3.3%          2.9%           3.3%
crisis as some cities but the hotel sector saw some large occupancy falls in late     Economic outlook
2008 and 2009. The continued influx of foreign companies to the city, many            Geneva’s economy is mainly services oriented. The city has an important and     In local currency (Swiss Francs)
                                                                                                                                                                      Source: Econometric forecast: PwC 2011
establishing corporate or regional headquarters, resulted in a steady increase in     old financial sector which is specialised in private banking and financing of   Benchmarking data: STR Global 2011
demand by business travellers. As in prior years, Geneva remains one of the           international trade. It is also an important centre of commodity trade.         A= Actual      F=Forecast

most expensive European cities in regards to room rates. 2010 was a good year
for the Geneva lodging market, with an increase in occupancy across all               But the value of the Swiss Franc (which has risen 27% against Euro since June
segments. The reduction in ADR was largely compensated by a strong increase           2010) is having an impact on trade. Exports account for around half of GDP,
in RevPAR – principally driven by the added service offerings introduced by the       making Swiss economy particularly vulnerable to an uncompetitive exchange
5-star properties as part of their facilities upgrades.                               rate. The Swiss National Bank has recently pledged to defend the franc to
                                                                                      prevent it rising above €1.2.
Supply trends
Switzerland’s second largest tourism destination, features a current rooms
supply of 6,300 rooms, including 24 4-star and 15 5-star properties. New
project developments have been limited, due to high property prices,
competition for assets by corporate headquarters and limited possibilities of
expansion due to the proximity of the French border. No major projects are
currently under development.
                                                                                         Hotel forecast
                                                                                         • We anticipate slower occupancy growth but occupancy levels could
                                                                                           almost reach 70% in 2012 – high by past comparisons.
                                                                                         • ADR is expected to remain under pressure, well below past peaks
“Geneva’s recent trading has not been as badly
                                                                                           and see only marginal growth in 2012.
impacted by the global economic crisis as some                                           • RevPAR nudges up around 3.3% in 2012 to Swiss Franc 208.9.
cities but political developments in the Middle
East and Arabic peninsula could well result in
reduced summer visits from the Middle Eastern
clientele, significantly affecting Geneva’s 5-star
hotel segment in the coming season.”
                                                                                                                                                                                                PwC Best placed to grow            33
European cities forecast

Istanbul

Role                                                                                  The global economic shift from west to east will continue to benefit Istanbul,     Annual hotel statistics
A centre of cultural tourism thanks to its historic architecture, holy sites and      already a financial hub of considerable importance, particularly in terms of                                2010A           2011F         2012F
museums, Istanbul (population 12 million) is readily accessible by air (with          conference tourism. This has also been a factor in the expansion of national
                                                                                      carrier, Turkish Airlines.                                                         Occupancy (%)               73.1          71.8            74.0
two airports), land and sea. It’s increasingly sophisticated and regulated retail
system is a further draw for visitors, as is fair and conference tourism. Already     The unrest in North Africa that began in early 2011 has had a positive impact on   ADR                       133.6          162.6           159.7
playing a key role in Turkey’s economy; this is likely to increase if current plans   tourism to Turkey in general and Istanbul will continue to have a share in this.   RevPAR                      97.7         116.8          118.2
to move the country’s key financial institutions to Istanbul are realised. Istanbul                                                                                      % growth on previous year
                                                                                      Economic outlook
received 7.5 million international arrivals in 2010.
                                                                                      The Turkish economy expanded at 8.8% in the year to Q2 2011 and the                Occupancy (%)             15.1%          -1.8%           3.1%
Historical trading                                                                    outlook appears far brighter than for the Eurozone economies. A                    ADR                       -2.6%          21.7%          -1.8%
Occupancy rate has been largely consistent over the past five years. 2008 and         breakdown highlighted strength across the domestic economy, including a
                                                                                      rise in private consumption and fixed investment. In addition, recent              RevPAR                    12.1%          19.5%           1.2%
were exceptions due to the global economic crisis. Similarly, increasing trends
in rates (ADR) were also disrupted. RevPAR was immediately impacted in                currency depreciation against the Euro should help exporters to reduce the         In Euros
2009, dropping 6.7% against 2008. Demand is high year-round, peaking in               economy’s growing trade imbalance.                                                 Source: Econometric forecast: PwC 2011
                                                                                                                                                                         Benchmarking data: STR Global 2011
May to October.                                                                                                                                                          A= Actual   F=Forecast


Supply trends
Figures from the Istanbul Culture and Tourism Directorate put the number of
beds in Istanbul at 108,340 in 2010. Data from STR Global suggest 348 hotels
and almost 33,000 rooms. The majority of rooms are on the European side of               Hotel forecast
the city, and in 5-star hotels. STR also suggest another 18 hotels with almost
3,300 rooms are in the pipeline. Some two thirds of hotels under construction            We have converted the Turkish lira projections into Euro and while the
are in the 5-star category.                                                              appreciation of the lira softens the growth in 2011 somewhat, even
                                                                                         taking this into account, there has been a very sharp increase in
Opportunities and issues                                                                 RevPAR in 2010 and 2011 – particularly the first half of 2011 and our
Istanbul is the fastest growing tourism destination in the world, and is set to          projections are for little further growth in the second half of the year:
receive tourism revenues of $10.2 billion in 2011, an increase of more than              • Overall, occupancy is expected to end 2011 down slightly (showing
30% over the previous year. The city attracted 7.5m international arrivals in              us the importance of Istanbul’s role in 2010 as European Capital of
2010. Istanbul benefits from visa-free travel from numerous countries, (many               Culture). We expect to see increased occupancy in 2012 as Turkey
of them neighbouring Turkey), the number of which looks set to increase.                   begins to tap into a growing travel-hungry middle class from the
                                                                                           emerging markets.
                                                                                         • ADR (converted to Euros) will see a dramatic 21.7% gain in 2011
                                                                                           but fall back by 1.8%% in 2012.
“Istanbul is the fastest growing tourism                                                 • As a result, RevPAR will also increase significantly, by almost 20%,
destination in the world, set to receive                                                   this year but level off in 2012.
tourism revenues of $10.2 billion in 2011, an
increase of more than 30% over 2010”


34 European cities hotel forecast PwC
European cities forecast

London

Role                                                                                Economic outlook                                                                Annual hotel statistics
London is the largest urban area in Europe, a mega city and one of the world’s      The UK economy has seen only lacklustre growth for the past year and                                     2010A           2011F         2012F
largest financial centres. It leads in many fields and global business clusters     looking ahead PwC now expect only modest growth for the UK economy of
                                                                                                                                                                    Occupancy (%)               83.0          82.3           83.6
include creative industries, pharmaceuticals, finance and education. It is the      0.9% GDP growth in 2011 and 1.0% in 2012. Families will continue to feel
world’s leading destination for international tourism attracting over 14 million    the squeeze on their incomes from low wage growth and above target              ADR                       123.4          134.6          142.2
overseas arrivals in 2010. In total 26.2 million staying visits came to London’s    inflation and we expect real consumer spending to shrink in 2011. Planned       RevPAR                     110.9         111.8          120.1
extensive cultural, sporting and historical attractions last year. In summer        fiscal austerity measures will act as a further drag on growth ahead.           % growth on previous year
2012 London hosts the Olympic and Paralympic Games.
                                                                                    So far, the London hotel market has remained resilient due to its gateway       Occupancy (%)              2.7%          -0.8%          1.7%
Historical trading                                                                  city status and the boost from the weak pound. Looking forward, London’s        ADR                        8.6%          8.9%           5.7%
London bounced back quickly from the financial crisis and recession of              economy is less dependent on public spending than most other UK regions,
                                                                                    so we would expect it to be relatively less affected by fiscal austerity.       RevPAR                    11.5%          8.1%           8.3%
2008-2009 and trading in 2010 ended the year with double digit RevPAR
growth of 11.5%, driven by strong ADR growth. 2011 is turning out excellently       However, the latest figures are some cause for concern, with                    In local currency (Sterling)

too and operators reported only a temporary brake in business from the civil        unemployment rising to 10.0% in June-August 2011, up from 9.0% a year           Source: Econometric forecast: PwC 2011
                                                                                                                                                                    Benchmarking data: STR Global 2011
riots in August.                                                                    ago. The ongoing difficulties in the finance sector, and the knock-on effects   A= Actual      F=Forecast
                                                                                    on the rest of London’s economy, may be one reason for this.
Supply trends
London has around 106,000 rooms in serviced accommodation (Melvin Gold
2011). In advance of the Olympics, London has seen above average levels of new
hotel supply coming online, bringing new names and brands. In 2010 and 2011
over 5,000 new rooms opened or reopened and in 2012 more will open – many
                                                                                       Hotel forecast
putting areas of London such as the east, close to the Olympic Park, on the hotel
map for the first time. New names include Shangri-La, Bulgari, Citizen M, Aloft,       With the Olympics in 2012 we expect a good year but perhaps
Corinthia and ME by Melia.                                                             surprisingly not as good as many expect – the shoulder quarters could
                                                                                       see pre- and post-Olympic dips.
Opportunities and issues
                                                                                       • Overall, RevPAR should end 2011 with another bumper year, up
In 2012 London will see the Olympic Games together with events such as the               8.1% as rates continue to boom.
Farnborough International Air Show and the Queen’s Diamond Jubilee
attracting sports fans and tourists to London. Over £11bn of new investment is         • London occupancy can’t get that much better and we expect
expected in the capital between 2010 and 2012 in a range of new developments.            London to be full up in Q3 2012 with occupancies in the 90s.
                                                                                         Overall next year should see occupancies reach around 84%.
                                                                                       • Rates in 2012 could see around 6% growth to £142.2.
                                                                                       • RevPAR in 2012 depends on how many extra visitors come to
“With the Olympics in 2012 London should have a                                          London but the capital could see 8.3% growth taking RevPAR to
good year and a great Q3. But perhaps surprisingly                                       £120.
not as good as many expect and the shoulder
quarters could see pre- and post-Olympic dips”


                                                                                                                                                                                              PwC Best placed to grow            35
European cities forecast

Madrid

Role                                                                           Economic outlook                                                               Annual hotel statistics
Madrid is the capital of Spain and its main business centre. Although it       Madrid is Spain’s second largest industrial centre. Its economy is also                                 2010A           2011F         2012F
attracts an important number of tourists and has some of the most              heavily dependent on public administration. This is a vulnerability with the
                                                                                                                                                              Occupancy (%)               63.7          66.1            68.2
important museums in Europe, its focus lies on the business traveller and it   government pushing through sharp reductions to public spending.
is also an important destination for MICE.                                     Additional uncertainty comes from the political situation. The prime           ADR                         88.4          89.2            91.2
                                                                               minister has called for early elections in November in a bid to give any       RevPAR                      56.3          59.0            62.2
Historical trading                                                             incoming government a clear mandate to deal with the debt crisis from          % growth on previous year
During 2008 and 2009, RevPAR declined sharply (by 26% in 2009,                 2012 onwards. Disappointing economic data and political uncertainty
according to data from STR Global) as demand weakened but new hotels           mean we forecast the Spanish economy to expand at 0.6% in 2011 and             Occupancy (%)             10.9%          3.7%            3.2%
opened, especially in the luxury segment. There is at present a clear excess   0.9% in 2012.                                                                  ADR                       -2.5%          0.9%            2.3%
of five-star hotels, and as a result projects that had been initiated in the                                                                                  RevPAR                     8.1%          4.6%            5.6%
boom years have recently been terminated. This trend will affect prices in
this segment over the near future. Nonetheless, ADR falls between 2008                                                                                        In local currency (Euros)
                                                                                                                                                              Source: Econometric forecast: PwC 2011
and 2010 helped occupancy to pick up (showing a 11% gain in 2010) and                                                                                         Benchmarking data: STR Global 2011
supporting a RevPAR recovery – although at around €57 in 2010 this is a                                                                                       A= Actual      F=Forecast

long way below 2007 peaks of close to €77.

Supply trends
According to data from STR Global there are 353 hotels and 45,700 rooms
in greater Madrid, with around 2,000 rooms still in the pipeline.


                                                                                  Hotel forecast
                                                                                  • For 2011, Madrid is expected to experience steadily improving
                                                                                    occupancy growth, albeit significantly lower than the growth rate
                                                                                    in 2010. ADR declines should halt as ADR reaches almost €90.
                                                                                  • By 2012 occupancy could reach 68%, just below 2007 levels.
                                                                                  • Although ADR sees marginal growth this year and a bit more in
                                                                                    2012, taking rates to €91.2, rates remain a long way below past
“Spain’s tourism sector has performed well                                          peaks.
                                                                                  • At €62.2 in 2012, RevPAR will be around €10 below 2007 levels.
recently and many hope that it will help lead
the way out of the economic downturn”


36 European cities hotel forecast PwC
European cities forecast

Moscow

Role                                                                           Opportunities and issues                                                         Annual hotel statistics
Moscow is Russia’s financial centre and home to more than 600 of the           The World Cup in 2018, and the Winter Olympics at Sochi in 2014 are                                       2010A            2011F         2012F
1,250 credit institutions operating in the country. Nearly 80% of the          prestigious global events, which will attract fans and tourists and raise
                                                                                                                                                                Occupancy (%)               62.1           62.4           63.9
country’s financial resources are exchanged through the city’s financial       investor interest all over the world. In addition Moscow and St. Petersburg
system. Moscow is the most populated city in Europe, with a population of      will hold the 2016 International Ice Hockey (IIHF )World Championship.           ADR                     5,723.9          5,936.7       6,117.3
10.6 million in 2010. There are numerous places of architectural and                                                                                            RevPAR                  3,555.6          3,701.6       3,909.1
historic interest including museums, galleries and exhibition halls, as well   Economic outlook
                                                                                                                                                                % growth on previous year
as parks. About 3.6 million international tourists visited Moscow in 2010.     The Russian economy appears in relatively good health. Unemployment,
                                                                               which reached 9.4% during the recession has declined to 6.5%. GDP has            Occupancy (%)              9.2%            0.4%          2.5%
Historical trading                                                             been growing at an annualised rate of around 4% since the beginning of           ADR                      -10.1%            3.7%          3.0%
Moscow saw significant growth in occupancy but larger declines in ADR in       2010. But having experienced a relatively deep downturn in 2009, the             RevPAR                    -1.9%            4.1%          5.6%
2010, and as a consequence suffered a 1.9% fall in RevPAR. In contrast, the    economy is still smaller than it was in 2008. The other concern on the
first half of 2011 saw 5% occupancy gains and almost 8% ADR growth             horizon is the reliance on high oil prices. Two thirds of Russia’s exports and   In local currency (Roubles)
                                                                                                                                                                Source: Econometric forecast: PwC 2011
drive a 13% RevPAR boost, taking RevPAR to RUB 3,817.9.                        much of its tax receipts come from oil. A decline in the oil price would lead    Benchmarking data: STR Global 2011
                                                                               to a sharp deterioration in the trade balance and the government budget.         A= Actual      F=Forecast
Supply trends
According to data from STR Global, Moscow has 136 hotels with almost
36,000 rooms – some 700 rooms opened within the last 12 months. Over
half of the city’s accommodation stock comprises of 3-star hotels. STR
pipeline data in July 2011 lists 20 hotels with 4,600 rooms in the pipeline
for Moscow. If all the scheduled openings occur as planned, room numbers
in the capital will increase by more than 1,000 rooms in 2011, representing
a larger increase than in 2010.


                                                                                  Hotel forecast
                                                                                  • Occupancy is likely to struggle to absorb all the new hotel supply
                                                                                    additions in Moscow and we estimate only marginal growth in
                                                                                    2011 but 2.5% growth in 2012.
                                                                                  • ADR is expected to continue to recover in 2011 with a 3.7% gain
                                                                                    and further growth of 3% in 2012.
“In Moscow alone, there are just over 9,000                                       • RevPAR should turn positive again this year with just over 4%
international standard rooms, which is equivalent                                   growth and a further 5.6% in 2012.
to around ten per cent of the hotel rooms in
London, so there is still a terrific opportunity for
international hotel operators with a presence here”


                                                                                                                                                                                          PwC Best placed to grow             37
European cities forecast

Paris

Role                                                                           Opportunities and issues                                                            Annual hotel statistics
Paris is a global city. It remains the number one tourist destination in the   There is a busy annual calendar of trade shows like Le Bourget Air show                                      2010A           2011F         2012F
world attracting over 28 million visitors (2010) to its numerous cultural      and the Paris Car Show which has an impact on tourism. The London
                                                                                                                                                                   Occupancy (%)               77.6          76.9            77.4
venues (including some 130 museums and 463 parks and gardens). Paris           Olympics is expected to attract visitors to Europe and France is positioning
attracted 7.7m international arrivals in 2010, according to Euromonitor.       itself as an ‘overspill’ location for the UK.                                       ADR                       208.1          223.7          228.0
According to the French Tourist Bureau, the French hotel industry has a                                                                                            RevPAR                     161.6         171.9          176.4
turnover of €4.1 billion (2009), almost half of which comes from business      Economic outlook
                                                                                                                                                                   % growth on previous year
travel.                                                                        Paris is not only the political and cultural capital of France but also its major
                                                                               financial and commercial centre. However the French recovery ground to a            Occupancy (%)              4.5%          -1.0%           0.6%
Historical trading                                                             halt in the second quarter of 2011 and there are concerns over whether              ADR                        7.2%           7.5%           1.9%
After very significant performance declines in 2009, trading saw a strong      reforms to reduce the level of government spending will be successful.              RevPAR                   12.0%           6.4%            2.6%
recovery in 2010, as occupancy recovered and ADR enjoyed robust growth
                                                                               French banks have also been under pressure recently due to their
driving RevPAR up again. STR Global data (which does not include Accor                                                                                             In local currency (Euros)
                                                                               substantial holdings of Greek government debt.                                      Source: Econometric forecast: PwC 2011
hotels) clearly shows this trend. Paris enjoyed a 12% bounce back in                                                                                               Benchmarking data: STR Global 2011
RevPAR to almost €162 in 2010.                                                                                                                                     A= Actual      F=Forecast


Supply trends
According to data from INSEE (2010) there are around 1,466 hotels and
almost 78,000 rooms in Paris. To meet growth plans, the hotel industry
anticipates the need for an extra 7, 000 hotel rooms in the city by 2020.
In recent years there has been significant upgrading in the sector (with a
decrease in 2-star rooms and an increase in 4-star luxury rooms). For
example, the opening of the Shangri-La in 2010, the re-opening of Royal
Monceau, and the arrival of Mandarin Oriental and Peninsula hotels in             Hotel forecast
2011 and 2013 respectively.                                                       On top of a highly successful 2010, hoteliers should see further ADR
In Paris in 2010, 27% of rooms were high end or luxury, affecting the             growth, in 2011 and to a lesser extent in 2012. The strong RevPAR
average price of hotel accommodation.                                             numbers in 2011 are driven by an exceptionally strong first half of the
                                                                                  year when ADR grew by 10% in Q1 and 18% in Q2.
                                                                                  • Occupancy is expected to grow marginally in 2012 to take
                                                                                    occupancy levels to just over 77%.
                                                                                  • ADR continues to soar with two years of strong growth, to almost
“In 2012, thanks to its strong attractiveness                                       €228 by 2012.
                                                                                  • RevPAR also sees strong growth to €176.4 in 2012.
as a tourism destination, Paris should better
resist the impact of a potential crisis on the
hotel industry than any other French city”


38 European cities hotel forecast PwC
European cities forecast

Rome

Role                                                                                Opportunities and issues                                                       Annual hotel statistics
Rome is Italy’s capital city and a unique destination with a mix of leisure and     Since 1st January 2011 a room occupancy tax has been applied in Rome to                                 2010A           2011F         2012F
business visitation, both national and international, and very good accessibility   anyone staying overnight in a hotel inside Rome’s boundaries.                  Occupancy (%)               66.7          69.2           66.8
Important sectors include banking, high technology companies (aerospace,
                                                                                    Big events in Rome this year included the Republic’s 150th anniversary in      ADR                        139.9         147.5          152.6
defence and telecommunications) and tourism. Education and media are also
                                                                                    March (300,000 visitors) and the Pope Woytila beatification in May
important and Rome is a centre for music, with one of the largest musical                                                                                          RevPAR                      93.3         102.1          102.0
                                                                                    (1 million visitors) – both will have helped boost trading.
venues in the world, the new Parco della Musica. Rome has the enclave of the                                                                                       % growth on previous year
Vatican City within its territory. Rome received 5.5 million international          Economic outlook
arrivals in 2010, according to Euromonitor and is the third most visited city in    The economy of Rome is characterized by the absence of heavy industry and it   Occupancy (%)              7.7%          3.7%           -3.4%
Europe.                                                                             is largely dominated by services, high-technology companies and the huge       ADR                        1.2%          5.5%           3.4%
                                                                                    tourism sector.                                                                RevPAR                     9.0%          9.4%           -0.1%
Historical trading
                                                                                    Italy’s economy is in poor health however. GDP expanded by only 0.2%
The slowdown of most Euro economies has affected visitation to the city over                                                                                       In local currency (Euros)
                                                                                    (quarter-on-quarter) in Q2 2011, continuing from the weak 0.1% growth          Source: Econometric forecast: PwC 2011
the last two years and Rome saw steep RevPAR falls in 2008 and 2009.                                                                                               Benchmarking data: STR Global 2011
                                                                                    experienced in the previous two quarters.
Occupancy has, according to data from STR Global, seen 7.7% growth in 2010,                                                                                        A= Actual      F=Forecast

reaching almost 67%, still below 2006 highs. A 1.2% increase in ADR took
rates in 2010 to €139.9 and RevPAR to €93.3%.

Supply trends
Based on data from ISTAT (the National Institute for Statistics) there were
1.063 hotels in Rome in 2010. In contrast estimates from STR Global report
457 hotels and 36,310 rooms.
There is a relatively limited new full-service hotel supply pipeline for the
Rome hotel market due to strict planning requirements and a lack of
suitable sites for branded hotel developments. However, there were a
handful of additions to supply during 2010, including the 151-bedroom NH
Giustiniano. Rome’s hotel market is expected to increase by around 350
rooms in 2011 and STR Global estimate there are six hotels and 1,188                   Hotel forecast
rooms in the pipeline.                                                                 • Occupancy is expected to grow by 3.7% in 2011 but a dip of 3.4% in
                                                                                         2012 means levels remain some way below 2006 peaks of 75%.
                                                                                       • ADR sees strong growth this year and 3.4% growth in 2012 taking
                                                                                         ADR to €152.6 (compared to €160.9 in 2007).
“Big events in Rome this year included the Republic’s
                                                                                       • RevPAR shows another year of strong recovery in 2011 but sees a
150th anniversary in March (300,000 visitors) and                                        marginal decrease in 2012.
the Pope Woytila beatification in May (1 million
visitors) – both will have helped boost trading.”


                                                                                                                                                                                             PwC Best placed to grow            39
European cities forecast

Stockholm

Role                                                                            Opportunities and issues                                                     Annual hotel statistics
Stockholm, the capital of Sweden, is both a tourist destination and the         Sweden is experiencing robust economic performance with one of the                                    2010A            2011F         2012F
main business city. It is home to a rich cultural life and a great variety of   strongest recoveries in the EU and we expect this to buoy up ADR and
                                                                                                                                                             Occupancy (%)               69.0           70.3            75.3
events, restaurants and shopping experiences. Stockholm is the leading          occupancy levels. An issue for the city is where to build almost 8,000
business city in Northern Europe with regional head offices for                 attractive new hotel rooms in the centre of Stockholm.                       ADR                      1,110.4         1,151.8       1,260.9
international companies. The region attracted over 10 million overnight                                                                                      RevPAR                    766.6           809.2          948.9
stays in 2010 and 2.6 million international arrivals.                           Economic outlook
                                                                                                                                                             % growth on previous year
                                                                                The Swedish economy grew by 1% (quarter-on-quarter) in Q2 2011
Historical trading                                                              boosted by household consumption, continuing the strong growth that has      Occupancy (%)              3.1%            1.8%           8.6%
In 2010 Stockholm enjoyed over 10 million overnight stays and this              characterised the economy’s recovery from recession.                         ADR                        5.3%            3.7%           9.5%
boosted occupancy by 3.1% compared to 2009, taking occupancy to 69%,                                                                                         RevPAR                     8.6%            5.6%          17.3%
                                                                                The turmoil in financial markets is ongoing and downside risks still exist
close to the 2007 high. ADR in Swedish Kronor (SEK) also saw a gain, of
                                                                                from a greater deterioration of conditions in the Eurozone as well as a
5.3% at SEK 1110.4. Despite increases in supply, ADR and occupancy gains                                                                                     In local currency (Swedish Kronor)
                                                                                persistently strong Swedish Kronor.                                          Source: Econometric forecast: PwC 2011
drove a healthy recovery in RevPAR.                                                                                                                          Benchmarking data: STR Global 2011
                                                                                                                                                             A= Actual      F=Forecast
Supply trends
The Stockholm Visitors Board reports that the number of hotel rooms
increased by 55%, to 16,300 rooms between 2000 and 2010 – with most
built in 2008. This compares with a 2011 estimate of around 200 hotels and
26,000 rooms from STR Global, who estimate a further six hotels with
1,700 rooms are in the pipeline. Notwithstanding conflicting data sources,
to reach future 2020 growth goals, a report by Rese-och Turistnäringen i
Sverige (RTS) concludes that Stockholm will need 50 new hotels and 8,000
new rooms.
In September 2011 the tallest hotel in the Nordic Countries opened in Kista        Hotel forecast
Science City, situated between Stockholm city and Arlanda airport. The 34
                                                                                   Despite supply increases we anticipate continued robust ADR and
storey Scandic Victoria Tower with its 118 metres and 299 rooms is one of
                                                                                   occupancy growth both this year and in 2012
the most spectacular designed hotels in Sweden.
                                                                                   • Occupancy could see almost 2% growth this year and a further
                                                                                     8.6% in 2012, boosting occupancy to over 75%.
                                                                                   • ADR is also expected to see very good growth of 9.5% by 2012
                                                                                     setting a record high of SEK 1260.9.
“There is an ongoing ‘building boom’ of bigger                                     • As a consequence RevPAR could enjoy 17.3% growth in 2012,
hotels in Stockholm, but also smaller and more                                       taking it to SEK 948.9 – a record.
personal ones popping up. A handful of bigger
hotel complexes are also being constructed
north of Stockholm and nearby Arlanda, the
main international airport of Sweden.”

40 European cities hotel forecast PwC
European cities forecast

Vienna

Role                                                                               Opportunities and issues                                                      Annual hotel statistics
Vienna is the capital of Austria and the major economic capital close to the CEE   The Vienna meetings industry accounted for around 12.3% of total bed                                   2010A           2011F         2012F
region. As such, it accommodates major international organisations such as         nights in Vienna in 2010, according to the Vienna Meeting Report 2010,        Occupancy (%)               72.5          73.8           74.8
OPEC, the United Nations and innovation driven corporations are                    when the city hosted almost 3,000 congresses and corporate events.
accommodated there. Vienna has significant banking, insurance and                                                                                                ADR                         89.8          93.8           94.4
                                                                                   Example, the city hosted La Donna Fair for Women (30,000 participants) in
manufacturing sectors. Vienna is a cultural centre and host to extensive           2011. In 2012 Vienna hosts the World Barista Championship (12,000             RevPAR                      65.1          69.2           70.6
international trade and cultural events and had 3.4 million international          participants) and The European Congress of Radiology (20,000                  % growth on previous year
tourist arrivals in 2010.                                                          participants).                                                                Occupancy (%)             11.2%          1.7%            1.4%
Historical trading                                                                 Economic outlook                                                              ADR                       -3.5%          4.5%           0.6%
The number of overnight stays in Vienna has grown by 40% since 2000.               Vienna is Austria’s most important economic centre, generating
                                                                                                                                                                 RevPAR                     7.3%          6.3%            2.1%
Occupancy rates reached almost 73% in 2010, an increase of 11.2% over 2009,        approximately 28% of the nation’s GDP and employing about a quarter of
according to data from STR Global. ADR was about €90 in 2010, the third year       the nation’s workforce.                                                       In local currency (Euros)
                                                                                                                                                                 Source: Econometric forecast: PwC 2011
of decline since 2007 peaks. RevPAR grew by 7.3%, to reach €65, well below         Austria’s GDP grew by 3.7% year on year in the second quarter of 2011,        Benchmarking data: STR Global 2011
the 2008 peak of €80.*                                                             only slightly lower than in the first quarter (4.2%). The economy has been    A= Actual      F=Forecast

                                                                                   less affected than other economies by the current crisis, but a slowdown is
Supply trends                                                                      still expected in the second half of 2011 and into 2012.
There are approximately 370 hotels and 29,000 rooms in the city, according to
data from STR Global. We estimate around 77% of hotels fall into the class of                                                                                    Sofitel Vienna Stephansdom
3- and 4-star. STR Global estimate a further 15 hotels and almost 3,000 rooms
could be in the pipeline. Therefore almost 75% of the new rooms are expected
to open in 2012.


                                                                                      Hotel forecast
                                                                                      • Moderate occupancy growth in 2011 takes occupancy to just
                                                                                        over 74%.
                                                                                      • By 2012 new supply means slightly less growth.
                                                                                      • ADR is expected to see some recovery in 2011 to almost €94 but,
                                                                                        remains some way below past highs. We anticipate marginal
                                                                                        growth in 2012, taking rates to €94.4.
“The meetings industry accounted for over
                                                                                      • RevPAR sees 2.1% growth in 2012, taking it to almost €71, slightly
12% of bed nights in Vienna in 2010”                                                    below the annual average since 2000.


*Predominantly 3-5 star hotels                                                                                                                                                             PwC Best placed to grow            41
European cities forecast

Zurich

Role                                                                                 Opportunities and issues                                                      Annual hotel statistics
Zurich, Switzerland’s largest city, is an international financial, economical and    The large number of new rooms in the greater city area over the next                                   2010A           2011F         2012F
educational centre and gateway to many of Switzerland’s mountain                     five years means Zurich will become a more competitive market for             Occupancy (%)               72.7          73.8            74.7
destinations. Traditionally the home to numerous corporate headquarters,             participants and there is a real danger of oversupply, especially in the
financial institutions and educational institutions it has also evolved to a top                                                                                   ADR                       240.4          243.5          244.3
                                                                                     eventuality of a prolonged period of worldwide economic crisis. Some
city destination for leisure travellers. Zurich/Basel is one of the largest global   weaker, older operators might find it difficult to compete with the new       RevPAR                     174.8         180.4          182.5
pharmaceutical clusters.                                                             arrivals, many of which are supported by a strong brand.                      % growth on previous year

Historical trading                                                                   The continued strength of the Swiss Franc has already started to negatively   Occupancy (%)              6.4%          1.9%            0.8%
Zurich’s recent trading has been relatively unscathed by the worldwide               affect Swiss tourism destinations and a prolonged period of a weak Euro,      ADR                        2.4%          1.3%            0.3%
economic crisis, although hotels saw some steep declines in 2009. The market         combined with further slower European economic growth is expected to
                                                                                     have a negative effect on the Zurich market.                                  RevPAR                     9.0%          3.2%            1.2%
has increased by 650 rooms since 2008 and many of the existing properties
have completed substantial refurbishment and capex projects. Zurich remains                                                                                        In local currency (Swiss Francs)
                                                                                     Economic outlook                                                              Source: Econometric forecast: PwC 2011
one of the most expensive European cities in regards to room rates. 2010 in                                                                                        Benchmarking data: STR Global 2011
                                                                                     The key sector of the Zurich economy is financial services, which accounts
particular was a solid year for the market, with increases in occupancy and                                                                                        A= Actual      F=Forecast
                                                                                     for more than 20% of employees and much of the economic activity in the
RevPAR and near stable ADR, as the Swiss economy in general and the Zurich
                                                                                     city. However, the economic outlook remains uncertain, on account of
economic region continued to increase its importance as an international
                                                                                     continued struggles in the finance sector, weakening growth in the
financial hub and increased business and leisure arrivals.
                                                                                     Eurozone and the sharp appreciation of the Swiss Franc.
Supply trends
Zurich is Switzerland’s largest tourism destination, with a current rooms supply
of 7,300 rooms, including 36 4-star and 12 5-star properties. Current
developments are expected to add approximately 2,200 rooms over the next
five years, centred mainly around the airport, the football stadium and the
industrial conversion areas at Zurich West and Zurich Enge.


                                                                                        Hotel forecast
                                                                                        • Overall we expect steady but unspectacular ADR and occupancy
                                                                                          growth in 2011.
                                                                                        • By 2012 occupancy should reach 74.7%.
                                                                                        • ADR sees marginal growth next year taking rates to Swiss Franc
“A hotel room in Zurich remains one of                                                    244.3 - some way below 2007 peaks.
the most expensive in Europe.”                                                          • In 2012, RevPAR creeps up to Swiss Franc 182.5, a 1.2% increase
                                                                                          over 2011.


42 European cities hotel forecast PwC
Appendix
Methodology for hotel forecasts


                                  PwC Best placed to grow   43
Methodology for hotel forecasts


   This section outlines in more detail the PwC model used to      breakdown between domestic and different international                  The final type of data we used was the growth in the supply of
   forecast hotel occupancy, average daily rate (ADR) and          visitors in each city. For other macro-economic variables such          new rooms from 2000 to 2011, sourced from STR Global.
   revenue per available room (RevPAR).                            as interest rates and exchange rates, we used the relevant
                                                                   national levels.                                                        Final specifications
   Econometric model                                               The model also incorporates some dummies as explanatory                 The final specifications for the city models were chosen
   The econometric models used were similar to the PwC UK          variables. We included quarterly dummies to control for the             according to which explanatory variables exerted a statistically
   Hotels Forecasts models, based on a Vector Autoregression       strong seasonality of the data. Terrorism dummies were                  significant influence on the dependent variables. This means
   (VAR) framework. Each city has an independently-estimated       included to account for the effects of 9/11 and specific terrorist      different explanatory variables were included in each model,
   VAR model. This type of model was chosen because it allows      attacks such as those in Istanbul, Madrid, Moscow and London            as well as varying lag lengths. The table below provides an
   for interaction between occupancy and average room rates, as    bombings over the decade. Dummy variables were also                     overview of the dependent and explanatory variables used in
   we observe in the market. Each VAR uses occupancy rate          included for the impact of the recent “Arab Spring”.                    final specifications of the models.
   growth and real ADR growth as dependent variables, while the
   explanatory variables include lags of the dependant variables
   and a set of macroeconomic explanatory variables.
                                                                   Variables and data sources used in the model
   Data                                                                                         Variable                        Data source
   The dependent variables were based on data from STR Global       Dependent variables         Occupancy %                     STR Global
   for the period January 2000 – June 2011, containing monthly
                                                                                                ADR                             STR Global
   information on occupancy, ADR and Revenue Per Available
   Room (RevPAR). We averaged these data to create a                Explanatory variables       GDP                             Eurostat, Turkstat
   quarterly series.                                                                            Exchange rates                  Thomson Reuters, Datastream
                                                                                                Unemployment                    Eurostat, Turkstat
   For the explanatory variables, we used:
                                                                                                Investment                      Eurostat
   • a range of macroeconomic data,                                                             Consumer expenditure            Eurostat
   • dummy variables based on historical events, and,                                           Domestic interest rate          National central banks

   • data on the supply of rooms.                                                               Hotel room supply               STR Global

   The macroeconomic data covered both the relevant domestic
   markets, and relevant international markets (e.g. United
   States) where statistically significant. For example, GDP and
   household consumption data was based on a weighted average
   across a range of countries. The weighting used reflected the


44 European cities hotel forecast PwC
The adjacent table provides details of the different economic      Important economic drivers
drivers which had a relationship with the hotels markets in
these cities (along with the lag period in number of quarters in
                                                                                       Exchange                      US          Domestic     Consumer                     Supply of
parentheses). As can be seen, optimal lag lengths varied                        GDP      rates    Unemployment   unemployment   investment   expenditure   Interest rate    rooms
between zero and three quarters, with a one-quarter lag, or no
                                                                   Amsterdam   ü (1)     ü (1)        ü (1)                                                     ü
lag, being typical.
                                                                   Barcelona   ü (1)     ü (1)                                                                                 ü

Market projections                                                 Belfast     ü (1)      ü
                                                                   Berlin      ü (1)                                                                          ü (1)            ü
We used the model to generate projections for ADR and
occupancy in each city through to Q4 2012. Projections for the     Dublin      ü (1)     ü (1)                        ü                                                        ü
explanatory variables were from two sources:                       Edinburgh   ü (2)

1.   Macroeconomic variables were drawn from PwC in-house          Frankfurt   ü (1)                                                ü
     forecasts                                                     Geneva      ü (1)     ü(3)
                                                                   Istanbul      ü        ü           ü (1)
2.   Supply of rooms forecasts were based on PwC analysis of
     STR Global data                                               London        ü       ü (1)                        ü
                                                                   Madrid                                                           ü                                          ü
                                                                   Moscow                              ü             ü (1)                                                    ü (2)
                                                                   Paris                 ü (1)                                                   ü
                                                                   Rome        ü (2)    ü (1)*                        ü
                                                                   Stockholm                          ü (1)                                                     ü              ü
                                                                   Vienna      ü (1)                                                                            ü              ü
                                                                   Zurich      ü (1)      ü                                         ü                                         ü (2)


                                                                                                                                                           PwC Best placed to grow     45
46 European cities hotel forecast PwC
Contacts

Austria                    France                   Germany
Wolfgang Vejdovsky         Anne-Claire Ferrie       Dirk Hennig              Markus Hauk
Director                   Partner                  Partner                  Manager
+43 1 501 88 1150          +33 1 56 57 12 42        +49 30 2636-1166         +49 69 9585 5910
wolfgang.vejdovsky@at.     anne-claire.ferrie@fr.   dirk.hennig@de.pwc.com   markus.hauk@de.
pwc.com                    pwc.com                                           pwc.com


Ireland                                             Italy                                             Netherlands             Russia
Ann O’Connell              Jennifer Gillen          Nicola Anzivino          Caterina Moliterno       Bart Kruijssen          Robert Gruman         Oleg Malyshev
Partner                    Senior Manager           Partner                  Manager                  Partner                 Partner               Partner,
+353 (0)1 792 8512         +353 (0)1 792 8856       +39 348 8519842          +39 (0)2 80646378        +31 88 792 6037         +7 495 232 5725       +7 495 967 6138
ann.oconnell@ie.pwc.       jennifer.gillen@ie.      nicola a anzivino@it.    caterina.moliterno@it.   bart.kruijssen@nl.      robert.gruman@ru.     oleg.malyshev@ru.
com                        pwc.com                  pwc.com                  pwc.com                  pwc.com                 pwc.com               pwc.com


Spain                      Sweden                                            Switzerland              Turkey
Stefan Mundorf             Carola Näsdal Skarp      Madeleine Hansson        Nicolas Mayer            Adnan Akan              Bilgütay Yasar        Engin Alioglu
Partner                    Consultant               Director                 Director                 Partner                 Partner               Partner
+34 915 685 202            +46 (0)250 289 12        +46 (0)40 6412822        +41 58 792 2191          +90 212 326 6260        +90 212 326 6414      +90 212 376 53 06
stefan.mundorf@es.pwc.     carola.naesdal.skarp@    madeleine.hansson@se.    nicolas.mayer@ch.        adnan.akan@tr.pwc.com   bilgutay.yasar@tr.    engin.alioglu@tr.pwc.com
com                        se.pwc.com               pwc.com                  pwc.com                                          pwc.com


United Kingdom
Robert Milburn             Liz Hall                 Stephen Broome           Yael Selfin              Richard Snook           Northern Ireland      Scotland
Hospitality & Leisure      Head of Hospitality &    Hotels Specialist        Head of                  Economist               Stephen Curragh       Bruce Cartwright
Leader                     Leisure Research         +44 (0)20 7212 8510      Macro Consulting         +44 (0)20 7212 1195     Partner               Partner
+44 (0)20 7212 4784        +44 (0)20 7213 4995      stephen.broome@uk.       +44 (0)20 7804 7630      richard.snook@uk.       +44 (0)8 9041 5495    +44 (0)131 260 4087
robert.j.milburn@uk.pwc.   liz.hall@uk.pwc.com      pwc.com                  yael.selfin@uk.pwc.com   pwc.com                 stephen.curragh@uk.   bruce.cartwright@uk.
com                                                                                                                           pwc.com               pwc.com


                                                                                                                                                     PwC Best placed to grow   47
www.pwc.com/hospitality
This publication has been prepared for general guidance on matters of interest only, and does not constitute professional advice. You
should not act upon the information contained in this publication without obtaining specific professional advice. No representation or
warranty (express or implied) is given as to the accuracy or completeness of the information contained in this publication, and, to the
extent permitted by law, PricewaterhouseCoopers does not accept or assume any liability, responsibility or duty of care for any
consequences of you or anyone else acting, or refraining to act, in reliance on the information contained in this publication or for any
decision based on it.
© 2011 PwC. All rights reserved. Not for further distribution without the permission of PwC. “PwC” refers to the network of member
firms of PricewaterhouseCoopers International Limited (PwCIL), or, as the context requires, individual member firms of the PwC
network. Each member firm is a separate legal entity and does not act as agent of PwCIL or any other member firm. PwCIL does not
provide any services to clients. PwCIL is not responsible or liable for the acts or omissions of any of its member firms nor can it control the
exercise of their professional judgment or bind them in any way. No member firm is responsible or liable for the acts or omissions of any
other member firm nor can it control the exercise of another member firm’s professional judgment or bind another member firm or PwCIL
in any way.


EP6-2011-07-22-1811-AC

European cities hotel forecast 2011 & 2012

  • 1.
    www.pwc.com/hospitality Best placed to grow European cities hotel forecast 2011 & 2012 October 2011 NEW hotel forecast for 17 European cities
  • 3.
    In this issue Introduction 4 Key findings 5 Setting the scene 6 The cities best placed to grow 7 Economic and travel outlook 15 The European cities hotel forecast 23 Appendix: methodology 43 Contacts 47 PwC Best placed to grow 3
  • 4.
    Introduction Europe has the biggest hotel and travel market in the world, but its cities and its hotel markets are undergoing change. Countries and cities alike are being buffeted by new economic, social, technological, environmental and political currents. Europe has already begun to feel the winds of change as the old economic order shifts eastwards and economic growth becomes more elusive. While some cities struggle, hotel markets in other, often bigger and better connected cities prosper. For many countries provincial markets have been hit harder than those in the larger cities. In this report we look forward to 2012 and ask which European cities’ hotel sectors are best placed to take advantage of the changing economic order. Are these the cities of the so called ‘old’ Europe or the cities of the fast growing ‘emerging’ economies such as Istanbul and Moscow? What will be driving the growth? What obstacles do they face? Will the glut of new hotel rooms built in the boom years prove difficult to digest? The 17 cities in this report are all important tourist destinations. Some are capitals or regional centres, some combine roles as leading international financial and asset management centres, transportation hubs or tourism and conference destinations. Some like London and Paris are major economies in their own right, of a size larger than medium-sized national economies such as Sweden or Switzerland. We have provided some city rankings for comparison, but of course it’s not just about growth rates. Each city operates at differing levels of maturity and profitability and they are all at different stages in the hotel cycle, reflecting wider global and domestic macroeconomic drivers as well as demand elements specific to that city. This report combines PwC’s* recognised econometric forecasting and macro-consulting expertise with its extensive hotel and travel capability across Europe. We have forecast the outlook for demand, average daily rates (ADR) and revenue per available room (RevPAR). The economic forecasts were generated based on PwC’s own economic forecast scenarios (September 2011). Details of the method and assumptions used to compile the forecasts can be found in the appendix. We have used a variety of reputable statistical sources which include: hotel benchmark data series and supply data from STR Global; other supply and tourism data from national tourism organisations, Lodging Econometrics, Euromonitor International and other commercial sources; and economic data from Eurostat, Turkstat, National Central Banks and Thomson Reuters DataStream. 4 European cities hotel forecast PwC * “PwC” refers to the network of member firms of PricewaterhouseCoopers International Limited (PwCIL), or, as the context requires, individual member firms of the PwC network.
  • 5.
    Key findings 10 key findings 1. Despite unsettled times hotels remain a bright and resilient sector. “Most markets bounced back 2. Different themes play out across the cities but most have bounced back from the past downturn, when declines in in 2010 and 2011, although RevPAR of 20% or more were common. many still remain below their pre-recession RevPAR peaks” 3. Still, hotels in many cities remain below pre-recession RevPAR peaks. 4. Cities like London, Paris, Istanbul and Amsterdam stand out from the crowd with strong recoveries. 5. The five cities forecast to show highest annual RevPAR growth from 2010 to 2012 are: Stockholm (11.3%), Istanbul (10.0%), Amsterdam (9.0%), Dublin (8.8%) and London (8.3%). 6. For 2011, Istanbul, Dublin and Amsterdam will enjoy double digit RevPAR growth but by 2012 only Stockholm is expected to see growth in double figures. 7. In other cities where the economic outlook is less bright we see a less inviting outlook for the hotels sector. 8. A word of caution: the star quality of the cities analysed may not be indicative of the state of the hotel sector in the country as a whole – key cities tend to perform better than provincial locations. 9. There will be support for those cities with relatively resilient domestic economies and in some cases geo-political events such as the ‘Arab Spring’ may continue to benefit alternative tourism destinations, such as Istanbul or Barcelona. 10. The impact of austerity measures on consumer, corporate and government spending on travel is a concern. A continued business travel recovery is crucial to deliver the growth we forecast, but inevitably the economic slowdown and sovereign debt crisis will weigh on this sector. PwC Best placed to grow 5
  • 6.
    Setting the scene:recent European trading 2011: H1 rebound and H2 slowdown Each country has its own unique hotel sector characteristics and Chart 1: 2010 RevPAR in the 17 cities Europe-wide metrics pose almost as many questions as answers. We hope that by focusing on European cities this report provides €200 readers with some interesting comparisons. €175 2010 €150 That said, it’s useful to try to draw together the recent European €125 trading scene. The financial downturn in 2008 and 2009 hit the €100 hotel sector badly and in many cities hotels saw demand slump and €75 prices tumble. For many countries their provincial hotel sectors saw, and continue to see, harsher trading conditions than the key €50 cities. Chart 1 shows the RevPAR picture in the cities in this survey €25 in 2010, a year of steady recovery for many cities and of very robust €0 growth for others. London topped the occupancy league at over Paris Geneva Zurich London Istanbul Rome Amsterdam Moscow Stockholm Barcelona Frankfurt Edinburgh Vienna Berlin Madrid Dublin Belfast 83%. After converting ADR and RevPAR from local currencies to Source: STR Global 2011 Note: Calculated from local currencies, except Istanbul which has been converted from Euros. Euros, Geneva had the highest ADR at €217.5 and Paris the highest RevPAR at €161.6. A more detailed historical trading picture can be found in the Cities Forecasts on pages 22 to 42. 2011 to date 2011 is almost over and trading has enjoyed a strong first half for many. But performance has started to reflect the economic mood swing since August and according to data from STR Global, European RevPAR was materially weaker in August than in July. Occupancy remained firm, but for many countries rates weakened. According to a report from Citi Group based on data from STR Global, core European countries appeared to perform most strongly e.g. France and Spain delivered strong performances in August (+8.5% and +8.8%) while Germany was +3% and the UK was +4.5% in sterling terms. Weaker performing countries were Turkey, Hungary and Israel. 6 European cities hotel forecast PwC
  • 7.
    The cities bestplaced to grow PwC Best placed to grow 7
  • 8.
    The cities bestplaced to grow 2011 forecast: waving the recession goodbye? Many of the cities have managed to wave goodbye to the recession as they Table 1: the 2011 cities forecast continue to recover at their own pace and pattern. Some global cities such as % change on previous year (ranked by RevPAR % growth) London and Paris have thrived. Occupancy ADR RevPAR Istanbul -1.8% 21.7% 19.5% We expected all but one city to see further growth in 2011. Many, like Dublin 6.1% 5.7% 12.1% Amsterdam enjoyed a robust 2011 H1 performance. Some, including London Amsterdam 4.2% 7.0% 11.5% and Barcelona enjoyed an exceptionally strong Q2. Yet, others benefitted from political events. Others saw stronger growth potential blocked by over supply. Barcelona 8.5% 1.7% 10.4% Table 4 shows the full 2011 and 2012 forecast. Key results include: Rome 3.7% 5.5% 9.4% Double digit RevPAR growth for a few... London -0.8% 8.9% 8.1% Paris -1.0% 7.5% 6.4% • We expect four cities to see double digit RevPAR growth in 2011. These are Istanbul (by a large margin and with its second successive year of double digit Vienna 1.7% 4.5% 6.3% growth), Dublin, Amsterdam (also its second year of double digit growth) and Stockholm 1.8% 3.7% 5.6% Barcelona. Edinburgh 3.9% 1.1% 5.1% ... and good RevPAR growth for many... Madrid 3.7% 0.9% 4.6% • 8-10%: London (double digit growth in 2010) and Rome manage strong Moscow 0.4% 3.7% 4.1% growth even if RevPAR doesn’t get into double figures. Zurich 1.9% 1.3% 3.2% • 6-8%: Vienna and Paris (double digit growth in 2010). Geneva 3.1% -0.2% 2.9% Berlin 3.3% -0.8% 2.5% • 4-6%: Moscow, Madrid, Edinburgh and Stockholm. Frankfurt 0.1% 1.5% 1.6% • 2%-4%: Zurich, Geneva and Berlin (double digit growth in 2010). Belfast 0.1% -7.6% -7.5% • Less than 2%: Frankfurt (following spectacular 22% RevPAR growth in Note: Percentage change calculated from local currencies, except Istanbul which has been converted to Euros. 2010). Declines: Belfast where hoteliers could see their third year of RevPAR declines – albeit the rate of decline appears to be slowing. 8 European cities hotel forecast PwC
  • 9.
    The cities bestplaced to grow 2012 forecast: lonelier at the top Despite considerable uncertainty around the economic outlook, the road ahead Table 2: the 2012 cities forecast still looks positive for most of the cities we have analysed, although the rates of % change on previous year (ranked by RevPAR % growth) growth are slowing. But the risks are firmly to the downside. Occupancy ADR RevPAR Stockholm 8.6% 9.5% 17.3% By 2012 it’s likely to become more lonely at the top as double digit RevPAR London 1.7% 5.7% 8.3% growth eludes most cities ... Amsterdam 2.0% 4.4% 6.5% In 2012 we anticipate only Stockholm will manage double figure RevPAR Madrid 3.2% 2.3% 5.6% growth, reflecting the Swedish economy’s strong recovery from recession, Moscow 2.5% 3.0% 5.6% although it is expected to slow markedly in 2012. Dublin 2.8% 2.6% 5.5% ... and more will see lower RevPAR growth than in 2011 Berlin 1.4% 3.6% 5.0% • 6-8%: London and Amsterdam. Geneva 2.4% 0.9% 3.3% • 4-6%: Berlin, Madrid, Moscow and Dublin. Paris 0.6% 1.9% 2.6% • 2-4%: Vienna, Barcelona, Paris, Geneva. Barcelona 1.1% 1.3% 2.4% Vienna 1.4% 0.6% 2.1% • Less than 2%: Istanbul, Edinburgh, Zurich and Frankfurt. The specific reasons are discussed in detail in the City sections but include considerable Frankfurt 0.9% 0.8% 1.7% new openings and some challenging comparisons with 2011. Edinburgh 0.5% 1.1% 1.6% Declines: marginal declines for Rome and Belfast. Zurich 0.8% 0.3% 1.2% Istanbul 3.1% -1.8% 1.2% Best placed to grow 2010-2012 Rome -3.4% 3.4% -0.1% Looking across 2011 and 2012*, the five top performing cities are Belfast 6.1% -6.5% -0.9% Stockholm (11.3%), Istanbul (10.0%), Amsterdam(9.0%), Dublin (8.8%) Note: Percentage change calculated from local currencies, except Istanbul which has been converted to Euros. and London (8.3%). *CAGR 2010-2012 PwC Best placed to grow 9
  • 10.
    The cities bestplaced to grow Which European city markets are best placed to grow in 2012? Stockholm Moscow Edinburgh Belfast Dublin Amsterdam Berlin London Frankfurt Paris Vienna Zurich Geneva Rome Barcelona Istanbul Madrid Forecast RevPAR growth 2012 10 European cities hotel forecast PwC >16% 6-16% 4-6% 2-4% 0-2% <0%
  • 11.
    The cities bestplaced to grow The fullest cities: London, Edinburgh and Amsterdam 2012 forecast for occupancy London • Of course it’s not just about growth rates, each city operates Edinburgh at differing levels of maturity and levels of profitability and Amsterdam many are at diverse stages of the hotel cycle. Paris • Looking at occupancy levels, London operates at a very Vienna high level, virtually full in peak months. We expect Stockholm 2012 will see the capital fill further as the Olympics Zurich come to town. Barcelona • Edinburgh, Amsterdam, Paris, Vienna and Stockholm Istanbul could all see occupancy in excess of 75% in 2012. Dublin Berlin Geneva Madrid Belfast Rome Frankfurt Moscow Average 73% 60% 65% 70% 75% 80% 85% Occupancy Source: Econometric forecast: PwC 2011 Benchmarking data: STR Global 2011 PwC Best placed to grow 11
  • 12.
    The cities bestplaced to grow The most expensive cities: Geneva, Paris and Zurich 2012 forecast for ADR Geneva • Looking at our ADR predictions for 2012: at one end of the Paris spectrum are Geneva, Paris and Zurich, where average Zurich ADR could exceed €200. (For Geneva ADR could be close to London €265.) Istanbul • At the other end of the spectrum Vienna, Madrid, Moscow Edinburgh, Berlin, Dublin and Belfast have ADR under Rome €100. Amsterdam • Not so good for hoteliers in these cities at the lower end of Stockholm the ranking but good value for consumers. Frankfurt Barcelona Vienna Madrid Edinburgh Berlin Dublin Belfast Average € 136.70 €0 €50 €100 €150 €200 €250 €300 ADR Source: Econometric forecast: PwC 2011 Benchmarking data: STR Global 2011 12 European cities hotel forecast PwC
  • 13.
    The cities bestplaced to grow The highest RevPAR: Geneva, Paris and Zurich (again!) 2012 forecast for RevPAR Geneva • High occupancy and rates growth translates into high Paris RevPAR forecasts in 2012. Zurich • Geneva may see RevPAR reach €183. Zurich also sees London RevPAR over €160 and for London it’s more than €120. Istanbul Amsterdam • Istanbul, Amsterdam and Rome could all see RevPAR exceed €100. Rome Moscow Barcelona Stockholm Frankfurt Edinburgh Vienna Berlin Madrid Dublin Belfast Average € 99 €0 €50 €100 €150 €200 Source: Econometric forecast: PwC 2011 Benchmarking data: STR Global 2011 PwC Best placed to grow 13
  • 14.
    14 European citieshotel forecast PwC
  • 15.
    Economic and traveloutlook PwC Best placed to grow 15
  • 16.
    Economic and traveloutlook It’s a divergent economic outlook Business travel demand is closely aligned to GDP growth, especially the business investment element of growth. Consumer demand for travel depends largely on disposable income levels. Different macroeconomic variables clearly have a varying impact on cities. Confidence is key and the current outlook is highly uncertain. Sovereign debt crisis continues into the autumn What will these economic trends mean for the hotel sector? The Eurozone sovereign debt crisis intensified over the summer We have seen that despite the modest economic performance across European economies in the first half of 2011, the hotels market and threatened to engulf the larger, “too big to fail” economies has thrived. During the recession businesses and consumers were expected to cut back on spending which is partially discretionary of Spain and Italy. including holidays and business travel. This was indeed the case, with many cities experiencing declines in RevPAR of 20% or more in 2008 and 2009. There is considerable uncertainty over the outlook for Greece and other Southern European economies. This has also Most markets bounced back in 2010 and 2011, although many still remain below their pre-recession RevPAR peaks. The big damaged confidence in European banks, many of which have question now is whether this bounce back will continue for the rest of this year and into 2012 as the sovereign debt crisis threatens high exposure to sovereign debt. to bring about a double dip recession. The European economic outlook has deteriorated over the last few months. We expect extremely modest growth in most countries Growth of core Eurozone nations stalled in the first with a few exceptions such as Turkey, with growth of 6.2% in 2011 and 3.1% in 2012. Sweden and Russia are also strong performers half of the year with growth of over 4.0% expected in 2011, although the global slowdown will take its toll and the Swedish economy is expected to The latest data suggests that the sovereign debt crisis has spilled slow markedly in 2012. The weakest performing national economies are expected to be Spain and Italy, which are expected to grow by into the real economy. Weak growth figures in core nations such less than 1% this year. See map. as Germany and France in Q2 2011 have caused growth Overall we think the hotel market will remain resilient, albeit with some differing trends across cities. We expect the strongest projections for 2011 to be marked down. performers over the next 18 months to be Istanbul, Stockholm and Amsterdam. The hotels sector in each of these cities has shown a searing performance in the first half of the year. Going forward we expect to see support in these cities from relatively resilient Simultaneous fiscal austerity will act as a drag on domestic economies and in some cases geo-political events. Istanbul in particular has experienced exceptional growth in hotels economic growth going forward demand, as political uncertainty in many other Middle Eastern and North African countries has reduced the numbers of tourists The majority of European economies are implementing fiscal elsewhere in the region. austerity packages to reduce government borrowing and to help In other cities, where the economic outlook is less bright we see a less inviting outlook for the hotels sector. These cities include ease market concerns over fiscal sustainability. Belfast, where growth is likely to be affected by cuts in public spending; and Frankfurt, where a weak financial sector will weigh on In the short term, we expect the resulting tax increases and public business travel in particular. spending cuts will act as a further drag on economic growth. 16 European cities hotel forecast PwC
  • 17.
    Economic and traveloutlook The European sovereign debt crisis is far from over Key to economic ‘weathermap’ Actual Forecast Forecast Outlook GDP growth Sweden 2010 2011 2012 5.3 4.3 2.3 Russia United Kingdom 2010 2011 2012 2010 2011 2012 4.0 4.4 4.3 1.8 0.9 1.0 Netherlands 2010 2011 2012 Ireland 1.8 1.8 1.2 2010 2011 2012 -1.0 1.6 1.2 Germany 2010 2011 2012 Austria 3.5 2.6 1.6 2010 2011 2012 2.1 2.9 1.9 France 2010 2011 2012 Switzerland 1.5 1.7 1.5 2010 2011 2012 2.6 2.0 1.5 Greece Spain 2010 2011 2012 2010 2011 2012 Italy -4.5 -4.8 -1.2 -0.1 0.6 0.9 2010 2011 2012 Turkey 1.2 0.7 0.5 2010 2011 2012 8.9 6.2 3.1 Source: PwC 2011 PwC Best placed to grow 17
  • 18.
    18 European citieshotel forecast PwC
  • 19.
    It’s a competitiveand Economic and travel outlook “Istanbul is the fastest growing tourism challenging travel destination in the world, set to receive tourism revenues of $10.2 billion in 2011, an market increase of more than 30% over 2010.” The most visited region Europe is the most important region of the world for Top 20 European destinations by international travel volumes and also generates huge numbers of domestic trips. Europe received around 471 million international tourist arrivals international tourism arrivals in 2010 (+3% on 2009 according to data from UNWTO). Recovery was slower than in other regions due to the air traffic disruption caused by the eruption of the Eyjafjallajokull volcano and the economic uncertainty. Most travel is intra-regional i.e. Europeans travelling within Europe. In 2011 Russia and France lead intra-European source markets. In terms of non-European markets, US arrivals have been particularly robust. And the most visited cities 2.3 St Petersburg Stockholm 2.6 Consumers value holidays and want to travel and Europe can boast many of the world’s leading and most dynamic cities. 3.6 Moscow However, it’s an increasingly competitive global travel market. In terms of international tourist arrivals the map shows the most visited European cities in 2010. Four cities had over 5 million Dublin 4.2 international visitor arrivals – London, Paris, Istanbul and 3.9 Amsterdam 2.8 Berlin Rome. A truly global city, London tops the global as well as London 14.1 European list and receives almost double the volume of 3.7 Prague 3.5 Kiev international arrivals of the next mega European city, Paris. Paris 7.8 Munich 2.1 Barcelona and Dublin follow close behind with 4.5 million and 3.4 2.7 Budapest 4.2 million apiece. Vienna Barcelona 5.5 Rome 4.5 7.5 Istanbul Madrid 3.2 1.1 Palma de Mallorca Lisbon 1.7 1.8 Athens 2010 international arrivals (in millions) >8 million 6-8 million 4-6 million Source: Euromonitor International 2011 3-4 million 2-3 million 1-2 million PwC Best placed to grow 19
  • 20.
    Economic and traveloutlook The spectre of a darker travel outlook looms Why continue to visit? cash strapped consumers may find affording The reasons for visiting the cities are diverse. them harder. Hotels are unlikely to be on the For some like Frankfurt it’s mainly business ‘shopping list’ for austerity hit households. On a driven. For others like Berlin it’s a large positive note, PwC research earlier this year proportion of leisure travellers. Equally some showed that holidays remained a top spending like Berlin are driven by mainly domestic priority for European households. Interestingly demand and others like Geneva mainly other key priorities involved paying down debt. international. For the global gateway cities On balance, for many cities leisure travel it’s a mix, and therein lies their strength. remains an important demand driver and consumers have adopted ways of stretching Europe saw a travel rebound in H1 their budgets, including ‘shopping clever’ as 2011 ... they trawl the internet, look for deals and Data from the European Travel Commission shorten their length of stay. (ETC) in July 2011 reported encouraging travel trends showing that Europe enjoyed a ... but prospects are for a less rebound in travel to the region during the first promising H2 2011 and beyond half of 2011. As global economic worries intensify, So far the continued business travel recovery uncertainties around the sustainability of the has been very good news for the hotel sector as travel recovery grow. ETC anticipate that it continues to recover from the 2008/9 growth in travel to Europe will slow in the financial crisis. Broadly speaking companies remainder of 2011, as comparisons are made to acknowledge they have to travel to grow but stronger performance in 2010 and as the sector remain down on excess and drive a hard fights against the challenges of weak economic bargain looking for value and flexibility. growth. Overall it is unlikely that travel volumes and spend will bounce back quickly. Consumer household budgets remain under The spectre of a darker travel outlook looms pressure in many countries and although over Europe. holidays remain important for our wellbeing, 20 European cities hotel forecast PwC
  • 21.
    Economic and traveloutlook Supply: if you build it, The concrete mixers and cranes have still been they may not come busy in some cities, despite the funding drought Digesting new supply can be problematic The current economic climate and financing drought has The European slowed up new development across many areas of Europe and while this may have mitigated some of the impact of the construction recessionary slowdown, the concrete mixers and cranes have pipeline still been busy. For others the legacy of past over-building continues to hover over the sector and the city reports show there are still plenty of new hotels dragging down occupancy and rates, e.g. Berlin or Madrid. Data produced by key hotel benchmarking companies including Stockholm STR Global and Lodging Econometrics track hotel development Moscow pipelines across Europe and show around 122,000-125,000 rooms in the pipeline in Europe. Of this, some 330-400 hotels Edinburgh (54,000-71,000 rooms) are under construction. Belfast Dublin Where are they all being built? STR Global lists the largest Amsterdam pipelines (as at July 2011) in UK (particularly London in London Berlin advance of the Olympic Games), Russia (in advance of the Winter Olympics 2014 and the World Cup in 2018), Germany, Frankfurt Turkey (especially Istanbul), Italy, France, Spain and Austria. Paris Vienna Zurich Cities with considerable hotels under construction as opposed Geneva to in the pipeline include London, Istanbul, Moscow, Stockholm, Berlin and Amsterdam. In contrast Geneva has little new supply planned. Rome Barcelona Istanbul Madrid New rooms under construction >5,000 2,000-3,000 1,000-2,000 500-1,000 <500 Source: STR Global July 2011, Frankfurt PwC Research PwC Best placed to grow 21
  • 22.
    22 European citieshotel forecast PwC
  • 23.
    The European citieshotel forecast 2011 and 2012 PwC Best placed to grow 23
  • 24.
    The European citiesforecast 2011 and 2012 Table 3: European cities annual hotel statistics Forecast percentage change on previous year 2011 2012 Occupancy ADR RevPAR Occupancy ADR RevPAR Amsterdam 4.2 7.0 11.5 2.0 4.4 6.5 Barcelona 8.5 1.7 10.4 1.1 1.3 2.4 Belfast 0.1 -7.6 -7.5 6.1 -6.5 -0.9 Berlin 3.3 -0.8 2.5 1.4 3.6 5.0 Dublin 6.1 5.7 12.1 2.8 2.6 5.5 Edinburgh 3.9 1.1 5.1 0.5 1.1 1.6 Frankfurt 0.1 1.5 1.6 0.9 0.8 1.7 Geneva 3.1 -0.2 2.9 2.4 0.9 3.3 Istanbul -1.8 21.7 19.5 3.1 -1.8 1.2 London -0.8 8.9 8.1 1.7 5.7 8.3 Madrid 3.7 0.9 4.6 3.2 2.3 5.6 Moscow 0.4 3.7 4.1 2.5 3.0 5.6 Paris -1.0 7.5 6.4 0.6 1.9 2.6 Rome 3.7 5.5 9.4 -3.4 3.4 -0.1 Stockholm 1.8 3.7 5.6 8.6 9.5 17.3 Vienna 1.7 4.5 6.3 1.4 0.6 2.1 Zurich 1.9 1.3 3.2 0.8 0.3 1.2 Source: Econometric forecast: PwC 2011 Benchmarking data: STR Global 2011 Percentage change calculated from local currencies, except Istanbul which has been converted to Euros. 24 European cities hotel forecast PwC
  • 25.
    PwC Best placedto grow 25
  • 26.
    European cities forecast Amsterdam Role Opportunities and issues Annual hotel statistics Amsterdam is the financial and cultural capital of the Netherlands, home to Amsterdam’s role as a major cluster in business services (such as consulting 2010A 2011F 2012F many large Dutch institutions as well as seven of the world’s top 500 and IT), transport and logistics, has helped to drive demand from business Occupancy (%) 74.1 77.2 78.7 companies. The Amsterdam Stock Exchange, the oldest stock exchange in travellers in recent years. We expect this and the relatively robust recovery the world, is located in the city centre. Amsterdam’s conference centre and to underpin an expansion in the hotels market. In addition, a meetings ADR 119.6 127.9 133.6 main attractions, including its historic canals and museums, draw more recovery appears underway aided by investment at the key conference and RevPAR 88.6 98.7 105.1 than 3.9 million international visitors annually. exhibition centre, the RAI. % growth on previous year Historical trading Economic outlook Occupancy (%) 1.4% 4.2% 2.0% RevPAR tumbled by 22% in 2009, compared to the prior year, and The recession in the Netherlands was milder than many other countries. ADR 4.5% 7.0% 4.4% occupancies fell to 67%, according to data from STR Global, as the The economy shrunk by a little under 4% in 2009, and has since recovered RevPAR 16.5% 11.5% 6.5% economic recession bit hard. 2010 shows a solid RevPAR recovery. Overall close to pre-crisis levels. Whilst the Eurozone sovereign crisis is having an ADR saw a 4.5% gain in 2010 and occupancy climbed back up to 74%. effect on Amsterdam and the surrounding areas, we still expect the In local currency (Euros) Source: Econometric forecast: PwC 2011 Hotel market performance data shows that for the first half of 2011 economy to continue to grow in 2011 and 2012. Benchmarking data: STR Global 2011 Amsterdam hotels continued to register robust RevPAR gains of 16% and A= Actual F=Forecast However, the minority government is pursuing a path towards fiscal are getting closer to pre-recession performance. sustainability by implementing a medium-term consolidation plan which aims Supply trends to reduce the deficit by over 3% of GDP. These measures are already underway As of July 2011, the Greater-Amsterdam area has around 240 hotels with some and we expect this to drag on economic growth over the next few years. 24,000 rooms. The number of hotels is estimated to have decreased slightly compared to April 2010. According to a study by CBRE, many plans for new hotels exist, either as new construction or through reconversion of existing property. Data from STR Global suggest there are around 2,100 rooms in the supply pipeline. Amsterdam appears to be sticking to hotel policy formulated in 2007 in which the need for 9,000 extra rooms by 2015 was set out. Hotel forecast Notable hotel openings include the Holiday Inn - Amsterdam at Schiphol • 2011 is expected to see double digit RevPAR growth of 11.5% (April 2011), the Mint Hotel – soon to be rebranded a Hilton (June 2011), driven by both rising rates and strong demand. Alrov’s Conservatorium Hotel (September 2011) and the Crowne Plaza • At almost 79% occupancy in 2012 could pip pre recession levels. (November 2011). • Strong demand will buoy up ADR growth to nearly €134 in 2012. • In 2012 Amsterdam could see record RevPAR levels, in nominal “ The Amsterdam hotel market has seen terms, at €105. an astonishingly fast recovery and could soon overtake pre-recession trading” 26 European cities hotel forecast PwC
  • 27.
    European cities forecast Barcelona Role Opportunities and issues Annual hotel statistics Barcelona is the capital of the autonomous region of Catalunya and an The high volume of new rooms in the city is likely to continue to 2010A 2011F 2012F important business centre. It is a popular destination for tourists from all depress hotel performance. However, the political uncertainty in Occupancy (%) 67.5 73.3 74.1 over Europe and its hotel structure reflects this. In 2010 Barcelona North Africa is likely to have a beneficial effect on Spain’s tourism welcomed 4.5 million international tourist arrivals, according to ADR 110.8 112.8 114.2 sector overall, including Barcelona. Euromonitor. It is an important port for cruise ships and a city with a lot of RevPAR 74.8 82.7 84.7 activity in the MICE sector. Economic outlook Barcelona is a key part of the Spanish economy. As well as being a major % growth on previous year Barcelona is a key part of the Spanish economy. As well as being a major tourist hub, the Barcelona area accounts for around a sixth of Spanish Occupancy (%) 8.4% 8.5% 1.1% tourist hub, the Barcelona area accounts for around a sixth of Spanish industrial production, and it attracts approximately a quarter of all foreign ADR 1.1% 1.7% 1.3% industrial production, and attracts approximately a quarter of all foreign investments to Spain. investments to Spain. RevPAR 9.6% 10.4% 2.4% Despite this, the weakness in the Spanish economy will weigh on the In local currency (Euros) Historical trading economy. The government is putting through sharp cuts in government Source: Econometric forecast: PwC 2011 Over the last few years, RevPAR declined sharply as a combination of spending, property markets remain paralysed and the banking sector is Benchmarking data: STR Global 2011 A= Actual F=Forecast weaker demand and increasing supply impacted hoteliers. But the city struggling. We expect little or no growth in the Spanish economy over the remains very popular amongst travellers and occupancy is picking up again next two years. as prices fall (tumbling over 16% in 2009 according to data from STR Global). The increasing number of low-cost flights to the city’s airport and nearby Girona have been an important factor in stabilising demand. RevPAR increased by 9.6% in 2010 to around €75, following a 23% drop in 2009. Supply trends Hotel forecast Supply data from STR Global shows Barcelona has around 460 hotels and • 2011 Q1 saw occupancy growth of 5% and in Q2 occupancy was 44,000 hotel rooms (as at July 2011). In addition, around 800 rooms are 15% higher than the year before. While our projections expect listed as in the pipeline for the city. The majority of hotels are four-star/ occupancy to weaken sharply in the second half of the year, the upscale and above. strong Q2 should drive 8.5% occupancy growth in 2011. • Overall we expect RevPAR to manage a double digit bounce-back in 2011, largely driven by the occupancy recovery. • In 2012, occupancy and ADR growth is expected to be more restrained. An ADR gain of 1.3% takes ADR to €114.2, still €16 lower than the peak in 2007. “Barcelona is well placed to capitalise from a • RevPAR continues to recover slowly creeping up to €84.7, an encouraging trend but still low compared to past peaks. recovery in international tourism and occupancy is picking up again as rates fall – low cost flights have been an important factor in stabilising demand ” PwC Best placed to grow 27
  • 28.
    European cities forecast Belfast Role the Giant’s Causeway World Heritage site, a peace bridge across the Annual hotel statistics Belfast is the capital of Northern Ireland (one of 12 regions comprising the UK) River Foyle in a rejuvenated Londonderry/Derry and the 2012 London 2010A 2011F 2012F and is the region’s business, conference and financial centre. Two of the region’s Olympics and Belfast’s hoteliers are expecting a busy year. Occupancy (%) 64.0 64.0 67.9 three airports are in the Belfast Metro area, as is a deep-water port that Nearly a half a million pounds has been invested in Northern Ireland facilitates cruise ships. tourism infrastructure and collectively Northern Ireland’s tourism chiefs ADR 56.0 51.7 48.3 hope that this will attract more visitors in 2012, persuade them to stay RevPAR 35.8 33.1 32.8 Historical trading longer and spend more – and then come back and do it again. % growth on previous year 2010 was a difficult year for Northern Ireland’s hotel sector. While demand for self-catering, caravanning and camping grew, the hotel sector suffered due to a Economic outlook Occupancy (%) -3.2% 0.1% 6.1% reduction in both corporate business travel and the conference market. Belfast is Northern Ireland’s educational and commercial hub. Fears over ADR -8.6% -7.6% -6.5% Average hotel occupancy was the lowest for a decade, exacerbated by a 7% the Eurozone debt crisis, and importantly the cutbacks in UK government RevPAR -11.6% -7.5% -0.9% increase in room numbers as new hotels, planned before the recession, came spending are all combining to slow Northern Ireland’s growth. We expect it on line. Hotels experienced rising operating costs and diluted earnings, with to be a lacklustre 0.8% in 2011. In local currency (Sterling) Source: Econometric forecast: PwC 2011 occupancy levels, at around 64%, well below the 75% experienced in 2007. Sluggish growth in the UK and the continued difficulties in the Republic of Benchmarking data: STR Global 2011 A= Actual F=Forecast Ireland are further reducing the prospects for Northern Ireland’s exports Supply trends and recovery. Overall, Northern Ireland has around 140 hotels, with around 7,750 rooms, the majority in the Belfast Metropolitan area. A spate of hotel investment in the early 2000s came on stream to coincide with the economic downturn, where all sectors suffered from the subsequent overcapacity. Recent land acquisitions and planning applications suggest that confidence may be returning to the sector as two new hotels are planned. Opportunities and issues In 2012, Belfast will recall the centenary of the sinking of the Belfast-built Titanic on her maiden voyage to New York. The £97 million Titanic exhibition centre expects half a million visitors in 2012 alone and will Hotel forecast become a permanent piece of Belfast’s history. Add a new visitor centre at • Occupancy remains flat this year but could see around 6% growth in 2012 taking occupancy to almost 68% • ADR however continues to struggle and we anticipate further declines of 7.6% and 6.5% in 2011 and 2012 as rates slump to £48 • Hoteliers could see four years of declines in RevPAR from 2009 to Belfast hoteliers are expecting a 2012, albeit the rate of decline will hopefully slow to -0.9% in 2012. better year in 2012 with a new Titanic At £32.80 RevPAR would be a record low. exhibition centre and the Olympics 28 European cities hotel forecast PwC
  • 29.
    European cities forecast Berlin Role Opportunities and issues Annual hotel statistics Berlin is the capital of Germany and the centre of the country. It is also a centre The relatively weak economy in the city is an issue for Berlin. GDP per 2010A 2011F 2012F for life science, arts, IT, services, political and cultural education, research and capita in Berlin lies about 10% below the German average due to a limited Occupancy (%) 68.9 71.2 72.2 the media. Tourism consists of a mixture of business and leisure travellers with number of national and international HQs; a problem that will probably 60% of travellers domestic. Conferences, exhibitions and trade fairs are also ADR 87.2 86.5 89.6 remain for the mid-term. However, Berlin has the potential to improve its important demand drivers. In 2010 Berlin attracted 2.8 million international status as a European metropolitan city, which could affect the hotel RevPAR 60.1 61.6 64.7 arrivals, according to data from Euromonitor. industry positively. The city hosts several national and international fairs; % growth on previous year this leads to some performance peaks during the year. The new Berlin Occupancy (%) 2.2% 3.3% 1.4% Historical trading Airport (to be opened in 2012) will improve flight connections to Berlin; a Occupancy saw steady growth between 2002 and 2007, increasing from positive driver for tourism. ADR 8.4% -0.8% 3.6% 59.9% to 69.8% and, although hotel supply in Berlin increased considerably, RevPAR 10.8% 2.5% 5.0% tourist numbers grew even more strongly. Occupancy declines in 2008 and Economic outlook 2009 were moderate, slipping between -1.0 and -1.3 percentage points. In Berlin’s economy is dominated by the service sector, with around 80% of all In local currency (Euros) 2010 occupancy recovered to 68.9% and the figures for the six months to companies doing business in services. Until recently, Germany had looked Source: Econometric forecast: PwC 2011 Benchmarking data: STR Global 2011 June 2011 exceed the prior year level slightly, according to data from STR immune to the current Eurozone wide economic crisis, but there are signs A= Actual F=Forecast Global. Increasing hotel supply in Berlin has depressed prices. ADR yo-yoed that growth may slow in the second half of the year as the prospect of between € 79 (2005) and € 88 (2010). reduced global demand for German exports begins to take its toll. Supply trends According to data from STR Global there are around 600 hotels and over 58,000 rooms in hotels in Berlin, with the share of budget hotels increasing. There have been around 3,500 new room openings in recent years and around 3,705 more are in the pipeline. The area around the Berlin main station (Hauptbahnhof) and Schoenefeld, the location of the new international airport, are hot spots for several new hotel projects. A prominent hotel opening will be the Waldorf Astoria between Zoologischer Hotel forecast Garten station and the Memorial Church. • The 2011 out-turn sees a 3.3% occupancy gain take occupancy to 71.2% and, although ADR sees a marginal decline, a 2.5% RevPAR gain takes RevPAR to €61.6 – a record. • In 2012 its more growth and more records broken as occupancy gains take occupancy levels to 72.2%. • ADR turns positive in 2012 and at €89.6 is the highest since 2001. “The area around the Berlin main station • In 2012 RevPAR could see a further 5% growth, taking it to (Hauptbahnhof) and Schoenefeld, the location almost €65. of the new international airport, are hot spots for several new hotel projects” PwC Best placed to grow 29
  • 30.
    European cities forecast Dublin Role Opportunities and issues Annual hotel statistics Dublin is the capital and economic centre of Ireland. The city is globally Due to the prolonged economic uncertainty, the Irish hotel market is taking 2010A 2011F 2012F recognised as a leading location for a range of internationally traded financial longer to recover than other countries. Clearly, for some stability in the Irish Occupancy (%) 67.1 71.2 73.2 services; pharma and ICT companies e.g. it is home to the (European) market and for room rates to return to sustainable levels, a further adjustment in headquarters of Google, Facebook, LinkedIn etc. Dublin is the most popular bedroom capacity is required. ADR 77.4 81.8 83.9 tourist region in the country. Early indications are that the sector is beginning to see a turnaround. According RevPAR 51.9 58.2 61.4 to the latest CSO figures, overseas tourism numbers in Q2 2011 are up over 15% % growth on previous year Historical trading (240k) compared to the same period in 2010. However, it should be noted that The Irish tourism sector has suffered a serious fall in demand over the last few the ash cloud affected tourism numbers in 2010. Numbers were up across all the Occupancy (%) 5.7% 6.1% 2.8% years and hotels experienced some of the sharpest falls in Europe. However, in key markets i.e. UK, America and Europe. There was also a modest increase in ADR -9.3% 5.7% 2.6% 2010 occupancy in Dublin grew for the first time in four years to just over 67%, ADRs helped by events such as the Ireland-England rugby match in March, the RevPAR -4.1% 12.1% 5.5% according to data from STR Global. This increase was driven by further visits of Queen Elizabeth II and the US President in May, which created positive discounting and the opening of venues such as the Grand Canal Theatre, the headlines around the world. In local currency (Euros) National Conference Centre and the Aviva Stadium. At the same time ADRs Source: Econometric forecast: PwC 2011 Benchmarking data: STR Global 2011 continued to decrease by a further 9% to approximately €77.40 in 2010. Economic outlook A= Actual F=Forecast The Irish economy has performed stronger than expected in 2011, driven primarily Supply trends by exports . At the start of Q4, the Central Bank of Ireland revised upwards its There are 157 registered hotels with 18,900 bedrooms in Dublin, including nine growth forecast for GDP for the year. On the other hand, domestic sources of five-star and 44 four-star hotels according to Fáilte Ireland. growth remain limited. Tourism is seen as a key driver of Ireland’s economic Reflecting the economic boom, Ireland and Dublin saw huge growth in hotel and renewal. Recent Government initiatives to increase tourism include a reduction in bedroom supply since the 1990s. Much of the hotel supply growth was driven by air travel tax on passengers leaving Irish airports, a reduction on the VAT rate on a the availability of capital allowances for investors over a seven year period. There number of leisure-oriented goods and services e.g. hotel rates; a visa waiver scheme are now issues with oversupply, 2011 being the first year that Dublin has had a for travellers with a UK visa who wish to travel to Ireland. decrease in bedroom supply (300 rooms). Issues Hotel forecast Much of the hotel supply growth was encouraged by the availability of capital It is generally felt that occupancy has and will continue to rise slowly as allowances for investors over a seven year period. Clearly for some stability in the overseas tourist numbers grow over the next few years. It is unlikely Irish market and for room rates to return to sustainable levels an adjustment in that ADRs will reach the heights of 2007 any time soon. Until such bedroom capacity is required. time as the oversupply in the Irish hotel market is addressed there will continue to be pressure on the hotel rates. • Steady occupancy gains of 6% in 2011 and a more modest 2.8% growth in 2012, taking occupancy to 73.2%. • Some ADR recovery in 2011 taking rates to almost €82 – still below “Room rates will continue to be under 2007 peak of almost €109. pressure as long as there is oversupply in the • RevPAR will start to creep back and could reach €61.4 by 2012 – Dublin market. However, from a consumer still over €20 lower than its previous peak. point of view, Dublin now has some of the least expensive rooms in the Eurozone.” 30 European cities hotel forecast PwC
  • 31.
    European cities forecast Edinburgh Role Opportunities and issues Annual hotel statistics Edinburgh is one of the financial and historical centres of Europe, home to a A number of events (including the Edinburgh International Festival) are held in 2010A 2011F 2012F number of large global financial institutions and a variety of cultural the city each year, which means that Edinburgh continues to attract a Occupancy (%) 77.7 80.7 81.2 attractions. The city boasts a diverse range of features from Dynamic Earth and significant number of visitors on a continuing basis. Also, Glasgow will host the Edinburgh Castle to the Camera Obscura and Royal Yacht Britannia drawing 2014 Commonwealth Games which will have a positive impact on the tourism ADR 76.4 77.2 78.0 over 2.5 million visitors each year. prospects for Edinburgh. RevPAR 59.3 62.3 63.3 % growth on previous year Historical trading Economic outlook In 2010 RevPAR saw a significant improvement across the year as a whole in Occupancy (%) 3.1% 3.9% 0.5% Edinburgh has been consistently one of the most prosperous parts of the UK. comparison to 2009, a sign that the hotel and tourism industry is beginning to The economy of Edinburgh is largely based around the services sector, with ADR 0.5% 1.1% 1.1% recover following the recession. So far in 2011, this trend has continued as tourism and financial services being particularly important. RevPAR 3.6% 5.1% 1.6% Edinburgh hotels have achieved RevPAR levels closer to those witnessed before There is evidence that the depreciation of sterling against the Euro and other the economic downturn. RevPAR peaks during August each year when the city In local currency (Sterling) currencies has provided a significant fillip for the local market, which is Source: Econometric forecast: PwC 2011 hosts the Edinburgh International Festival which draws visitors to Edinburgh. Benchmarking data: STR Global 2011 popular with international visitors. A= Actual F=Forecast Supply trends As at June 2011, there are 155 hotels in Edinburgh, offering a total of 10,412 rooms. The number of rooms has increased marginally (2.9%) compared to June 2010. Furthermore, many landlords throughout the city opt for short term lets during the festival, sometimes earning two or three times more than they would from letting their property over a long term period. Edinburgh city council recently stated that, despite some concerns in the city of over-supply, more hotels are still needed in Edinburgh across all categories. Hotel forecast • Occupancy, already high, is expected to end 2011 at around 80.7% and to nudge up higher still in 2012. • ADR is also well above the UK regional average and should see a “In the UK market, Edinburgh has the highest gain of 1.1% taking rates to £78 in 2012. occupancies and ADR outside London” • RevPAR levels should reach £63.3 by 2012, almost back to pre-recession levels. PwC Best placed to grow 31
  • 32.
    European cities forecast Frankfurt Role Supply trends Annual hotel statistics Frankfurt is Germany’s financial centre and a leading business hub. It is home Frankfurt provides around 15,000 rooms in some 117 hotels, according to data 2010A 2011F 2012F to the European Central Bank, the Frankfurt Stock Exchange and the German from STR Global. Around 58% of the hotel supply is in the four and five star Occupancy (%) 65.5 65.5 66.1 Federal Bank. Business tourism is an important sector for the hotel industry. segment and mainly caters for business travellers. PwC research suggests Overnight stays are also generated by the airport, the second largest in Europe. future new development could generate up to 2,500 additional rooms within ADR 112.5 114.2 115.2 The fairground hosts some international fairs. Leisure tourism is relatively the next three years. New openings will include two Hilton Hotels at the RevPAR 73.7 74.9 76.1 weak in comparison. airport (including a Garden Inn) scheduled for the end of 2011. % growth on previous year Historical trading Economic outlook Occupancy (%) 12.5% 0.1% 0.9% Between 2004 to 2007 occupancy in Frankfurt ranged between 62% and 64%, The three pillars of Frankfurt’s economy are finance, transport, and trade fairs. ADR 8.3% 1.5% 0.8% due to low weekend business volumes. During the financial crisis occupancy The ongoing Eurozone debt crisis has impacted the financial sector. However, RevPAR 21.9% 1.6% 1.7% fell to 60.7% and 58.2% in 2008 and 2009 respectively. Germany’s remarkable there are signs of resilient domestic demand even as global demand slows. economic recovery in 2010 has lead to strong gains taking occupancy back up In local currency (Euros) Source: Econometric forecast: PwC 2011 to 65.5%. Pre-crisis ADR remained relatively stable in 2006 to 2008 (€111 to Benchmarking data: STR Global 2011 € 113). In 2009 ADR fell 7% to € 105. 2010 saw an 8% boost to almost € 113, A= Actual F=Forecast driven by economic growth and a VAT reduction for hotels in Germany in 2010. Hotel forecast • After a robust leap in 2010, occupancy is expected to remain flat in 2011 with only around 0.9% growth in 2012, taking occupancy to just over 66% - high by historic standards. • ADR remains a little stronger and we anticipate further growth, although not as strong as in 2010, of 1.5% and 0.8% in 2011 and “ 2011 saw the biennial Frankfurt Motor Show roar 2012 as rates nudge up to €115 – on a par with 2001. into town as well as the annual Frankfurt Book • ADR drives RevPAR growth of 1.6% and 1.7% in 2011 and 2012, taking RevPAR to €74.9 and €76.1. Fair, the biggest book and media fair in the world with around 7,500 exhibitors from 110 countries. However due to the ongoing increases in new hotel supply, room rates achieved during the fair periods do not reach the levels attained a few years ago.” 32 European cities hotel forecast PwC
  • 33.
    European cities forecast Geneva Role Opportunities and issues Annual hotel statistics Geneva is Switzerland’s second largest tourism destination. An international The geopolitical developments in the Middle East and Arabic peninsula 2010A 2011F 2012F centre of finance, culture and politics, it hosts many global company might affect the ability and willingness of the Middle Eastern clientele to Occupancy (%) 65.4 67.4 69.0 headquarters, financial institutions and over 100 international organizations, travel to Geneva for extended summer stays, resulting in material loss of including the United Nations, the International Red Cross and the WTO. ADR 300.7 300.0 302.8 revenue for the luxury segment. Around 70% of visits are for business. Due to its spectacular setting, it is also a RevPAR 196.6 202.2 208.9 The continued strength of the Swiss Franc has already started to negatively popular tourism destination and the gateway to western Switzerland’s % growth on previous year affect Swiss tourism destinations and a prolonged period of a weak Euro, mountain resorts. combined with a further deterioration of European economic performance Occupancy (%) 6.7% 3.1% 2.4% Historical trading is expected to eventually have a negative effect on the Geneva market. ADR -3.2% -0.2% 0.9% Geneva’s recent trading has not been as badly impacted by the global economic The dearth of new hotel projects should help support the sector. RevPAR 3.3% 2.9% 3.3% crisis as some cities but the hotel sector saw some large occupancy falls in late Economic outlook 2008 and 2009. The continued influx of foreign companies to the city, many Geneva’s economy is mainly services oriented. The city has an important and In local currency (Swiss Francs) Source: Econometric forecast: PwC 2011 establishing corporate or regional headquarters, resulted in a steady increase in old financial sector which is specialised in private banking and financing of Benchmarking data: STR Global 2011 demand by business travellers. As in prior years, Geneva remains one of the international trade. It is also an important centre of commodity trade. A= Actual F=Forecast most expensive European cities in regards to room rates. 2010 was a good year for the Geneva lodging market, with an increase in occupancy across all But the value of the Swiss Franc (which has risen 27% against Euro since June segments. The reduction in ADR was largely compensated by a strong increase 2010) is having an impact on trade. Exports account for around half of GDP, in RevPAR – principally driven by the added service offerings introduced by the making Swiss economy particularly vulnerable to an uncompetitive exchange 5-star properties as part of their facilities upgrades. rate. The Swiss National Bank has recently pledged to defend the franc to prevent it rising above €1.2. Supply trends Switzerland’s second largest tourism destination, features a current rooms supply of 6,300 rooms, including 24 4-star and 15 5-star properties. New project developments have been limited, due to high property prices, competition for assets by corporate headquarters and limited possibilities of expansion due to the proximity of the French border. No major projects are currently under development. Hotel forecast • We anticipate slower occupancy growth but occupancy levels could almost reach 70% in 2012 – high by past comparisons. • ADR is expected to remain under pressure, well below past peaks “Geneva’s recent trading has not been as badly and see only marginal growth in 2012. impacted by the global economic crisis as some • RevPAR nudges up around 3.3% in 2012 to Swiss Franc 208.9. cities but political developments in the Middle East and Arabic peninsula could well result in reduced summer visits from the Middle Eastern clientele, significantly affecting Geneva’s 5-star hotel segment in the coming season.” PwC Best placed to grow 33
  • 34.
    European cities forecast Istanbul Role The global economic shift from west to east will continue to benefit Istanbul, Annual hotel statistics A centre of cultural tourism thanks to its historic architecture, holy sites and already a financial hub of considerable importance, particularly in terms of 2010A 2011F 2012F museums, Istanbul (population 12 million) is readily accessible by air (with conference tourism. This has also been a factor in the expansion of national carrier, Turkish Airlines. Occupancy (%) 73.1 71.8 74.0 two airports), land and sea. It’s increasingly sophisticated and regulated retail system is a further draw for visitors, as is fair and conference tourism. Already The unrest in North Africa that began in early 2011 has had a positive impact on ADR 133.6 162.6 159.7 playing a key role in Turkey’s economy; this is likely to increase if current plans tourism to Turkey in general and Istanbul will continue to have a share in this. RevPAR 97.7 116.8 118.2 to move the country’s key financial institutions to Istanbul are realised. Istanbul % growth on previous year Economic outlook received 7.5 million international arrivals in 2010. The Turkish economy expanded at 8.8% in the year to Q2 2011 and the Occupancy (%) 15.1% -1.8% 3.1% Historical trading outlook appears far brighter than for the Eurozone economies. A ADR -2.6% 21.7% -1.8% Occupancy rate has been largely consistent over the past five years. 2008 and breakdown highlighted strength across the domestic economy, including a rise in private consumption and fixed investment. In addition, recent RevPAR 12.1% 19.5% 1.2% were exceptions due to the global economic crisis. Similarly, increasing trends in rates (ADR) were also disrupted. RevPAR was immediately impacted in currency depreciation against the Euro should help exporters to reduce the In Euros 2009, dropping 6.7% against 2008. Demand is high year-round, peaking in economy’s growing trade imbalance. Source: Econometric forecast: PwC 2011 Benchmarking data: STR Global 2011 May to October. A= Actual F=Forecast Supply trends Figures from the Istanbul Culture and Tourism Directorate put the number of beds in Istanbul at 108,340 in 2010. Data from STR Global suggest 348 hotels and almost 33,000 rooms. The majority of rooms are on the European side of Hotel forecast the city, and in 5-star hotels. STR also suggest another 18 hotels with almost 3,300 rooms are in the pipeline. Some two thirds of hotels under construction We have converted the Turkish lira projections into Euro and while the are in the 5-star category. appreciation of the lira softens the growth in 2011 somewhat, even taking this into account, there has been a very sharp increase in Opportunities and issues RevPAR in 2010 and 2011 – particularly the first half of 2011 and our Istanbul is the fastest growing tourism destination in the world, and is set to projections are for little further growth in the second half of the year: receive tourism revenues of $10.2 billion in 2011, an increase of more than • Overall, occupancy is expected to end 2011 down slightly (showing 30% over the previous year. The city attracted 7.5m international arrivals in us the importance of Istanbul’s role in 2010 as European Capital of 2010. Istanbul benefits from visa-free travel from numerous countries, (many Culture). We expect to see increased occupancy in 2012 as Turkey of them neighbouring Turkey), the number of which looks set to increase. begins to tap into a growing travel-hungry middle class from the emerging markets. • ADR (converted to Euros) will see a dramatic 21.7% gain in 2011 but fall back by 1.8%% in 2012. “Istanbul is the fastest growing tourism • As a result, RevPAR will also increase significantly, by almost 20%, destination in the world, set to receive this year but level off in 2012. tourism revenues of $10.2 billion in 2011, an increase of more than 30% over 2010” 34 European cities hotel forecast PwC
  • 35.
    European cities forecast London Role Economic outlook Annual hotel statistics London is the largest urban area in Europe, a mega city and one of the world’s The UK economy has seen only lacklustre growth for the past year and 2010A 2011F 2012F largest financial centres. It leads in many fields and global business clusters looking ahead PwC now expect only modest growth for the UK economy of Occupancy (%) 83.0 82.3 83.6 include creative industries, pharmaceuticals, finance and education. It is the 0.9% GDP growth in 2011 and 1.0% in 2012. Families will continue to feel world’s leading destination for international tourism attracting over 14 million the squeeze on their incomes from low wage growth and above target ADR 123.4 134.6 142.2 overseas arrivals in 2010. In total 26.2 million staying visits came to London’s inflation and we expect real consumer spending to shrink in 2011. Planned RevPAR 110.9 111.8 120.1 extensive cultural, sporting and historical attractions last year. In summer fiscal austerity measures will act as a further drag on growth ahead. % growth on previous year 2012 London hosts the Olympic and Paralympic Games. So far, the London hotel market has remained resilient due to its gateway Occupancy (%) 2.7% -0.8% 1.7% Historical trading city status and the boost from the weak pound. Looking forward, London’s ADR 8.6% 8.9% 5.7% London bounced back quickly from the financial crisis and recession of economy is less dependent on public spending than most other UK regions, so we would expect it to be relatively less affected by fiscal austerity. RevPAR 11.5% 8.1% 8.3% 2008-2009 and trading in 2010 ended the year with double digit RevPAR growth of 11.5%, driven by strong ADR growth. 2011 is turning out excellently However, the latest figures are some cause for concern, with In local currency (Sterling) too and operators reported only a temporary brake in business from the civil unemployment rising to 10.0% in June-August 2011, up from 9.0% a year Source: Econometric forecast: PwC 2011 Benchmarking data: STR Global 2011 riots in August. ago. The ongoing difficulties in the finance sector, and the knock-on effects A= Actual F=Forecast on the rest of London’s economy, may be one reason for this. Supply trends London has around 106,000 rooms in serviced accommodation (Melvin Gold 2011). In advance of the Olympics, London has seen above average levels of new hotel supply coming online, bringing new names and brands. In 2010 and 2011 over 5,000 new rooms opened or reopened and in 2012 more will open – many Hotel forecast putting areas of London such as the east, close to the Olympic Park, on the hotel map for the first time. New names include Shangri-La, Bulgari, Citizen M, Aloft, With the Olympics in 2012 we expect a good year but perhaps Corinthia and ME by Melia. surprisingly not as good as many expect – the shoulder quarters could see pre- and post-Olympic dips. Opportunities and issues • Overall, RevPAR should end 2011 with another bumper year, up In 2012 London will see the Olympic Games together with events such as the 8.1% as rates continue to boom. Farnborough International Air Show and the Queen’s Diamond Jubilee attracting sports fans and tourists to London. Over £11bn of new investment is • London occupancy can’t get that much better and we expect expected in the capital between 2010 and 2012 in a range of new developments. London to be full up in Q3 2012 with occupancies in the 90s. Overall next year should see occupancies reach around 84%. • Rates in 2012 could see around 6% growth to £142.2. • RevPAR in 2012 depends on how many extra visitors come to “With the Olympics in 2012 London should have a London but the capital could see 8.3% growth taking RevPAR to good year and a great Q3. But perhaps surprisingly £120. not as good as many expect and the shoulder quarters could see pre- and post-Olympic dips” PwC Best placed to grow 35
  • 36.
    European cities forecast Madrid Role Economic outlook Annual hotel statistics Madrid is the capital of Spain and its main business centre. Although it Madrid is Spain’s second largest industrial centre. Its economy is also 2010A 2011F 2012F attracts an important number of tourists and has some of the most heavily dependent on public administration. This is a vulnerability with the Occupancy (%) 63.7 66.1 68.2 important museums in Europe, its focus lies on the business traveller and it government pushing through sharp reductions to public spending. is also an important destination for MICE. Additional uncertainty comes from the political situation. The prime ADR 88.4 89.2 91.2 minister has called for early elections in November in a bid to give any RevPAR 56.3 59.0 62.2 Historical trading incoming government a clear mandate to deal with the debt crisis from % growth on previous year During 2008 and 2009, RevPAR declined sharply (by 26% in 2009, 2012 onwards. Disappointing economic data and political uncertainty according to data from STR Global) as demand weakened but new hotels mean we forecast the Spanish economy to expand at 0.6% in 2011 and Occupancy (%) 10.9% 3.7% 3.2% opened, especially in the luxury segment. There is at present a clear excess 0.9% in 2012. ADR -2.5% 0.9% 2.3% of five-star hotels, and as a result projects that had been initiated in the RevPAR 8.1% 4.6% 5.6% boom years have recently been terminated. This trend will affect prices in this segment over the near future. Nonetheless, ADR falls between 2008 In local currency (Euros) Source: Econometric forecast: PwC 2011 and 2010 helped occupancy to pick up (showing a 11% gain in 2010) and Benchmarking data: STR Global 2011 supporting a RevPAR recovery – although at around €57 in 2010 this is a A= Actual F=Forecast long way below 2007 peaks of close to €77. Supply trends According to data from STR Global there are 353 hotels and 45,700 rooms in greater Madrid, with around 2,000 rooms still in the pipeline. Hotel forecast • For 2011, Madrid is expected to experience steadily improving occupancy growth, albeit significantly lower than the growth rate in 2010. ADR declines should halt as ADR reaches almost €90. • By 2012 occupancy could reach 68%, just below 2007 levels. • Although ADR sees marginal growth this year and a bit more in 2012, taking rates to €91.2, rates remain a long way below past “Spain’s tourism sector has performed well peaks. • At €62.2 in 2012, RevPAR will be around €10 below 2007 levels. recently and many hope that it will help lead the way out of the economic downturn” 36 European cities hotel forecast PwC
  • 37.
    European cities forecast Moscow Role Opportunities and issues Annual hotel statistics Moscow is Russia’s financial centre and home to more than 600 of the The World Cup in 2018, and the Winter Olympics at Sochi in 2014 are 2010A 2011F 2012F 1,250 credit institutions operating in the country. Nearly 80% of the prestigious global events, which will attract fans and tourists and raise Occupancy (%) 62.1 62.4 63.9 country’s financial resources are exchanged through the city’s financial investor interest all over the world. In addition Moscow and St. Petersburg system. Moscow is the most populated city in Europe, with a population of will hold the 2016 International Ice Hockey (IIHF )World Championship. ADR 5,723.9 5,936.7 6,117.3 10.6 million in 2010. There are numerous places of architectural and RevPAR 3,555.6 3,701.6 3,909.1 historic interest including museums, galleries and exhibition halls, as well Economic outlook % growth on previous year as parks. About 3.6 million international tourists visited Moscow in 2010. The Russian economy appears in relatively good health. Unemployment, which reached 9.4% during the recession has declined to 6.5%. GDP has Occupancy (%) 9.2% 0.4% 2.5% Historical trading been growing at an annualised rate of around 4% since the beginning of ADR -10.1% 3.7% 3.0% Moscow saw significant growth in occupancy but larger declines in ADR in 2010. But having experienced a relatively deep downturn in 2009, the RevPAR -1.9% 4.1% 5.6% 2010, and as a consequence suffered a 1.9% fall in RevPAR. In contrast, the economy is still smaller than it was in 2008. The other concern on the first half of 2011 saw 5% occupancy gains and almost 8% ADR growth horizon is the reliance on high oil prices. Two thirds of Russia’s exports and In local currency (Roubles) Source: Econometric forecast: PwC 2011 drive a 13% RevPAR boost, taking RevPAR to RUB 3,817.9. much of its tax receipts come from oil. A decline in the oil price would lead Benchmarking data: STR Global 2011 to a sharp deterioration in the trade balance and the government budget. A= Actual F=Forecast Supply trends According to data from STR Global, Moscow has 136 hotels with almost 36,000 rooms – some 700 rooms opened within the last 12 months. Over half of the city’s accommodation stock comprises of 3-star hotels. STR pipeline data in July 2011 lists 20 hotels with 4,600 rooms in the pipeline for Moscow. If all the scheduled openings occur as planned, room numbers in the capital will increase by more than 1,000 rooms in 2011, representing a larger increase than in 2010. Hotel forecast • Occupancy is likely to struggle to absorb all the new hotel supply additions in Moscow and we estimate only marginal growth in 2011 but 2.5% growth in 2012. • ADR is expected to continue to recover in 2011 with a 3.7% gain and further growth of 3% in 2012. “In Moscow alone, there are just over 9,000 • RevPAR should turn positive again this year with just over 4% international standard rooms, which is equivalent growth and a further 5.6% in 2012. to around ten per cent of the hotel rooms in London, so there is still a terrific opportunity for international hotel operators with a presence here” PwC Best placed to grow 37
  • 38.
    European cities forecast Paris Role Opportunities and issues Annual hotel statistics Paris is a global city. It remains the number one tourist destination in the There is a busy annual calendar of trade shows like Le Bourget Air show 2010A 2011F 2012F world attracting over 28 million visitors (2010) to its numerous cultural and the Paris Car Show which has an impact on tourism. The London Occupancy (%) 77.6 76.9 77.4 venues (including some 130 museums and 463 parks and gardens). Paris Olympics is expected to attract visitors to Europe and France is positioning attracted 7.7m international arrivals in 2010, according to Euromonitor. itself as an ‘overspill’ location for the UK. ADR 208.1 223.7 228.0 According to the French Tourist Bureau, the French hotel industry has a RevPAR 161.6 171.9 176.4 turnover of €4.1 billion (2009), almost half of which comes from business Economic outlook % growth on previous year travel. Paris is not only the political and cultural capital of France but also its major financial and commercial centre. However the French recovery ground to a Occupancy (%) 4.5% -1.0% 0.6% Historical trading halt in the second quarter of 2011 and there are concerns over whether ADR 7.2% 7.5% 1.9% After very significant performance declines in 2009, trading saw a strong reforms to reduce the level of government spending will be successful. RevPAR 12.0% 6.4% 2.6% recovery in 2010, as occupancy recovered and ADR enjoyed robust growth French banks have also been under pressure recently due to their driving RevPAR up again. STR Global data (which does not include Accor In local currency (Euros) substantial holdings of Greek government debt. Source: Econometric forecast: PwC 2011 hotels) clearly shows this trend. Paris enjoyed a 12% bounce back in Benchmarking data: STR Global 2011 RevPAR to almost €162 in 2010. A= Actual F=Forecast Supply trends According to data from INSEE (2010) there are around 1,466 hotels and almost 78,000 rooms in Paris. To meet growth plans, the hotel industry anticipates the need for an extra 7, 000 hotel rooms in the city by 2020. In recent years there has been significant upgrading in the sector (with a decrease in 2-star rooms and an increase in 4-star luxury rooms). For example, the opening of the Shangri-La in 2010, the re-opening of Royal Monceau, and the arrival of Mandarin Oriental and Peninsula hotels in Hotel forecast 2011 and 2013 respectively. On top of a highly successful 2010, hoteliers should see further ADR In Paris in 2010, 27% of rooms were high end or luxury, affecting the growth, in 2011 and to a lesser extent in 2012. The strong RevPAR average price of hotel accommodation. numbers in 2011 are driven by an exceptionally strong first half of the year when ADR grew by 10% in Q1 and 18% in Q2. • Occupancy is expected to grow marginally in 2012 to take occupancy levels to just over 77%. • ADR continues to soar with two years of strong growth, to almost “In 2012, thanks to its strong attractiveness €228 by 2012. • RevPAR also sees strong growth to €176.4 in 2012. as a tourism destination, Paris should better resist the impact of a potential crisis on the hotel industry than any other French city” 38 European cities hotel forecast PwC
  • 39.
    European cities forecast Rome Role Opportunities and issues Annual hotel statistics Rome is Italy’s capital city and a unique destination with a mix of leisure and Since 1st January 2011 a room occupancy tax has been applied in Rome to 2010A 2011F 2012F business visitation, both national and international, and very good accessibility anyone staying overnight in a hotel inside Rome’s boundaries. Occupancy (%) 66.7 69.2 66.8 Important sectors include banking, high technology companies (aerospace, Big events in Rome this year included the Republic’s 150th anniversary in ADR 139.9 147.5 152.6 defence and telecommunications) and tourism. Education and media are also March (300,000 visitors) and the Pope Woytila beatification in May important and Rome is a centre for music, with one of the largest musical RevPAR 93.3 102.1 102.0 (1 million visitors) – both will have helped boost trading. venues in the world, the new Parco della Musica. Rome has the enclave of the % growth on previous year Vatican City within its territory. Rome received 5.5 million international Economic outlook arrivals in 2010, according to Euromonitor and is the third most visited city in The economy of Rome is characterized by the absence of heavy industry and it Occupancy (%) 7.7% 3.7% -3.4% Europe. is largely dominated by services, high-technology companies and the huge ADR 1.2% 5.5% 3.4% tourism sector. RevPAR 9.0% 9.4% -0.1% Historical trading Italy’s economy is in poor health however. GDP expanded by only 0.2% The slowdown of most Euro economies has affected visitation to the city over In local currency (Euros) (quarter-on-quarter) in Q2 2011, continuing from the weak 0.1% growth Source: Econometric forecast: PwC 2011 the last two years and Rome saw steep RevPAR falls in 2008 and 2009. Benchmarking data: STR Global 2011 experienced in the previous two quarters. Occupancy has, according to data from STR Global, seen 7.7% growth in 2010, A= Actual F=Forecast reaching almost 67%, still below 2006 highs. A 1.2% increase in ADR took rates in 2010 to €139.9 and RevPAR to €93.3%. Supply trends Based on data from ISTAT (the National Institute for Statistics) there were 1.063 hotels in Rome in 2010. In contrast estimates from STR Global report 457 hotels and 36,310 rooms. There is a relatively limited new full-service hotel supply pipeline for the Rome hotel market due to strict planning requirements and a lack of suitable sites for branded hotel developments. However, there were a handful of additions to supply during 2010, including the 151-bedroom NH Giustiniano. Rome’s hotel market is expected to increase by around 350 rooms in 2011 and STR Global estimate there are six hotels and 1,188 Hotel forecast rooms in the pipeline. • Occupancy is expected to grow by 3.7% in 2011 but a dip of 3.4% in 2012 means levels remain some way below 2006 peaks of 75%. • ADR sees strong growth this year and 3.4% growth in 2012 taking ADR to €152.6 (compared to €160.9 in 2007). “Big events in Rome this year included the Republic’s • RevPAR shows another year of strong recovery in 2011 but sees a 150th anniversary in March (300,000 visitors) and marginal decrease in 2012. the Pope Woytila beatification in May (1 million visitors) – both will have helped boost trading.” PwC Best placed to grow 39
  • 40.
    European cities forecast Stockholm Role Opportunities and issues Annual hotel statistics Stockholm, the capital of Sweden, is both a tourist destination and the Sweden is experiencing robust economic performance with one of the 2010A 2011F 2012F main business city. It is home to a rich cultural life and a great variety of strongest recoveries in the EU and we expect this to buoy up ADR and Occupancy (%) 69.0 70.3 75.3 events, restaurants and shopping experiences. Stockholm is the leading occupancy levels. An issue for the city is where to build almost 8,000 business city in Northern Europe with regional head offices for attractive new hotel rooms in the centre of Stockholm. ADR 1,110.4 1,151.8 1,260.9 international companies. The region attracted over 10 million overnight RevPAR 766.6 809.2 948.9 stays in 2010 and 2.6 million international arrivals. Economic outlook % growth on previous year The Swedish economy grew by 1% (quarter-on-quarter) in Q2 2011 Historical trading boosted by household consumption, continuing the strong growth that has Occupancy (%) 3.1% 1.8% 8.6% In 2010 Stockholm enjoyed over 10 million overnight stays and this characterised the economy’s recovery from recession. ADR 5.3% 3.7% 9.5% boosted occupancy by 3.1% compared to 2009, taking occupancy to 69%, RevPAR 8.6% 5.6% 17.3% The turmoil in financial markets is ongoing and downside risks still exist close to the 2007 high. ADR in Swedish Kronor (SEK) also saw a gain, of from a greater deterioration of conditions in the Eurozone as well as a 5.3% at SEK 1110.4. Despite increases in supply, ADR and occupancy gains In local currency (Swedish Kronor) persistently strong Swedish Kronor. Source: Econometric forecast: PwC 2011 drove a healthy recovery in RevPAR. Benchmarking data: STR Global 2011 A= Actual F=Forecast Supply trends The Stockholm Visitors Board reports that the number of hotel rooms increased by 55%, to 16,300 rooms between 2000 and 2010 – with most built in 2008. This compares with a 2011 estimate of around 200 hotels and 26,000 rooms from STR Global, who estimate a further six hotels with 1,700 rooms are in the pipeline. Notwithstanding conflicting data sources, to reach future 2020 growth goals, a report by Rese-och Turistnäringen i Sverige (RTS) concludes that Stockholm will need 50 new hotels and 8,000 new rooms. In September 2011 the tallest hotel in the Nordic Countries opened in Kista Hotel forecast Science City, situated between Stockholm city and Arlanda airport. The 34 Despite supply increases we anticipate continued robust ADR and storey Scandic Victoria Tower with its 118 metres and 299 rooms is one of occupancy growth both this year and in 2012 the most spectacular designed hotels in Sweden. • Occupancy could see almost 2% growth this year and a further 8.6% in 2012, boosting occupancy to over 75%. • ADR is also expected to see very good growth of 9.5% by 2012 setting a record high of SEK 1260.9. “There is an ongoing ‘building boom’ of bigger • As a consequence RevPAR could enjoy 17.3% growth in 2012, hotels in Stockholm, but also smaller and more taking it to SEK 948.9 – a record. personal ones popping up. A handful of bigger hotel complexes are also being constructed north of Stockholm and nearby Arlanda, the main international airport of Sweden.” 40 European cities hotel forecast PwC
  • 41.
    European cities forecast Vienna Role Opportunities and issues Annual hotel statistics Vienna is the capital of Austria and the major economic capital close to the CEE The Vienna meetings industry accounted for around 12.3% of total bed 2010A 2011F 2012F region. As such, it accommodates major international organisations such as nights in Vienna in 2010, according to the Vienna Meeting Report 2010, Occupancy (%) 72.5 73.8 74.8 OPEC, the United Nations and innovation driven corporations are when the city hosted almost 3,000 congresses and corporate events. accommodated there. Vienna has significant banking, insurance and ADR 89.8 93.8 94.4 Example, the city hosted La Donna Fair for Women (30,000 participants) in manufacturing sectors. Vienna is a cultural centre and host to extensive 2011. In 2012 Vienna hosts the World Barista Championship (12,000 RevPAR 65.1 69.2 70.6 international trade and cultural events and had 3.4 million international participants) and The European Congress of Radiology (20,000 % growth on previous year tourist arrivals in 2010. participants). Occupancy (%) 11.2% 1.7% 1.4% Historical trading Economic outlook ADR -3.5% 4.5% 0.6% The number of overnight stays in Vienna has grown by 40% since 2000. Vienna is Austria’s most important economic centre, generating RevPAR 7.3% 6.3% 2.1% Occupancy rates reached almost 73% in 2010, an increase of 11.2% over 2009, approximately 28% of the nation’s GDP and employing about a quarter of according to data from STR Global. ADR was about €90 in 2010, the third year the nation’s workforce. In local currency (Euros) Source: Econometric forecast: PwC 2011 of decline since 2007 peaks. RevPAR grew by 7.3%, to reach €65, well below Austria’s GDP grew by 3.7% year on year in the second quarter of 2011, Benchmarking data: STR Global 2011 the 2008 peak of €80.* only slightly lower than in the first quarter (4.2%). The economy has been A= Actual F=Forecast less affected than other economies by the current crisis, but a slowdown is Supply trends still expected in the second half of 2011 and into 2012. There are approximately 370 hotels and 29,000 rooms in the city, according to data from STR Global. We estimate around 77% of hotels fall into the class of Sofitel Vienna Stephansdom 3- and 4-star. STR Global estimate a further 15 hotels and almost 3,000 rooms could be in the pipeline. Therefore almost 75% of the new rooms are expected to open in 2012. Hotel forecast • Moderate occupancy growth in 2011 takes occupancy to just over 74%. • By 2012 new supply means slightly less growth. • ADR is expected to see some recovery in 2011 to almost €94 but, remains some way below past highs. We anticipate marginal growth in 2012, taking rates to €94.4. “The meetings industry accounted for over • RevPAR sees 2.1% growth in 2012, taking it to almost €71, slightly 12% of bed nights in Vienna in 2010” below the annual average since 2000. *Predominantly 3-5 star hotels PwC Best placed to grow 41
  • 42.
    European cities forecast Zurich Role Opportunities and issues Annual hotel statistics Zurich, Switzerland’s largest city, is an international financial, economical and The large number of new rooms in the greater city area over the next 2010A 2011F 2012F educational centre and gateway to many of Switzerland’s mountain five years means Zurich will become a more competitive market for Occupancy (%) 72.7 73.8 74.7 destinations. Traditionally the home to numerous corporate headquarters, participants and there is a real danger of oversupply, especially in the financial institutions and educational institutions it has also evolved to a top ADR 240.4 243.5 244.3 eventuality of a prolonged period of worldwide economic crisis. Some city destination for leisure travellers. Zurich/Basel is one of the largest global weaker, older operators might find it difficult to compete with the new RevPAR 174.8 180.4 182.5 pharmaceutical clusters. arrivals, many of which are supported by a strong brand. % growth on previous year Historical trading The continued strength of the Swiss Franc has already started to negatively Occupancy (%) 6.4% 1.9% 0.8% Zurich’s recent trading has been relatively unscathed by the worldwide affect Swiss tourism destinations and a prolonged period of a weak Euro, ADR 2.4% 1.3% 0.3% economic crisis, although hotels saw some steep declines in 2009. The market combined with further slower European economic growth is expected to have a negative effect on the Zurich market. RevPAR 9.0% 3.2% 1.2% has increased by 650 rooms since 2008 and many of the existing properties have completed substantial refurbishment and capex projects. Zurich remains In local currency (Swiss Francs) Economic outlook Source: Econometric forecast: PwC 2011 one of the most expensive European cities in regards to room rates. 2010 in Benchmarking data: STR Global 2011 The key sector of the Zurich economy is financial services, which accounts particular was a solid year for the market, with increases in occupancy and A= Actual F=Forecast for more than 20% of employees and much of the economic activity in the RevPAR and near stable ADR, as the Swiss economy in general and the Zurich city. However, the economic outlook remains uncertain, on account of economic region continued to increase its importance as an international continued struggles in the finance sector, weakening growth in the financial hub and increased business and leisure arrivals. Eurozone and the sharp appreciation of the Swiss Franc. Supply trends Zurich is Switzerland’s largest tourism destination, with a current rooms supply of 7,300 rooms, including 36 4-star and 12 5-star properties. Current developments are expected to add approximately 2,200 rooms over the next five years, centred mainly around the airport, the football stadium and the industrial conversion areas at Zurich West and Zurich Enge. Hotel forecast • Overall we expect steady but unspectacular ADR and occupancy growth in 2011. • By 2012 occupancy should reach 74.7%. • ADR sees marginal growth next year taking rates to Swiss Franc “A hotel room in Zurich remains one of 244.3 - some way below 2007 peaks. the most expensive in Europe.” • In 2012, RevPAR creeps up to Swiss Franc 182.5, a 1.2% increase over 2011. 42 European cities hotel forecast PwC
  • 43.
    Appendix Methodology for hotelforecasts PwC Best placed to grow 43
  • 44.
    Methodology for hotelforecasts This section outlines in more detail the PwC model used to breakdown between domestic and different international The final type of data we used was the growth in the supply of forecast hotel occupancy, average daily rate (ADR) and visitors in each city. For other macro-economic variables such new rooms from 2000 to 2011, sourced from STR Global. revenue per available room (RevPAR). as interest rates and exchange rates, we used the relevant national levels. Final specifications Econometric model The model also incorporates some dummies as explanatory The final specifications for the city models were chosen The econometric models used were similar to the PwC UK variables. We included quarterly dummies to control for the according to which explanatory variables exerted a statistically Hotels Forecasts models, based on a Vector Autoregression strong seasonality of the data. Terrorism dummies were significant influence on the dependent variables. This means (VAR) framework. Each city has an independently-estimated included to account for the effects of 9/11 and specific terrorist different explanatory variables were included in each model, VAR model. This type of model was chosen because it allows attacks such as those in Istanbul, Madrid, Moscow and London as well as varying lag lengths. The table below provides an for interaction between occupancy and average room rates, as bombings over the decade. Dummy variables were also overview of the dependent and explanatory variables used in we observe in the market. Each VAR uses occupancy rate included for the impact of the recent “Arab Spring”. final specifications of the models. growth and real ADR growth as dependent variables, while the explanatory variables include lags of the dependant variables and a set of macroeconomic explanatory variables. Variables and data sources used in the model Data Variable Data source The dependent variables were based on data from STR Global Dependent variables Occupancy % STR Global for the period January 2000 – June 2011, containing monthly ADR STR Global information on occupancy, ADR and Revenue Per Available Room (RevPAR). We averaged these data to create a Explanatory variables GDP Eurostat, Turkstat quarterly series. Exchange rates Thomson Reuters, Datastream Unemployment Eurostat, Turkstat For the explanatory variables, we used: Investment Eurostat • a range of macroeconomic data, Consumer expenditure Eurostat • dummy variables based on historical events, and, Domestic interest rate National central banks • data on the supply of rooms. Hotel room supply STR Global The macroeconomic data covered both the relevant domestic markets, and relevant international markets (e.g. United States) where statistically significant. For example, GDP and household consumption data was based on a weighted average across a range of countries. The weighting used reflected the 44 European cities hotel forecast PwC
  • 45.
    The adjacent tableprovides details of the different economic Important economic drivers drivers which had a relationship with the hotels markets in these cities (along with the lag period in number of quarters in Exchange US Domestic Consumer Supply of parentheses). As can be seen, optimal lag lengths varied GDP rates Unemployment unemployment investment expenditure Interest rate rooms between zero and three quarters, with a one-quarter lag, or no Amsterdam ü (1) ü (1) ü (1) ü lag, being typical. Barcelona ü (1) ü (1) ü Market projections Belfast ü (1) ü Berlin ü (1) ü (1) ü We used the model to generate projections for ADR and occupancy in each city through to Q4 2012. Projections for the Dublin ü (1) ü (1) ü ü explanatory variables were from two sources: Edinburgh ü (2) 1. Macroeconomic variables were drawn from PwC in-house Frankfurt ü (1) ü forecasts Geneva ü (1) ü(3) Istanbul ü ü ü (1) 2. Supply of rooms forecasts were based on PwC analysis of STR Global data London ü ü (1) ü Madrid ü ü Moscow ü ü (1) ü (2) Paris ü (1) ü Rome ü (2) ü (1)* ü Stockholm ü (1) ü ü Vienna ü (1) ü ü Zurich ü (1) ü ü ü (2) PwC Best placed to grow 45
  • 46.
    46 European citieshotel forecast PwC
  • 47.
    Contacts Austria France Germany Wolfgang Vejdovsky Anne-Claire Ferrie Dirk Hennig Markus Hauk Director Partner Partner Manager +43 1 501 88 1150 +33 1 56 57 12 42 +49 30 2636-1166 +49 69 9585 5910 wolfgang.vejdovsky@at. anne-claire.ferrie@fr. dirk.hennig@de.pwc.com markus.hauk@de. pwc.com pwc.com pwc.com Ireland Italy Netherlands Russia Ann O’Connell Jennifer Gillen Nicola Anzivino Caterina Moliterno Bart Kruijssen Robert Gruman Oleg Malyshev Partner Senior Manager Partner Manager Partner Partner Partner, +353 (0)1 792 8512 +353 (0)1 792 8856 +39 348 8519842 +39 (0)2 80646378 +31 88 792 6037 +7 495 232 5725 +7 495 967 6138 ann.oconnell@ie.pwc. jennifer.gillen@ie. nicola a anzivino@it. caterina.moliterno@it. bart.kruijssen@nl. robert.gruman@ru. oleg.malyshev@ru. com pwc.com pwc.com pwc.com pwc.com pwc.com pwc.com Spain Sweden Switzerland Turkey Stefan Mundorf Carola Näsdal Skarp Madeleine Hansson Nicolas Mayer Adnan Akan Bilgütay Yasar Engin Alioglu Partner Consultant Director Director Partner Partner Partner +34 915 685 202 +46 (0)250 289 12 +46 (0)40 6412822 +41 58 792 2191 +90 212 326 6260 +90 212 326 6414 +90 212 376 53 06 stefan.mundorf@es.pwc. carola.naesdal.skarp@ madeleine.hansson@se. nicolas.mayer@ch. adnan.akan@tr.pwc.com bilgutay.yasar@tr. engin.alioglu@tr.pwc.com com se.pwc.com pwc.com pwc.com pwc.com United Kingdom Robert Milburn Liz Hall Stephen Broome Yael Selfin Richard Snook Northern Ireland Scotland Hospitality & Leisure Head of Hospitality & Hotels Specialist Head of Economist Stephen Curragh Bruce Cartwright Leader Leisure Research +44 (0)20 7212 8510 Macro Consulting +44 (0)20 7212 1195 Partner Partner +44 (0)20 7212 4784 +44 (0)20 7213 4995 stephen.broome@uk. +44 (0)20 7804 7630 richard.snook@uk. +44 (0)8 9041 5495 +44 (0)131 260 4087 robert.j.milburn@uk.pwc. liz.hall@uk.pwc.com pwc.com yael.selfin@uk.pwc.com pwc.com stephen.curragh@uk. bruce.cartwright@uk. com pwc.com pwc.com PwC Best placed to grow 47
  • 48.
    www.pwc.com/hospitality This publication hasbeen prepared for general guidance on matters of interest only, and does not constitute professional advice. You should not act upon the information contained in this publication without obtaining specific professional advice. No representation or warranty (express or implied) is given as to the accuracy or completeness of the information contained in this publication, and, to the extent permitted by law, PricewaterhouseCoopers does not accept or assume any liability, responsibility or duty of care for any consequences of you or anyone else acting, or refraining to act, in reliance on the information contained in this publication or for any decision based on it. © 2011 PwC. All rights reserved. Not for further distribution without the permission of PwC. “PwC” refers to the network of member firms of PricewaterhouseCoopers International Limited (PwCIL), or, as the context requires, individual member firms of the PwC network. Each member firm is a separate legal entity and does not act as agent of PwCIL or any other member firm. PwCIL does not provide any services to clients. PwCIL is not responsible or liable for the acts or omissions of any of its member firms nor can it control the exercise of their professional judgment or bind them in any way. No member firm is responsible or liable for the acts or omissions of any other member firm nor can it control the exercise of another member firm’s professional judgment or bind another member firm or PwCIL in any way. EP6-2011-07-22-1811-AC