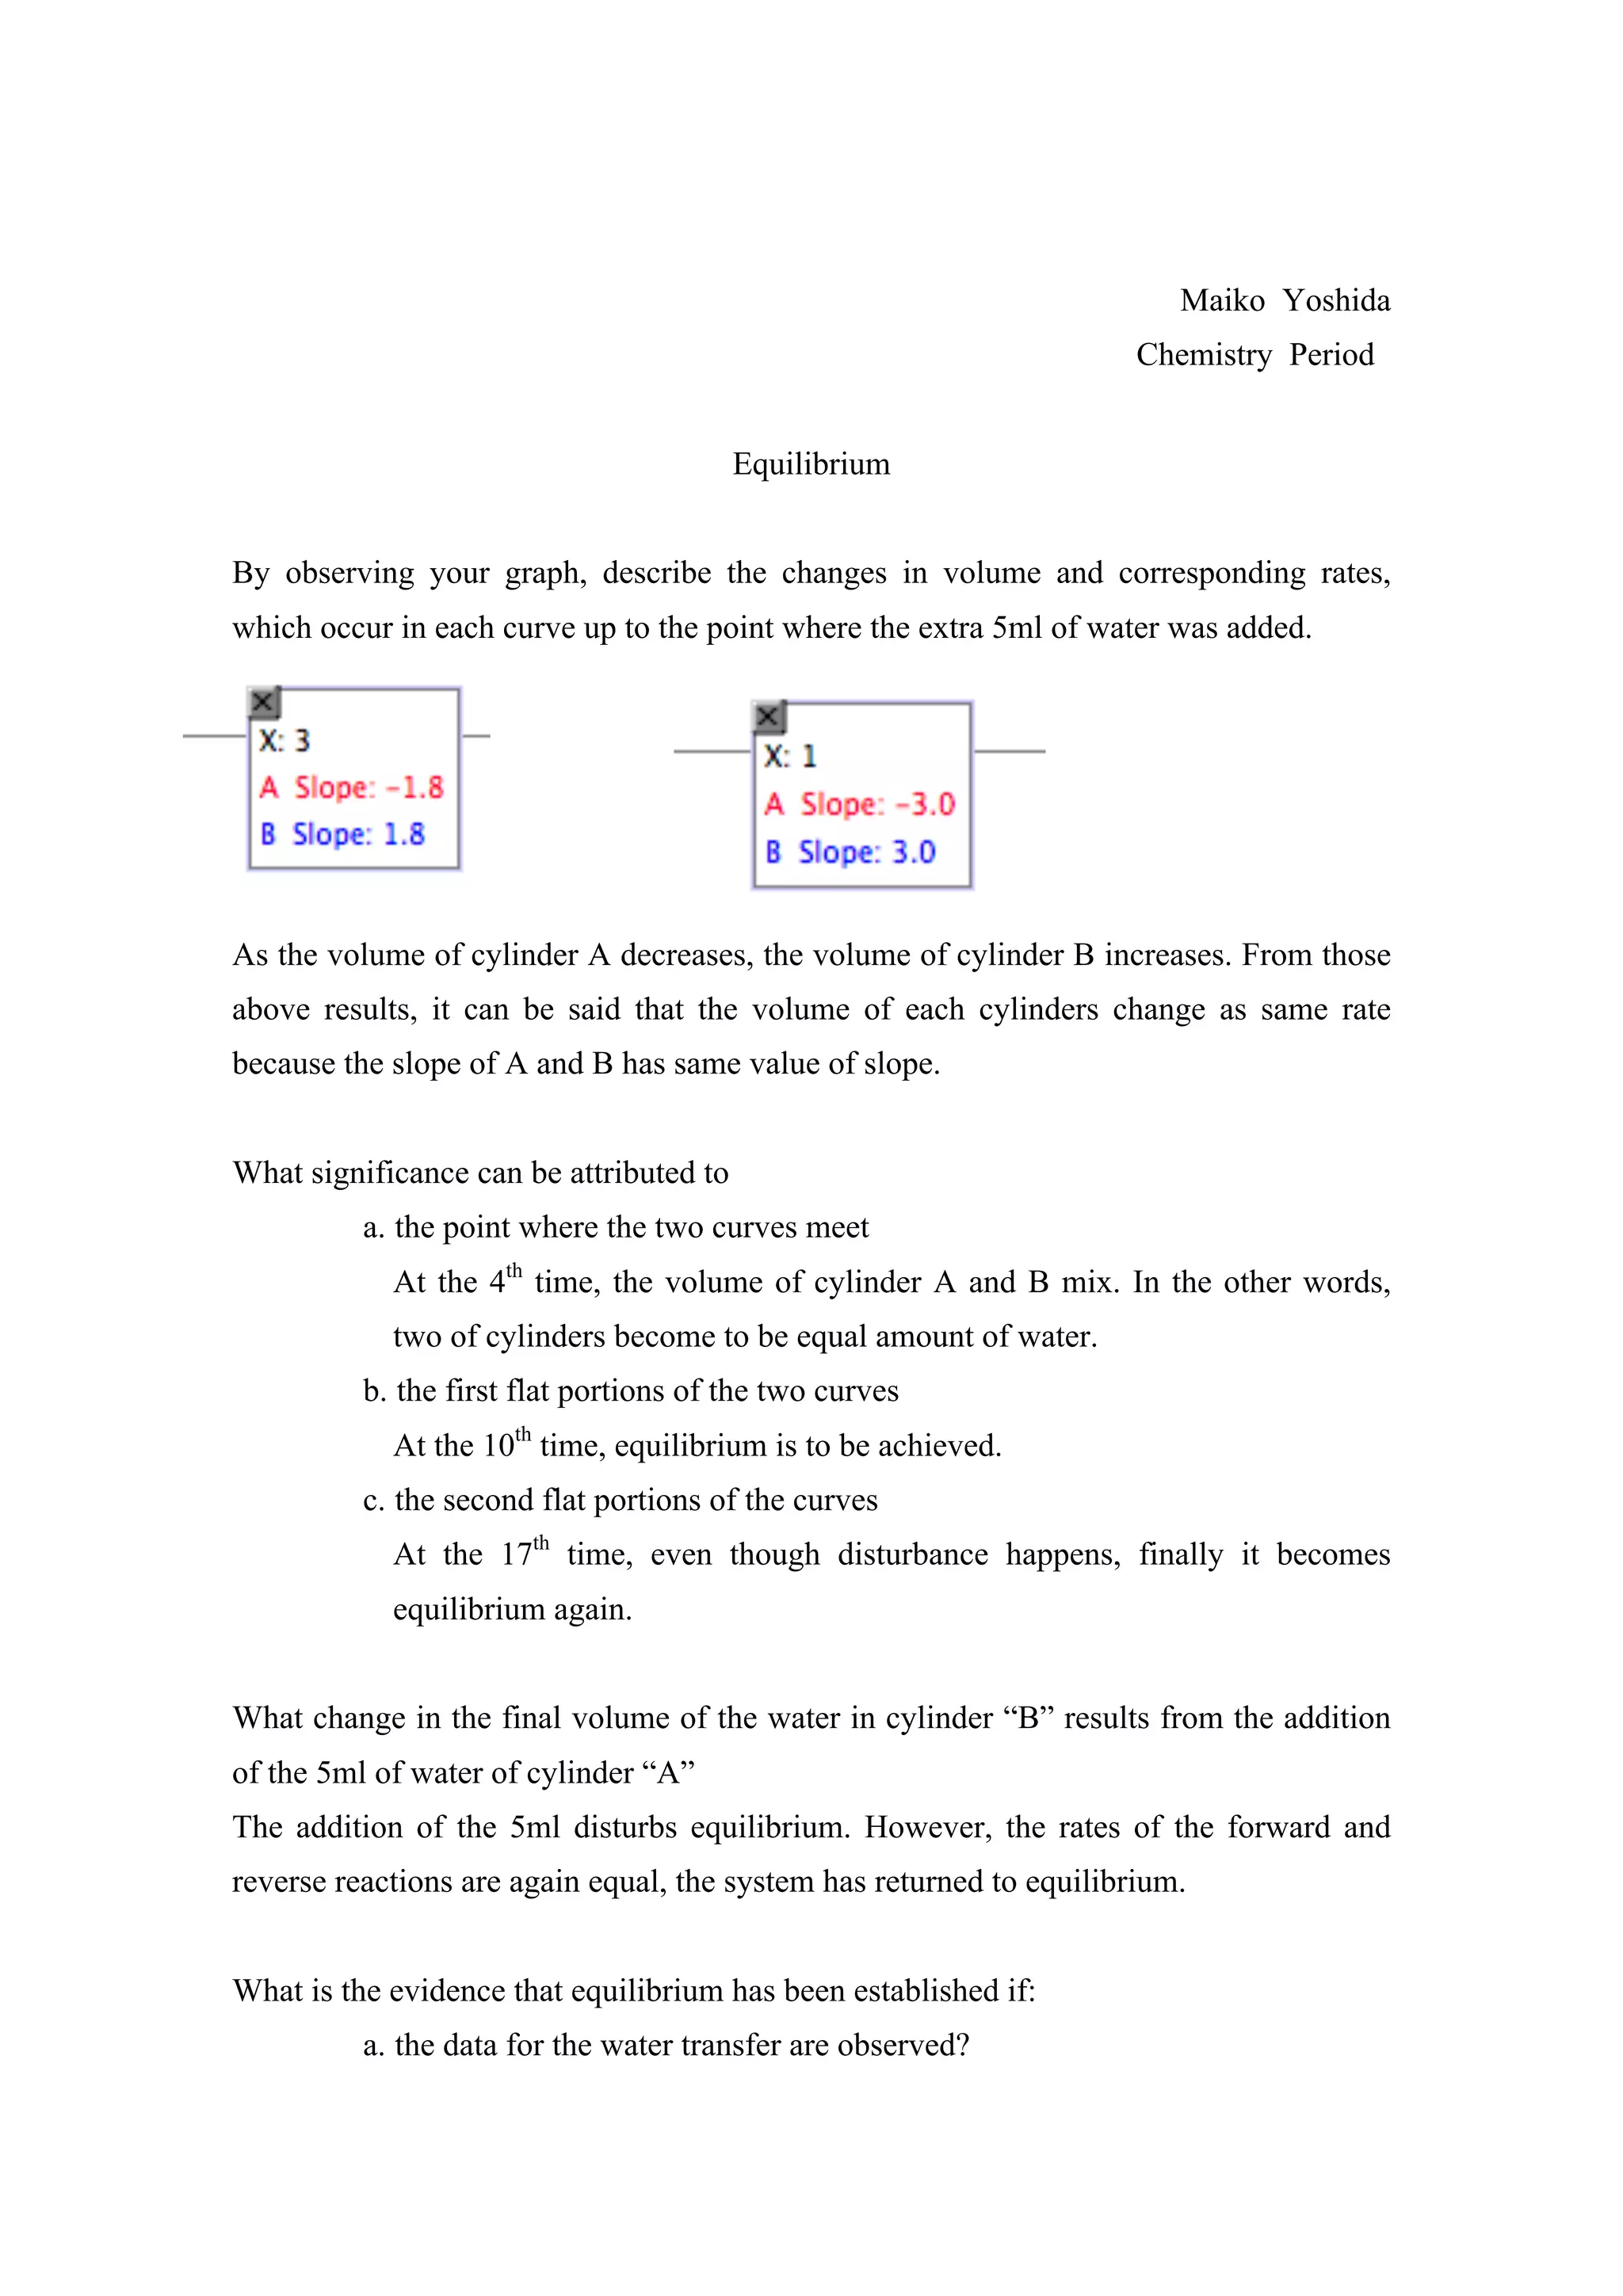
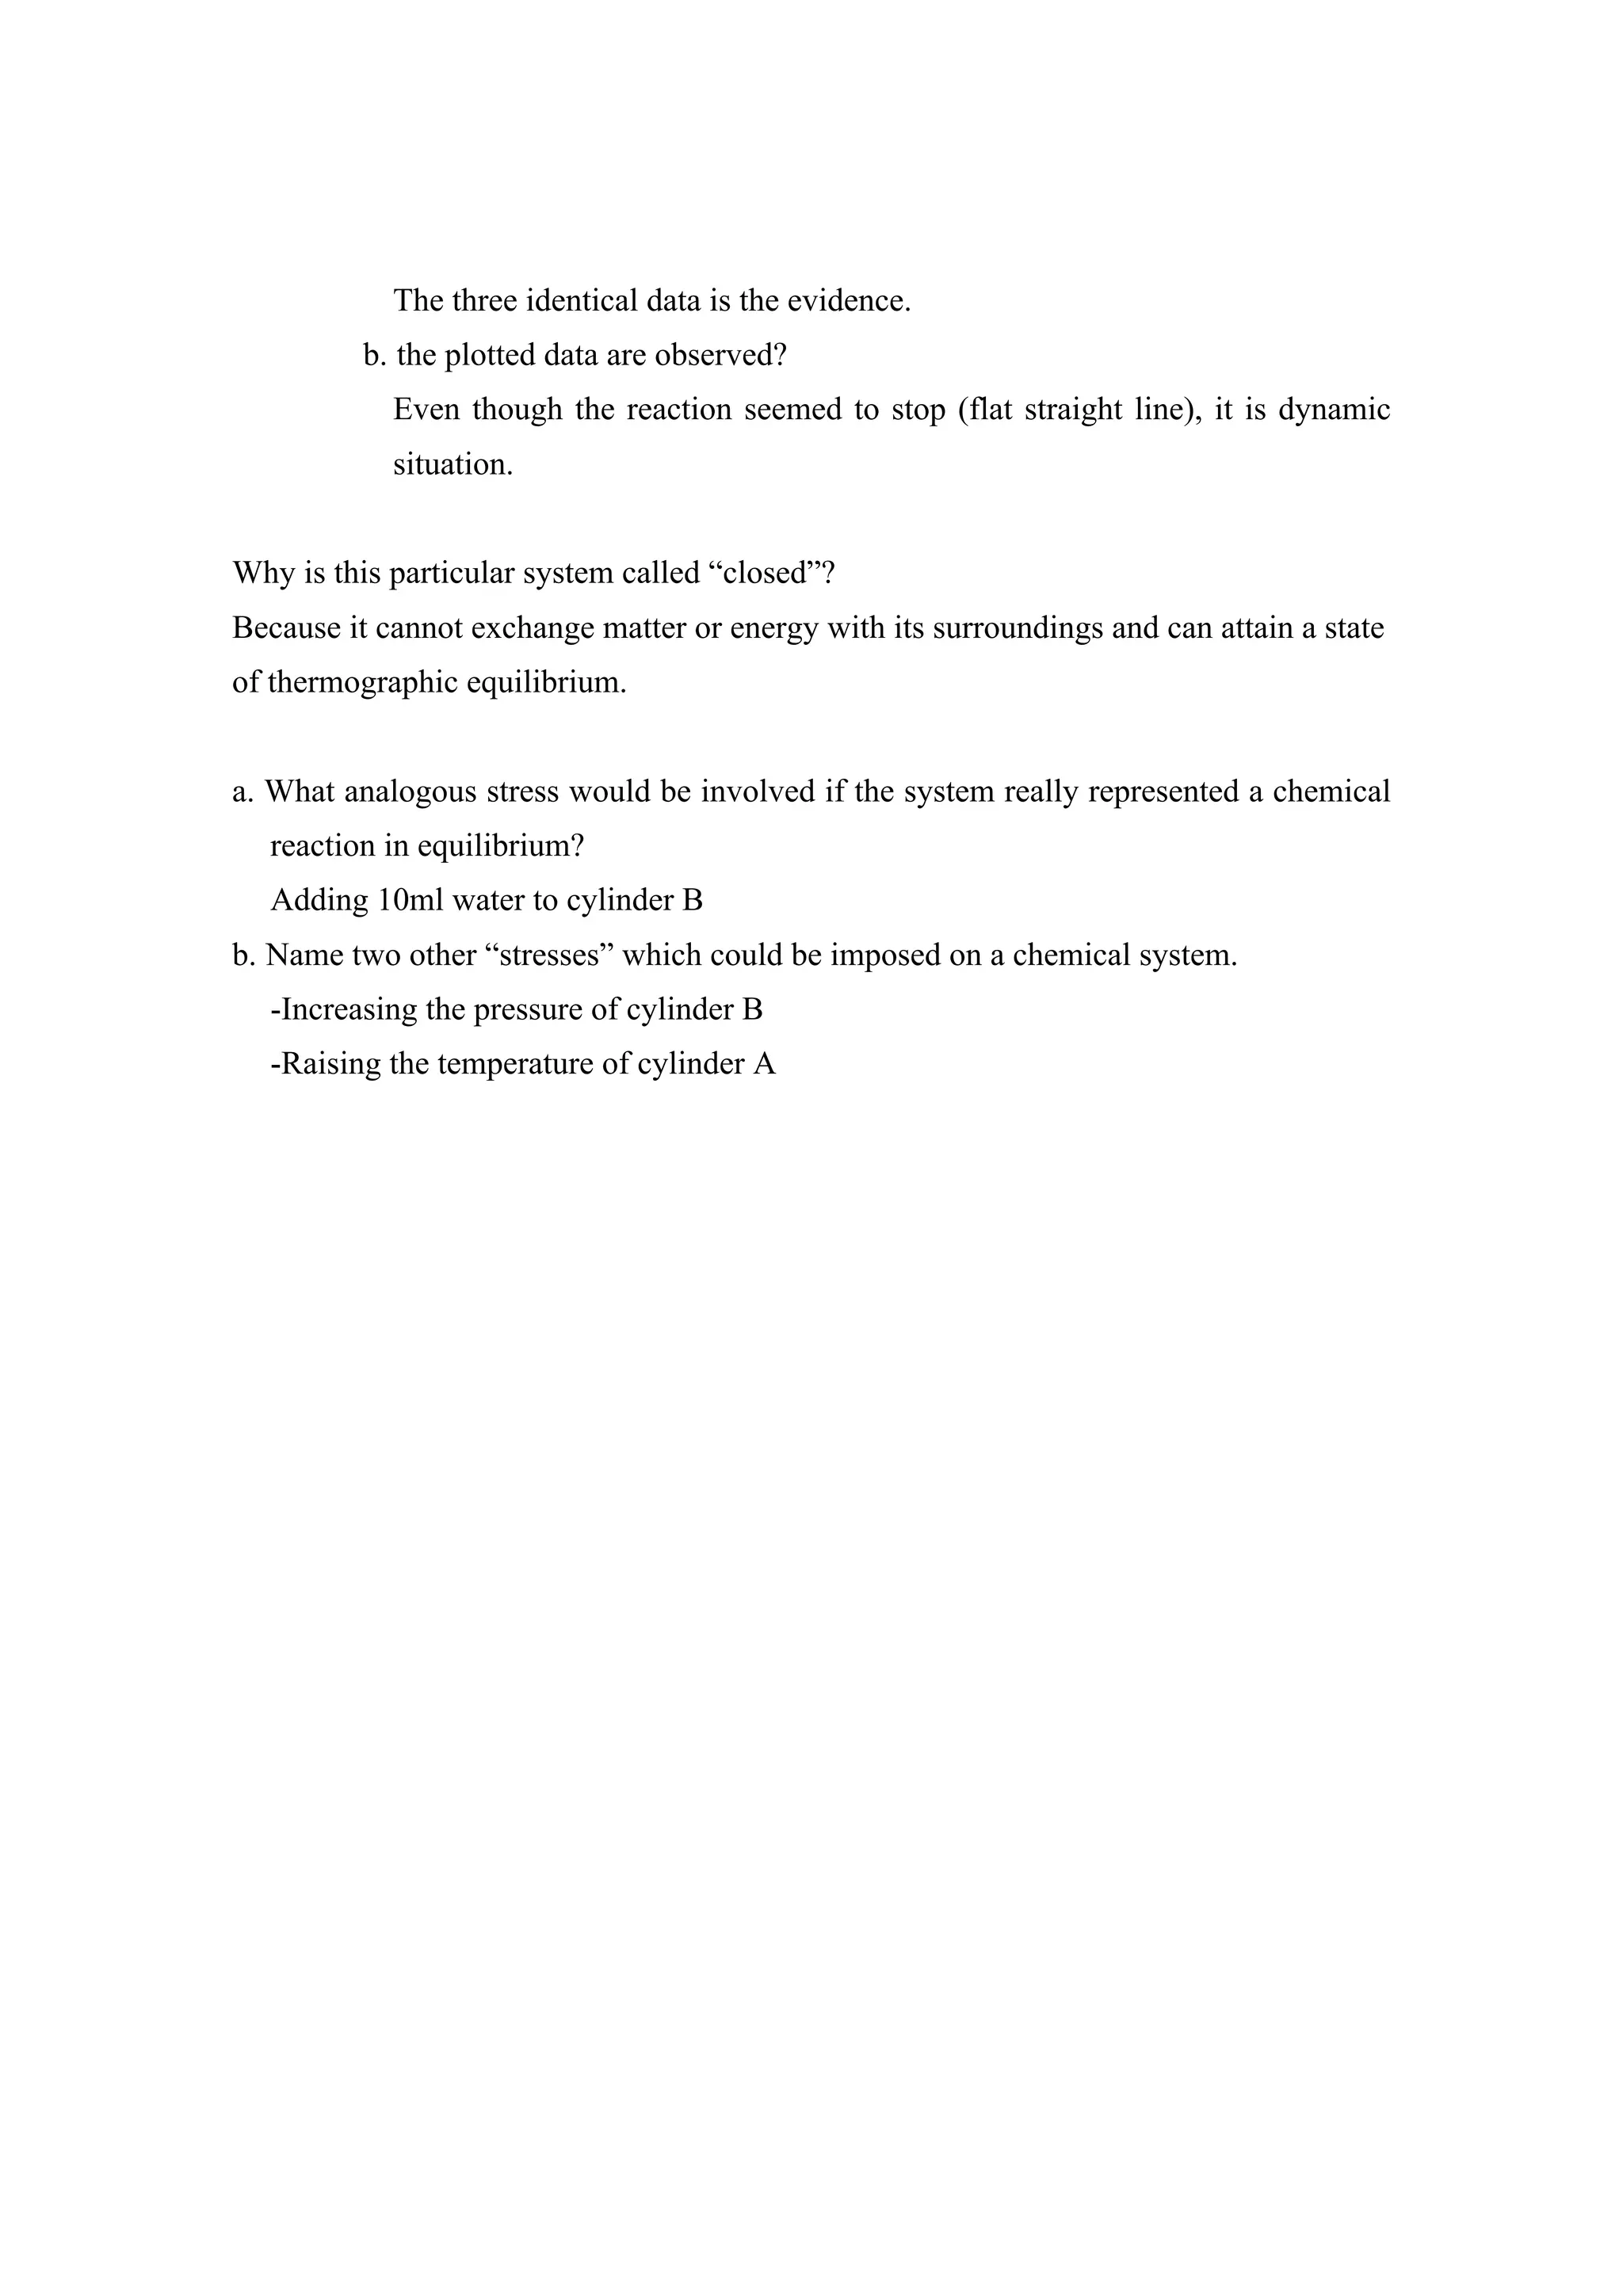
Maiko Yoshida
                                                                      Chemistry Period


                                         Equilibrium


By observing your graph, describe the changes in volume and corresponding rates,
which occur in each curve up to the point where the extra 5ml of water was added.


As the volume of cylinder A decreases, the volume of cylinder B increases. From those
above results, it can be said that the volume of each cylinders change as same rate
because the slope of A and B has same value of slope.


What significance can be attributed to
          a. the point where the two curves meet
            At the 4th time, the volume of cylinder A and B mix. In the other words,
            two of cylinders become to be equal amount of water.
          b. the first flat portions of the two curves
            At the 10th time, equilibrium is to be achieved.
          c. the second flat portions of the curves
            At the 17th time, even though disturbance happens, finally it becomes
            equilibrium again.


What change in the final volume of the water in cylinder “B” results from the addition
of the 5ml of water of cylinder “A”
The addition of the 5ml disturbs equilibrium. However, the rates of the forward and
reverse reactions are again equal, the system has returned to equilibrium.


What is the evidence that equilibrium has been established if:
          a. the data for the water transfer are observed?
The three identical data is the evidence.
         b. the plotted data are observed?
            Even though the reaction seemed to stop (flat straight line), it is dynamic
            situation.


Why is this particular system called “closed”?
Because it cannot exchange matter or energy with its surroundings and can attain a state
of thermographic equilibrium.


a. What analogous stress would be involved if the system really represented a chemical
  reaction in equilibrium?
  Adding 10ml water to cylinder B
b. Name two other “stresses” which could be imposed on a chemical system.
  -Increasing the pressure of cylinder B
  -Raising the temperature of cylinder A

Equilibrium lab

  • 1.
    Maiko Yoshida Chemistry Period Equilibrium By observing your graph, describe the changes in volume and corresponding rates, which occur in each curve up to the point where the extra 5ml of water was added. As the volume of cylinder A decreases, the volume of cylinder B increases. From those above results, it can be said that the volume of each cylinders change as same rate because the slope of A and B has same value of slope. What significance can be attributed to a. the point where the two curves meet At the 4th time, the volume of cylinder A and B mix. In the other words, two of cylinders become to be equal amount of water. b. the first flat portions of the two curves At the 10th time, equilibrium is to be achieved. c. the second flat portions of the curves At the 17th time, even though disturbance happens, finally it becomes equilibrium again. What change in the final volume of the water in cylinder “B” results from the addition of the 5ml of water of cylinder “A” The addition of the 5ml disturbs equilibrium. However, the rates of the forward and reverse reactions are again equal, the system has returned to equilibrium. What is the evidence that equilibrium has been established if: a. the data for the water transfer are observed?
  • 2.
    The three identicaldata is the evidence. b. the plotted data are observed? Even though the reaction seemed to stop (flat straight line), it is dynamic situation. Why is this particular system called “closed”? Because it cannot exchange matter or energy with its surroundings and can attain a state of thermographic equilibrium. a. What analogous stress would be involved if the system really represented a chemical reaction in equilibrium? Adding 10ml water to cylinder B b. Name two other “stresses” which could be imposed on a chemical system. -Increasing the pressure of cylinder B -Raising the temperature of cylinder A