Downloaded 22 times
![Data Analysis – Immigrant Key Founder Data
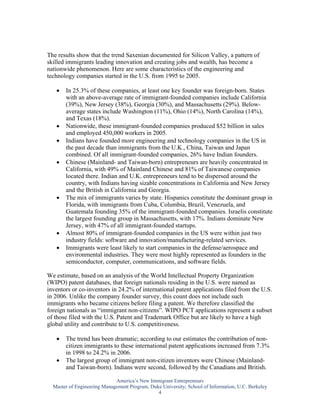
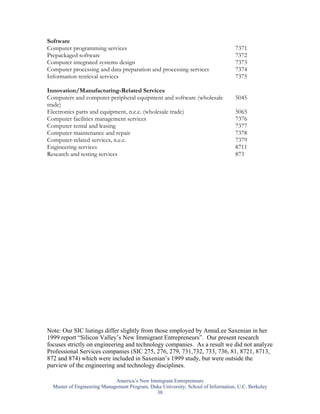
We obtained responses from 2,054 engineering and technology companies founded in the
U.S. from 1995 to 2005. Of these companies, 25.3% reported that at least one of their key
founders was an immigrant. Extrapolating from this sample, we estimate that all
companies founded by immigrants from 1995 to 2005 produced $52 billion dollars in
sales and employed 450,000 workers in 2005. A breakdown of our survey statistics and
response rates can be found in Table 1 below:
Table 1: Founder Survey Statistics and Response Rates
Count Variable
Total "Yes" Responses: 520 a
Total "No" Responses: 1534 b
"Decline to Comment/Participate" Responses: Too Busy, Unwilling to Provide 407 c
Information, No Data/Knowledge
"Missing Data": Bad Phone Numbers, Disconnected Calls, Hang Ups, Requests 2128 d
for Call Backs and Answering Machines
Total Companies Approached: 4589 e
Response Rate R1 (The proportion of survey responses obtained out of total 44.8%
survey delivery attempts) [(a+b)/e]
Response Rate R2 (The proportion of survey responses obtained out of total 83.5%
surveys actually delivered) [(a+b)/(a+b+c)]
Revenue and Employment Data
To infer information on all of the 28,776 companies founded in the last ten years, we
employed a sampling distribution of a proportion, and performed a finite population
correction. Using this method, we can say with 95% confidence that 25.3% ± 1.8% of
the 28,776 engineering and technology companies founded from 1995 to 2005 had an
immigrant key founder. This equates to 7,283 ± 518 companies. These 7,283 companies
produced more than $52 billion dollars in 2005 sales and in 2005 had just under 450,000
employees.
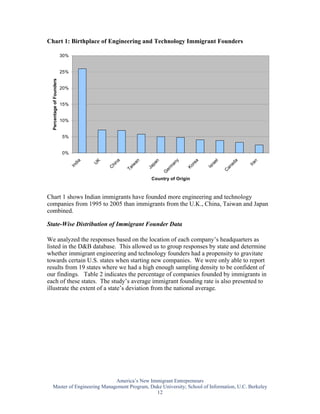
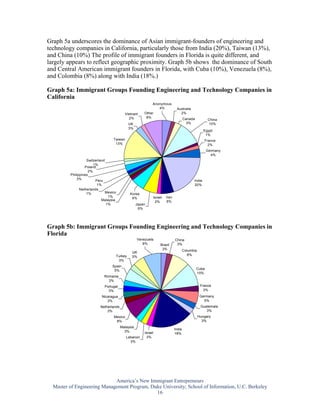
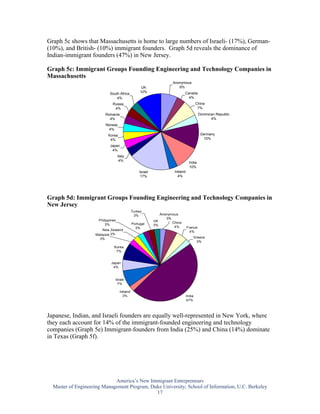
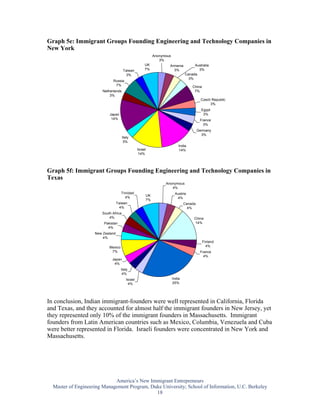
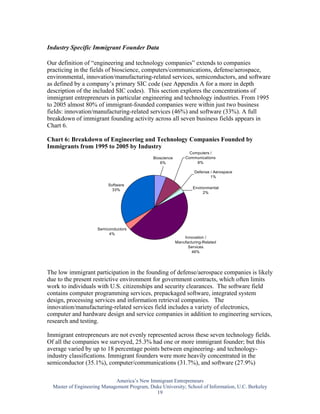
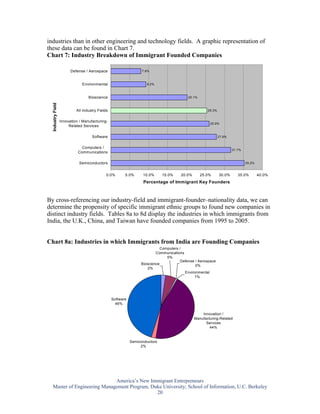
Immigrant-Founder Origin Data
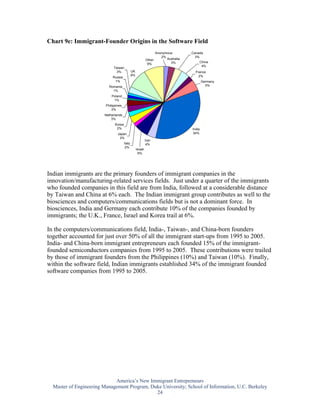
The immigrant founders of U.S. engineering and technology companies come from all
over the world. Our data identified immigrant founders from more than 60 different
countries. The top 10 are listed in Chart 1.
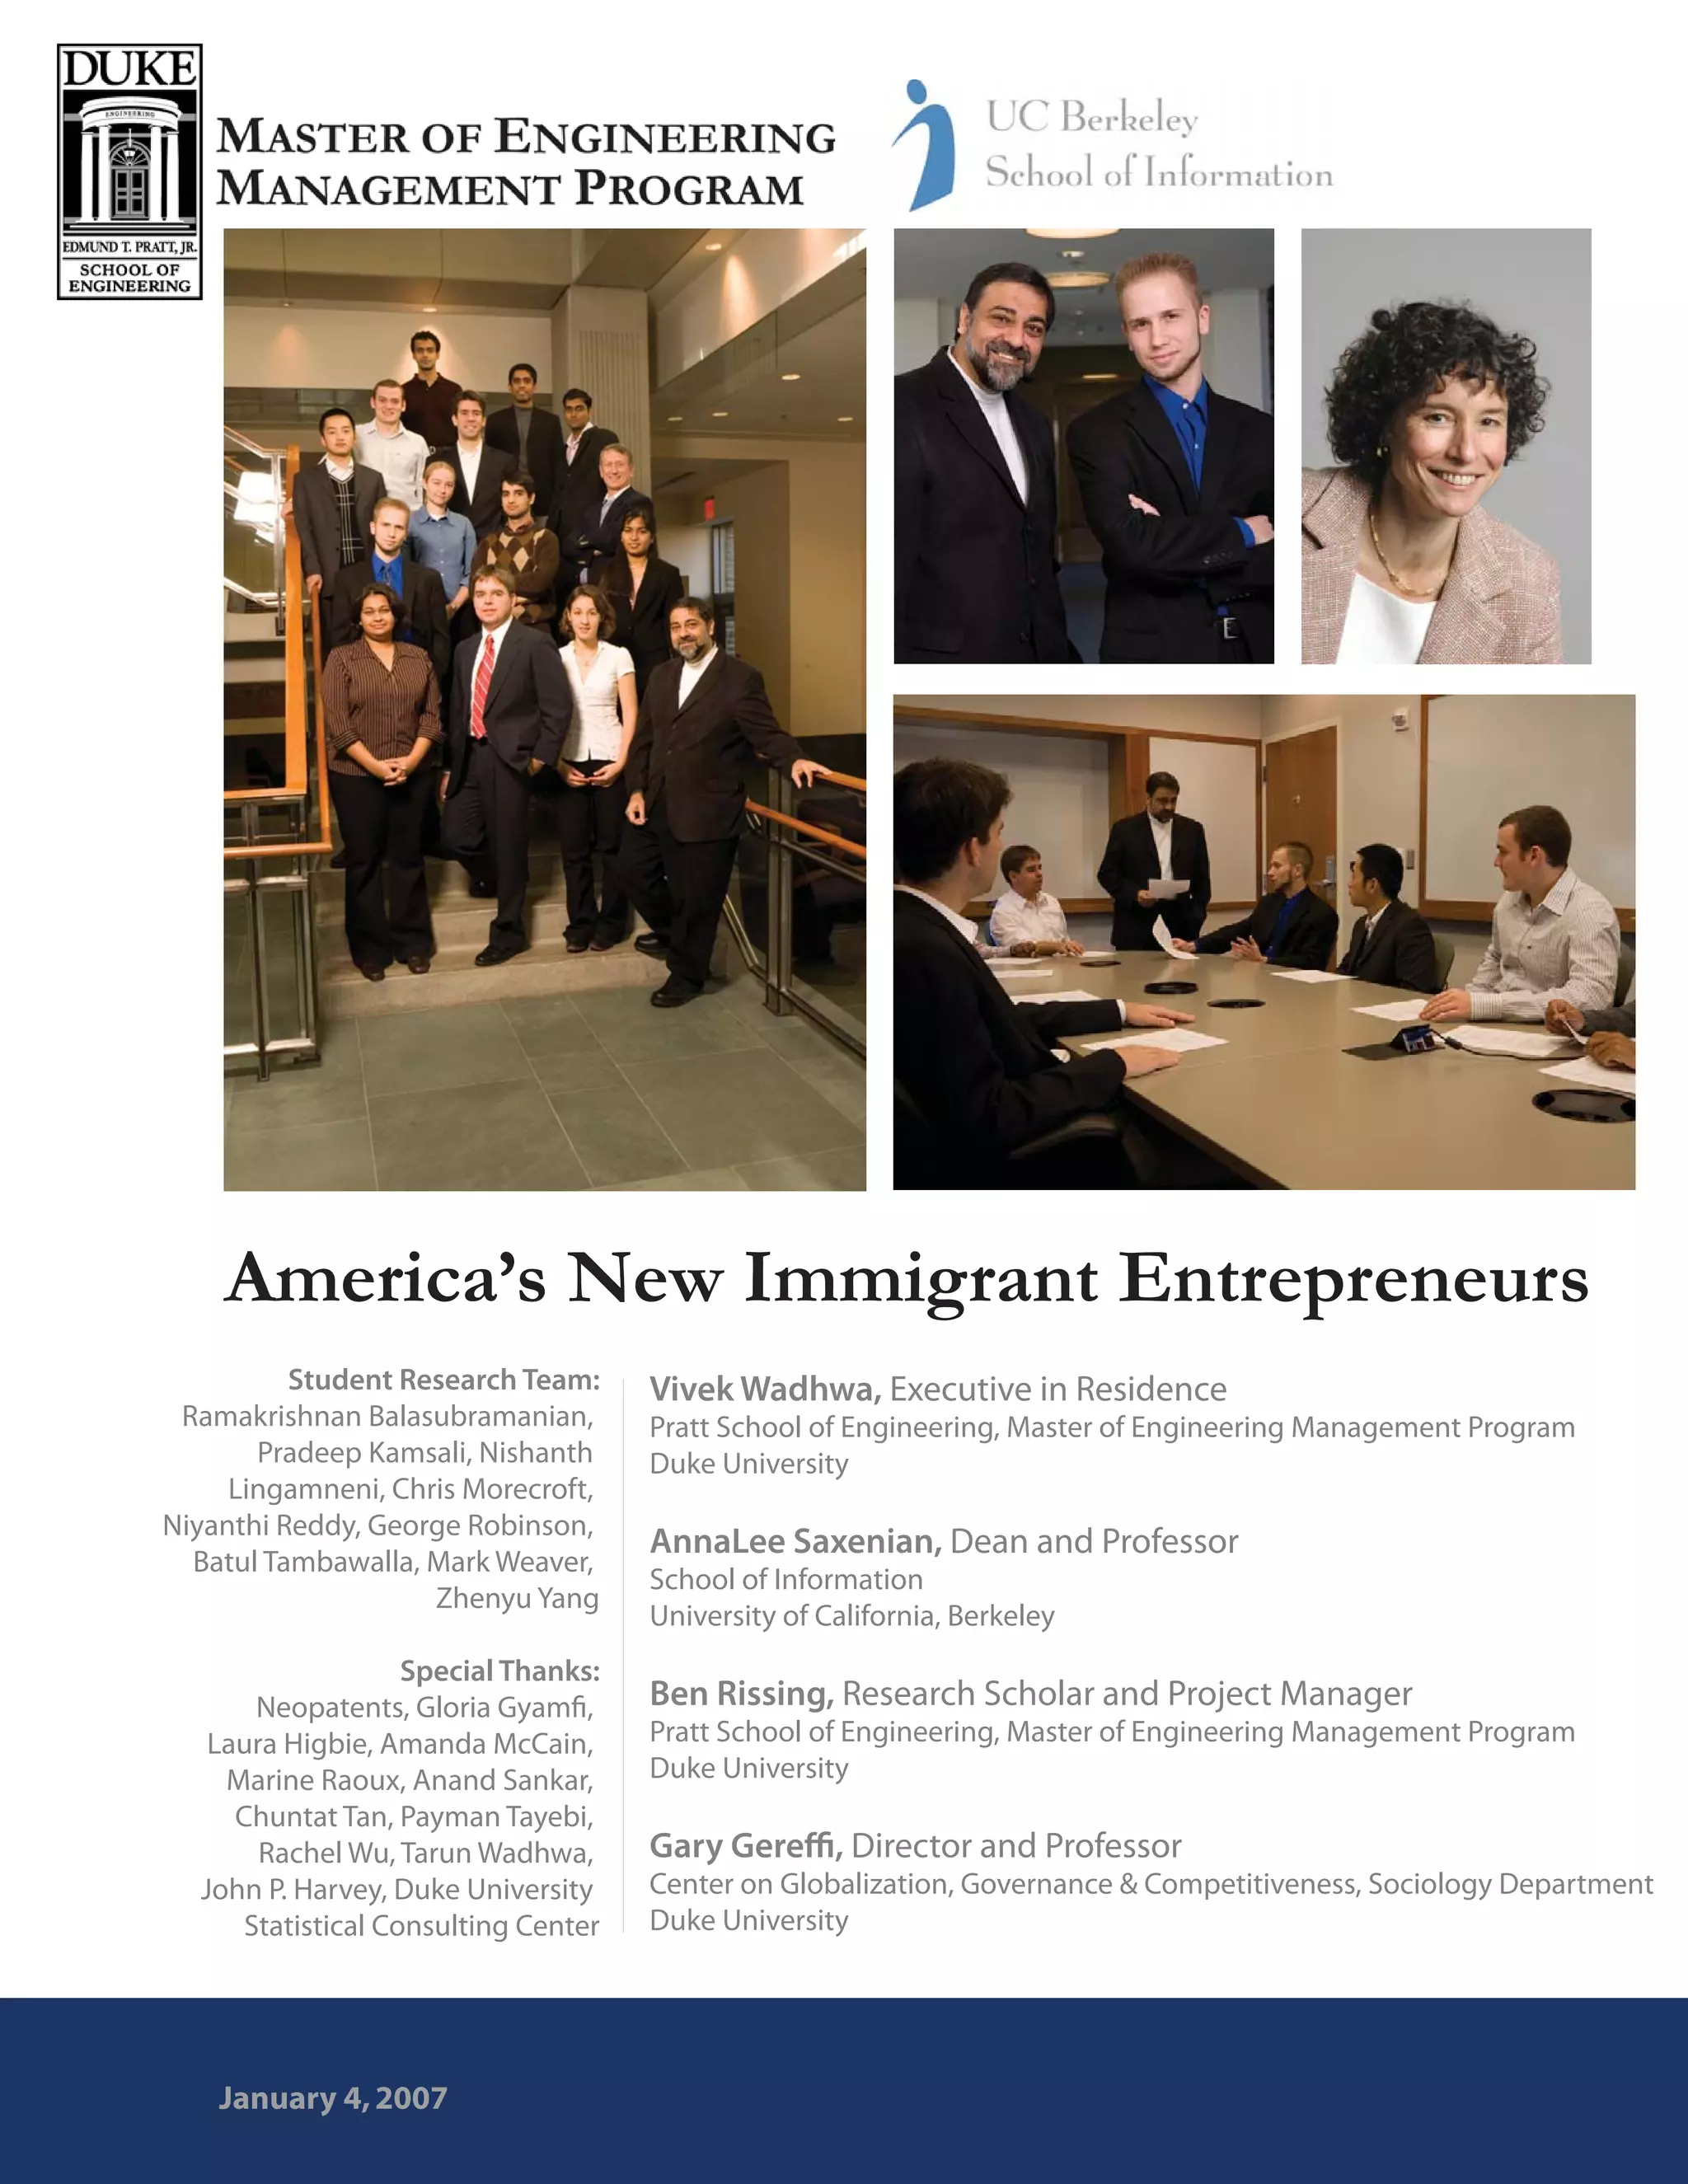
America’s New Immigrant Entrepreneurs
Master of Engineering Management Program, Duke University; School of Information, U.C. Berkeley
11](https://image.slidesharecdn.com/entrepimmigrants161207-110803160135-phpapp01/85/Entrepreneurs-immigrants-in-US-11-320.jpg)
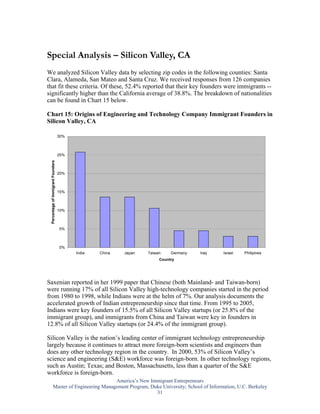
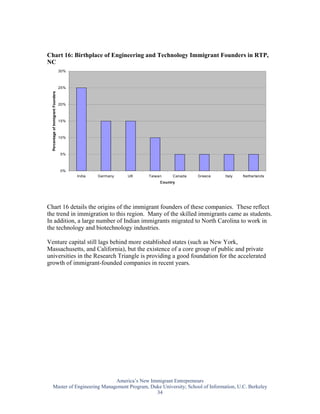
![Special Analysis – Research Triangle Park, NC
As our data showed, North Carolina has one the lowest percentages of immigrant-
founded engineering and technology companies (13.9% vs. a national average of 25.3%).
We believe this is for several reasons: its economic strengths for much of the past
century were in traditional manufacturing and agricultural products (textiles and apparel,
furniture, and tobacco); it has had very small venture capital markets; and until recently,
it had relatively low numbers of immigrants.
Research Triangle Park (RTP) has been a flourishing hub of high-technology activity in
the last few decades however, especially in the information technology (I.T.) and
biotechnology areas. While the initial companies that were associated with these two
sectors were large-scale enterprises (such as IBM and SAS in I.T., and big
pharmaceuticals in the biotechnology sector), in recent years there has been a spate of
new decentralized technologies connected with IT and biotechnology that have led to the
proliferation of entrepreneurial opportunities in RTP.
We wanted to determine if RTP had a higher concentration of immigrant entrepreneurs
than the rest of the state. Our random sample from the primary survey did not provide
enough data for this analysis. So we created an additional dataset from the D&B database
and conducted a new survey of this area.
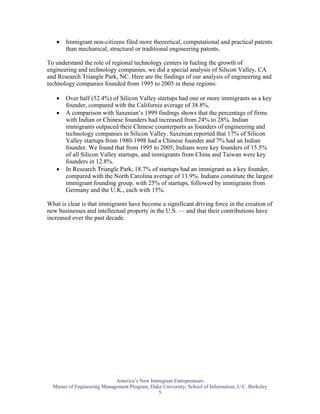
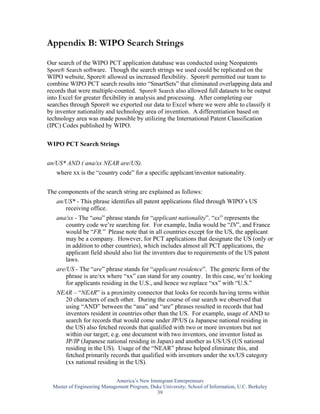
We received responses from 107 companies, and 18.7% of these reported that they had an
immigrant as a key founder. This compares to the state average of 13.9%.
A breakdown of our survey statistics and response rates can be found in Table 3 below.
Table 3: Founder Survey Statistics and Response Rates for RTP, NC
Count Variable
Total "Yes" Responses: 20 a
Total "No" Responses: 87 b
"Decline to Comment/Participate" Responses: Too Busy,
Unwilling to Provide Information, No Data/Knowledge 5 c
"Missing Random Data": Bad Phone Numbers, Disconnected
Calls, Hang Ups, Requests for Call Backs and Answering
Machines 66 d
Total Companies Approached: 178 e
Response Rate R1 (The number of survey responses
obtained out of total survey delivery attempts) [(a+b)/e] 60.1%
Response Rate R2 (The number of survey responses
obtained out of total surveys actually delivered)
[(a+b)/(a+b+c)] 95.5%
America’s New Immigrant Entrepreneurs
Master of Engineering Management Program, Duke University; School of Information, U.C. Berkeley
33](https://image.slidesharecdn.com/entrepimmigrants161207-110803160135-phpapp01/85/Entrepreneurs-immigrants-in-US-33-320.jpg)

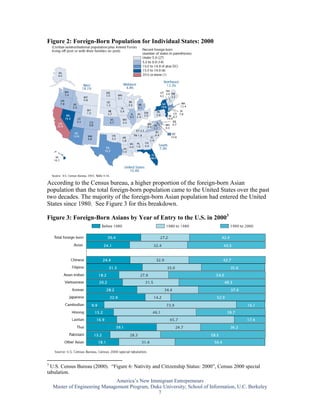
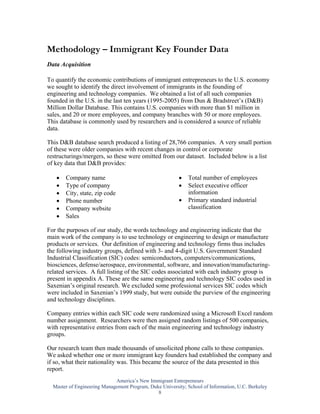
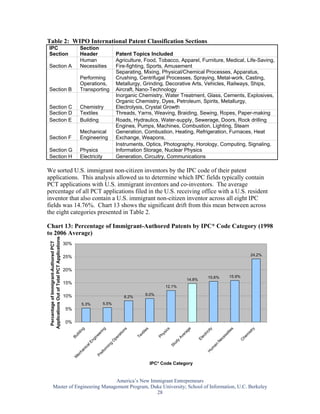
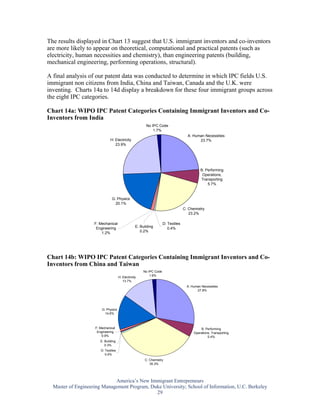
Immigrant entrepreneurs have founded a significant number of engineering and technology companies in the United States over the past decade. The study found that in 25.3% of engineering and technology companies started between 1995 and 2005, at least one key founder was foreign-born. These immigrant-founded companies have generated $52 billion in sales and employed over 450,000 workers in 2005. Indians have founded more engineering and technology companies than immigrants from any other country. The contribution of immigrant inventors to international patent applications filed from the United States has also increased dramatically, from 7.3% in 1998 to 24.2% in 2006. Regional technology hubs like Silicon Valley have even higher rates of immigrant entrepreneurship.