Download to read offline

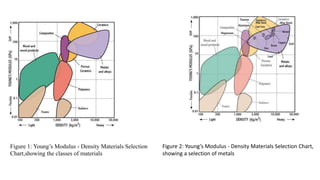
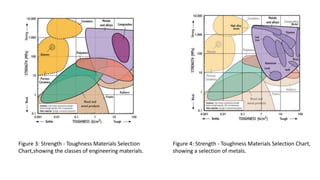
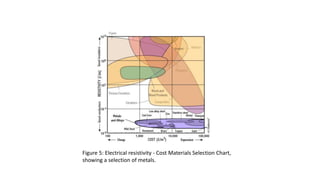
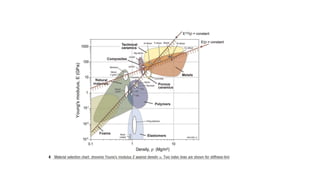
This document contains descriptions of 5 figures showing different materials selection charts. Figure 1 and 2 show Young's Modulus-Density charts comparing classes of materials and metals. Figure 3 and 4 show Strength-Toughness charts for engineering materials and metals. Figure 5 shows an Electrical Resistivity-Cost chart for various metals.


