Recommended

Recommended
More Related Content
What's hot
Viewers also liked
Viewers also liked (20)
More from Laura Chambless
More from Laura Chambless (20)
Recently uploaded
Recently uploaded (20)
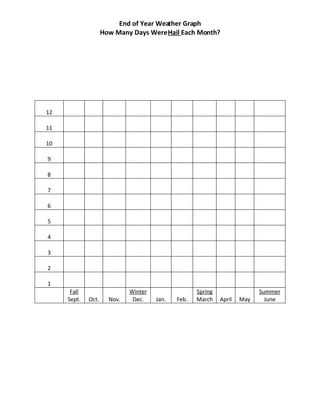
End Of The Year Weather Graph Hail
- 1. End of Year Weather Graph How Many Days Were Hail Each Month? 12 11 10 9 8 7 6 5 4 3 2 1 Fall Winter Spring Summer Sept. Oct. Nov. Dec. Jan. Feb. March April May June