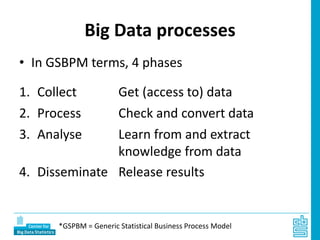
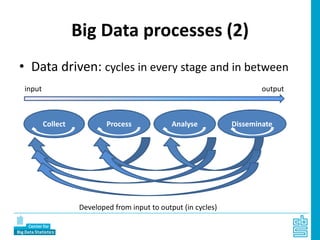
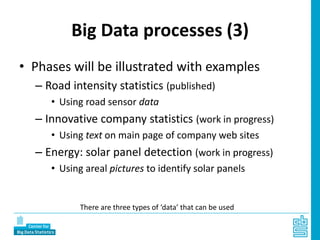
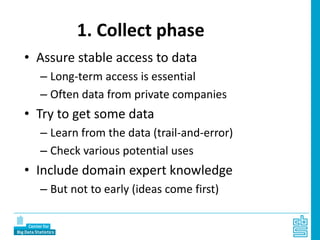
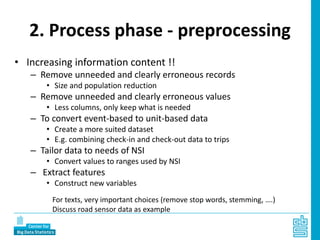
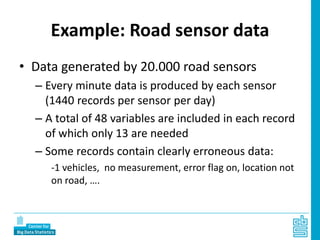
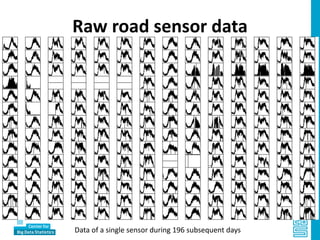
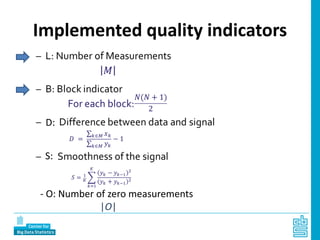
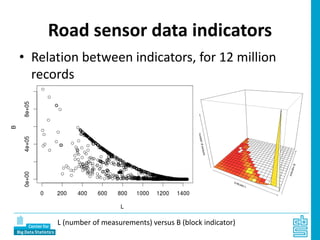
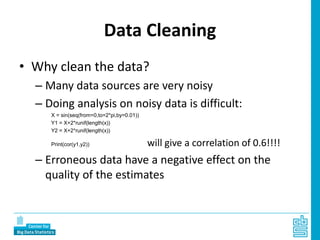
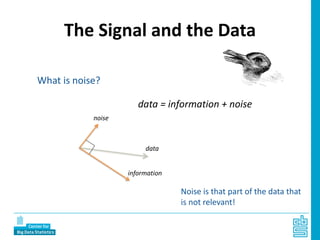
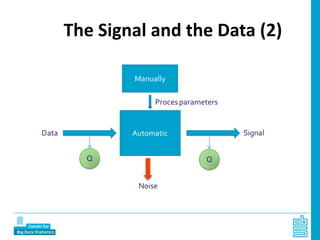
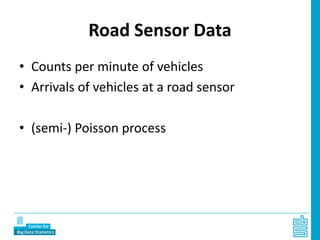
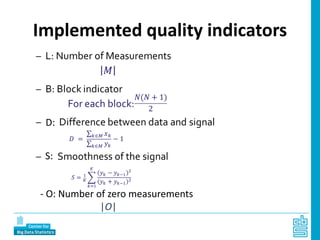
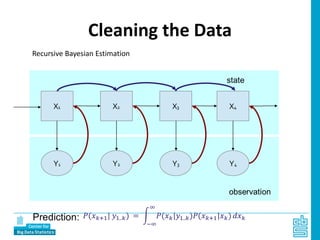
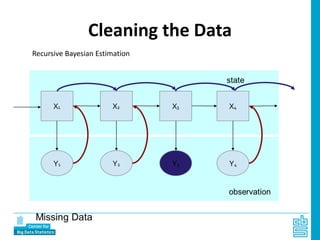
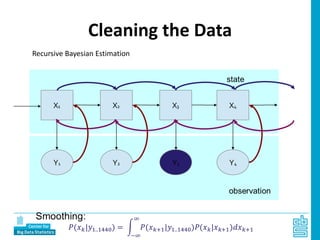
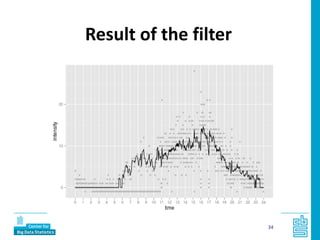
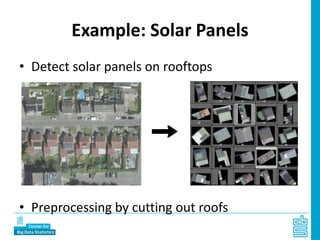
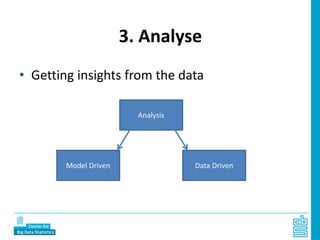
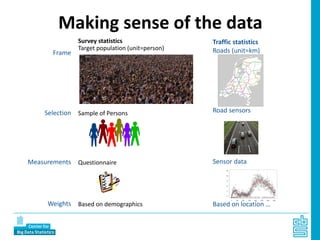
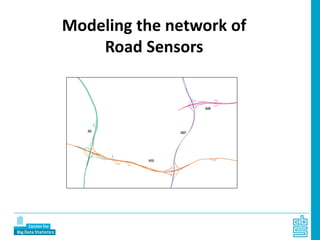
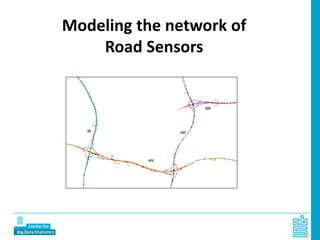
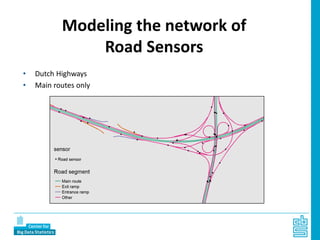
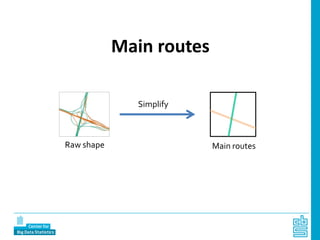
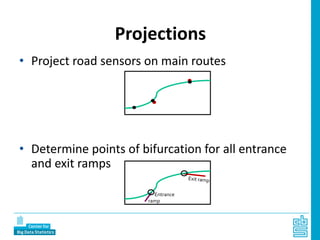
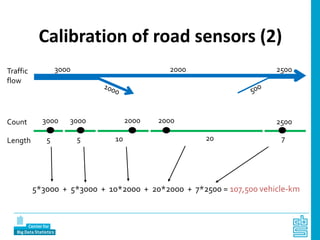
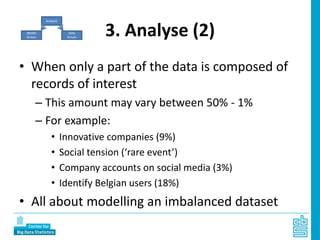
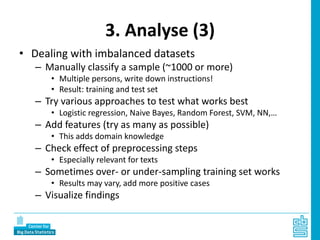
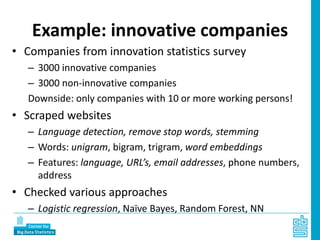
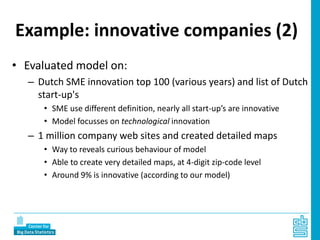
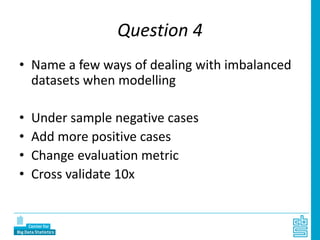
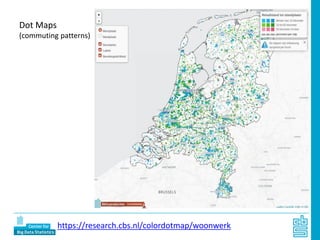
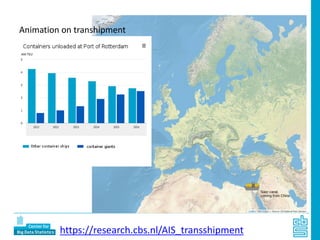
EMOS Webinar
Big Data Methods and Techniques
Piet Daas & Marco Puts
Statistics Netherlands
Center for Big Data Statistics
March 21, 2018 16:15 – 17:30
Piet Daas
• Work
– Senior methodologist CBS
– Lead Data Scientist CBDS
– Project leader Big Data research CBS
– Involved in ESSnet Big Data
• Trainer
– ESTP training course leader
– EMOS Big Data trainer Univ. Utrecht
– CBDS trainer
– For lot’s and lot’s of students
– And 2 dogs and 8 hamsters
@pietdaas
Marco Puts
• Work
– Methodologist CBS
– Lead Data Scientist CBDS
– Big Data Task Force member
– Involved in ESSnet Big Data
– Vegan
• Trainer
– ESTP training course leader
– CBDS trainer
– 4 tortoises
Overview of Webinar
• Properties of Big Data
• Big Data processes
– Collect
– Process
– Analyse
– Disseminate
• Wrap up & Discussion
• Questions in between topics
Big Data
• What is Big Data?
– How do we use this term?
• Big Data is a source of data that is:
– Rapidly available
– Usually available in large amounts
– Often generated by an unknown population
– May have poor quality metadata
– Usually has low information content
– Requires processing prior to use
– Unknown design
Big Data’s most important property
Information content can be rather low for Big Data
Paradigm shift
• Need of change in the way (official)
statisticians look at data
https://en.wikipedia.org/wiki/Rabbit%E2%80%93duck_illusion#/media/File:Kaninchen_und_Ente.png
Question 1
• What sources do you consider Big Data?
– Social media messages
– Product prices on web sites
– Satellite pictures
– Sensor data of cows
– Persons register of China
– Activity tracker data of 8 persons
Big Data uses
• Big Data was introduced in previous Webinars
• A number of examples have been shown
• Big Data: how can it be used?! (not only its
potential)
• General view on Big Data processes
Big Data processes
• In GSBPM terms, 4 phases
1. Collect Get (access to) data
2. Process Check and convert data
3. Analyse Learn from and extract
knowledge from data
4. Disseminate Release results
In this Webinar, we discuss Big Data as the main source of input for official statistics
Alternatives uses are: as an additional source, to impute missing data and in model.
*GSPBM = Generic Statistical Business Process Model
In this Webinar
• Focus is Big Data as the main source of input
for official statistics
• Alternative uses are:
– as an additional source,
– to impute missing data,
– in a calibration model.
Big Data processes (2)
• Data driven: cycles in every stage and in between
Collect Process Analyse Disseminate
Developed from input to output (in cycles)
input output
Big Data processes (3)
• Phases will be illustrated with examples
– Road intensity statistics (published)
• Using road sensor data
– Innovative company statistics (work in progress)
• Using text on main page of company web sites
– Energy: solar panel detection (work in progress)
• Using areal pictures to identify solar panels
There are three types of ‘data’ that can be used
1. Collect phase
• Assure stable access to data
– Long-term access is essential
– Often data from private companies
• Try to get some data
– Learn from the data (trail-and-error)
– Check various potential uses
• Include domain expert knowledge
– But not to early (ideas come first)
1. Collect phase (2)
• Road sensor data
– Maintained by organisation paid by the government
– Statistics Netherlands law gives us access
• Web sites of companies
– Scrape data for studies (scrape once, store raw data)
– In the future: inform companies in advance
• Solar panels work
– Free access to areal pictures (updated once a year)
– Is that frequent enough?
Questions 2
• What is the biggest problem when creating a
statistics fully based on Big Data?
• Stability of the source content
• Stability of access
• Stability of population included
• All of the above
• No problems at all
2. Process phase
• Composed of multiple steps
– Preprocessing
• Perform some very (time) efficient initial checks
• Convert and adjust the data prior to use
• May involve visualizations
– Cleaning (a.k.a. editing)
• Clean data when the quality for a specific use is not
sufficient
• Should be fully automatic (no manual checks)
• May involve visualizations
2. Process phase - preprocessing
• Raw data is usually preprocessed:
– After receiving it at the office (in a secure way)
Automatic Information System data (GPS of ships),
Areal Images, web scraping
• Dataset transmitted can be huge
• High infrastructural needs
– At the location of data maintainer
Road sensor data, Mobile phone data
• Use infrastructure of data maintainer
• Smaller dataset is transferred
• May solve privacy issue
• Process chain should still be in control of NSI
2. Process phase - preprocessing
• Increasing information content !!
– Remove unneeded and clearly erroneous records
• Size and population reduction
– Remove unneeded and clearly erroneous values
• Less columns, only keep what is needed
– To convert event-based to unit-based data
• Create a more suited dataset
• E.g. combining check-in and check-out data to trips
– Tailor data to needs of NSI
• Convert values to ranges used by NSI
– Extract features
• Construct new variables
For texts, very important choices (remove stop words, stemming, ….)
Discuss road sensor data as example
Population and variables
• In general it is important to consider:
– The units included in the source vs target population
• Which units are included? How to identify them?
• Topic of research at our office
• Extract features indicative for background characteristics
– Definition alignment
• Correspondence between definition used by data maintainer
(if known) and NSI
• Similar to administrative data
Example: Road sensor data
• Data generated by 20.000 road sensors
– Every minute data is produced by each sensor
(1440 records per sensor per day)
– A total of 48 variables are included in each record
of which only 13 are needed
– Some records contain clearly erroneous data:
-1 vehicles, no measurement, error flag on, location not
on road, ….
Raw road sensor data
Data of a single sensor during 196 subsequent days
Implemented quality indicators
- O: Number of zero measurements
|O|
D:
S:
Road sensor data indicators
• Relation between indicators, for 12 million
records
L (number of measurements) versus B (block indicator)
Question 3
• What is good quality?
• What are the advantages of Big Data in this
context?
Data Cleaning
• Why clean the data?
– Many data sources are very noisy
– Doing analysis on noisy data is difficult:
X = sin(seq(from=0,to=2*pi,by=0.01))
Y1 = X+2*runif(length(x))
Y2 = X+2*runif(length(x))
Print(cor(y1,y2)) will give a correlation of 0.6!!!!
– Erroneous data have a negative effect on the
quality of the estimates
The Signal and the Data
What is noise?
information
noise
data
data = information + noise
Noise is that part of the data that
is not relevant!
The Signal and the Data (2)
Road Sensor Data
• Counts per minute of vehicles
• Arrivals of vehicles at a road sensor
• (semi-) Poisson process
Implemented quality indicators
- O: Number of zero measurements
|O|
D:
S:
Recursive Bayesian Estimation
Cleaning the Data
Cleaning the Data
Recursive Bayesian Estimation
Cleaning the Data
Recursive Bayesian Estimation
34
Result of the filter
Example: Solar Panels
• Detect solar panels on rooftops
• Preprocessing by cutting out roofs
3. Analyse
• Getting insights from the data
Analysis
Model Driven Data Driven
Making sense of the data
Survey statistics
Target population (unit=person)
Sample of Persons
Questionnaire
Based on demographics
Frame
Selection
Measurements
Weights
Traffic statistics
Roads (unit=km)
Road sensors
Sensor data
Based on location …
Modeling the network of
Road Sensors
Modeling the network of
Road Sensors
• Dutch Highways
• Main routes only
Modeling the network of
Road Sensors
Main routes
Simplify
Main routesRaw shape
Projections
• Project road sensors on main routes
• Determine points of bifurcation for all entrance
and exit ramps
Entrance
ramp
Calibration of road sensors (2)
3000 2000 2500
20 7
Traffic
flow
Count 3000 3000 2000 2000 2500
Length 1055
5*3000 + 5*3000 + 10*2000 + 20*2000 + 7*2500 = 107,500 vehicle-km
3. Analyse (2)
• When only a part of the data is composed of
records of interest
– This amount may vary between 50% - 1%
– For example:
• Innovative companies (9%)
• Social tension (‘rare event’)
• Company accounts on social media (3%)
• Identify Belgian users (18%)
• All about modelling an imbalanced dataset
Analysis
Model
Driven
Data
Driven
3. Analyse (3)
• Dealing with imbalanced datasets
– Manually classify a sample (~1000 or more)
• Multiple persons, write down instructions!
• Result: training and test set
– Try various approaches to test what works best
• Logistic regression, Naive Bayes, Random Forest, SVM, NN,…
– Add features (try as many as possible)
• This adds domain knowledge
– Check effect of preprocessing steps
• Especially relevant for texts
– Sometimes over- or under-sampling training set works
• Results may vary, add more positive cases
– Visualize findings
Example: innovative companies
• Companies from innovation statistics survey
– 3000 innovative companies
– 3000 non-innovative companies
Downside: only companies with 10 or more working persons!
• Scraped websites
– Language detection, remove stop words, stemming
– Words: unigram, bigram, trigram, word embeddings
– Features: language, URL’s, email addresses, phone numbers,
address
• Checked various approaches
– Logistic regression, Naïve Bayes, Random Forest, NN
Example: innovative companies (2)
• Evaluated model on:
– Dutch SME innovation top 100 (various years) and list of Dutch
start-up's
• SME use different definition, nearly all start-up’s are innovative
• Model focusses on technological innovation
– 1 million company web sites and created detailed maps
• Way to reveals curious behaviour of model
• Able to create very detailed maps, at 4-digit zip-code level
• Around 9% is innovative (according to our model)
Question 4
• Name a few ways of dealing with imbalanced
datasets when modelling
• Under sample negative cases
• Add more positive cases
• Change evaluation metric
• Cross validate 10x
4. Dissemination
• Very much resembles standard output
• Visualization are particularly important for Big
Data based statistics
• A few examples
– Dot maps
– AIS journeys
Dot Maps
(commuting patterns)
https://research.cbs.nl/colordotmap/woonwerk
Animation on transhipment
https://research.cbs.nl/AIS_transshipment
Questions?
Thank you for your attention !!

EMOS 2018 Big Data methods and techniques

  • 1.
    EMOS Webinar Big DataMethods and Techniques Piet Daas & Marco Puts Statistics Netherlands Center for Big Data Statistics March 21, 2018 16:15 – 17:30
  • 2.
    Piet Daas • Work –Senior methodologist CBS – Lead Data Scientist CBDS – Project leader Big Data research CBS – Involved in ESSnet Big Data • Trainer – ESTP training course leader – EMOS Big Data trainer Univ. Utrecht – CBDS trainer – For lot’s and lot’s of students – And 2 dogs and 8 hamsters @pietdaas
  • 3.
    Marco Puts • Work –Methodologist CBS – Lead Data Scientist CBDS – Big Data Task Force member – Involved in ESSnet Big Data – Vegan • Trainer – ESTP training course leader – CBDS trainer – 4 tortoises
  • 4.
    Overview of Webinar •Properties of Big Data • Big Data processes – Collect – Process – Analyse – Disseminate • Wrap up & Discussion • Questions in between topics
  • 5.
    Big Data • Whatis Big Data? – How do we use this term? • Big Data is a source of data that is: – Rapidly available – Usually available in large amounts – Often generated by an unknown population – May have poor quality metadata – Usually has low information content – Requires processing prior to use – Unknown design
  • 6.
    Big Data’s mostimportant property Information content can be rather low for Big Data
  • 7.
    Paradigm shift • Needof change in the way (official) statisticians look at data https://en.wikipedia.org/wiki/Rabbit%E2%80%93duck_illusion#/media/File:Kaninchen_und_Ente.png
  • 8.
    Question 1 • Whatsources do you consider Big Data? – Social media messages – Product prices on web sites – Satellite pictures – Sensor data of cows – Persons register of China – Activity tracker data of 8 persons
  • 9.
    Big Data uses •Big Data was introduced in previous Webinars • A number of examples have been shown • Big Data: how can it be used?! (not only its potential) • General view on Big Data processes
  • 10.
    Big Data processes •In GSBPM terms, 4 phases 1. Collect Get (access to) data 2. Process Check and convert data 3. Analyse Learn from and extract knowledge from data 4. Disseminate Release results In this Webinar, we discuss Big Data as the main source of input for official statistics Alternatives uses are: as an additional source, to impute missing data and in model. *GSPBM = Generic Statistical Business Process Model
  • 11.
    In this Webinar •Focus is Big Data as the main source of input for official statistics • Alternative uses are: – as an additional source, – to impute missing data, – in a calibration model.
  • 12.
    Big Data processes(2) • Data driven: cycles in every stage and in between Collect Process Analyse Disseminate Developed from input to output (in cycles) input output
  • 13.
    Big Data processes(3) • Phases will be illustrated with examples – Road intensity statistics (published) • Using road sensor data – Innovative company statistics (work in progress) • Using text on main page of company web sites – Energy: solar panel detection (work in progress) • Using areal pictures to identify solar panels There are three types of ‘data’ that can be used
  • 14.
    1. Collect phase •Assure stable access to data – Long-term access is essential – Often data from private companies • Try to get some data – Learn from the data (trail-and-error) – Check various potential uses • Include domain expert knowledge – But not to early (ideas come first)
  • 15.
    1. Collect phase(2) • Road sensor data – Maintained by organisation paid by the government – Statistics Netherlands law gives us access • Web sites of companies – Scrape data for studies (scrape once, store raw data) – In the future: inform companies in advance • Solar panels work – Free access to areal pictures (updated once a year) – Is that frequent enough?
  • 16.
    Questions 2 • Whatis the biggest problem when creating a statistics fully based on Big Data? • Stability of the source content • Stability of access • Stability of population included • All of the above • No problems at all
  • 17.
    2. Process phase •Composed of multiple steps – Preprocessing • Perform some very (time) efficient initial checks • Convert and adjust the data prior to use • May involve visualizations – Cleaning (a.k.a. editing) • Clean data when the quality for a specific use is not sufficient • Should be fully automatic (no manual checks) • May involve visualizations
  • 18.
    2. Process phase- preprocessing • Raw data is usually preprocessed: – After receiving it at the office (in a secure way) Automatic Information System data (GPS of ships), Areal Images, web scraping • Dataset transmitted can be huge • High infrastructural needs – At the location of data maintainer Road sensor data, Mobile phone data • Use infrastructure of data maintainer • Smaller dataset is transferred • May solve privacy issue • Process chain should still be in control of NSI
  • 19.
    2. Process phase- preprocessing • Increasing information content !! – Remove unneeded and clearly erroneous records • Size and population reduction – Remove unneeded and clearly erroneous values • Less columns, only keep what is needed – To convert event-based to unit-based data • Create a more suited dataset • E.g. combining check-in and check-out data to trips – Tailor data to needs of NSI • Convert values to ranges used by NSI – Extract features • Construct new variables For texts, very important choices (remove stop words, stemming, ….) Discuss road sensor data as example
  • 20.
    Population and variables •In general it is important to consider: – The units included in the source vs target population • Which units are included? How to identify them? • Topic of research at our office • Extract features indicative for background characteristics – Definition alignment • Correspondence between definition used by data maintainer (if known) and NSI • Similar to administrative data
  • 21.
    Example: Road sensordata • Data generated by 20.000 road sensors – Every minute data is produced by each sensor (1440 records per sensor per day) – A total of 48 variables are included in each record of which only 13 are needed – Some records contain clearly erroneous data: -1 vehicles, no measurement, error flag on, location not on road, ….
  • 22.
    Raw road sensordata Data of a single sensor during 196 subsequent days
  • 23.
    Implemented quality indicators -O: Number of zero measurements |O| D: S:
  • 24.
    Road sensor dataindicators • Relation between indicators, for 12 million records L (number of measurements) versus B (block indicator)
  • 25.
    Question 3 • Whatis good quality? • What are the advantages of Big Data in this context?
  • 26.
    Data Cleaning • Whyclean the data? – Many data sources are very noisy – Doing analysis on noisy data is difficult: X = sin(seq(from=0,to=2*pi,by=0.01)) Y1 = X+2*runif(length(x)) Y2 = X+2*runif(length(x)) Print(cor(y1,y2)) will give a correlation of 0.6!!!! – Erroneous data have a negative effect on the quality of the estimates
  • 27.
    The Signal andthe Data What is noise? information noise data data = information + noise Noise is that part of the data that is not relevant!
  • 28.
    The Signal andthe Data (2)
  • 29.
    Road Sensor Data •Counts per minute of vehicles • Arrivals of vehicles at a road sensor • (semi-) Poisson process
  • 30.
    Implemented quality indicators -O: Number of zero measurements |O| D: S:
  • 31.
  • 32.
    Cleaning the Data RecursiveBayesian Estimation
  • 33.
    Cleaning the Data RecursiveBayesian Estimation
  • 34.
  • 35.
    Example: Solar Panels •Detect solar panels on rooftops • Preprocessing by cutting out roofs
  • 36.
    3. Analyse • Gettinginsights from the data Analysis Model Driven Data Driven
  • 37.
    Making sense ofthe data Survey statistics Target population (unit=person) Sample of Persons Questionnaire Based on demographics Frame Selection Measurements Weights Traffic statistics Roads (unit=km) Road sensors Sensor data Based on location …
  • 38.
    Modeling the networkof Road Sensors
  • 39.
    Modeling the networkof Road Sensors
  • 40.
    • Dutch Highways •Main routes only Modeling the network of Road Sensors
  • 41.
  • 42.
    Projections • Project roadsensors on main routes • Determine points of bifurcation for all entrance and exit ramps Entrance ramp
  • 43.
    Calibration of roadsensors (2) 3000 2000 2500 20 7 Traffic flow Count 3000 3000 2000 2000 2500 Length 1055 5*3000 + 5*3000 + 10*2000 + 20*2000 + 7*2500 = 107,500 vehicle-km
  • 44.
    3. Analyse (2) •When only a part of the data is composed of records of interest – This amount may vary between 50% - 1% – For example: • Innovative companies (9%) • Social tension (‘rare event’) • Company accounts on social media (3%) • Identify Belgian users (18%) • All about modelling an imbalanced dataset Analysis Model Driven Data Driven
  • 45.
    3. Analyse (3) •Dealing with imbalanced datasets – Manually classify a sample (~1000 or more) • Multiple persons, write down instructions! • Result: training and test set – Try various approaches to test what works best • Logistic regression, Naive Bayes, Random Forest, SVM, NN,… – Add features (try as many as possible) • This adds domain knowledge – Check effect of preprocessing steps • Especially relevant for texts – Sometimes over- or under-sampling training set works • Results may vary, add more positive cases – Visualize findings
  • 46.
    Example: innovative companies •Companies from innovation statistics survey – 3000 innovative companies – 3000 non-innovative companies Downside: only companies with 10 or more working persons! • Scraped websites – Language detection, remove stop words, stemming – Words: unigram, bigram, trigram, word embeddings – Features: language, URL’s, email addresses, phone numbers, address • Checked various approaches – Logistic regression, Naïve Bayes, Random Forest, NN
  • 47.
    Example: innovative companies(2) • Evaluated model on: – Dutch SME innovation top 100 (various years) and list of Dutch start-up's • SME use different definition, nearly all start-up’s are innovative • Model focusses on technological innovation – 1 million company web sites and created detailed maps • Way to reveals curious behaviour of model • Able to create very detailed maps, at 4-digit zip-code level • Around 9% is innovative (according to our model)
  • 48.
    Question 4 • Namea few ways of dealing with imbalanced datasets when modelling • Under sample negative cases • Add more positive cases • Change evaluation metric • Cross validate 10x
  • 49.
    4. Dissemination • Verymuch resembles standard output • Visualization are particularly important for Big Data based statistics • A few examples – Dot maps – AIS journeys
  • 50.
  • 51.
  • 52.
    Questions? Thank you foryour attention !!