Download to read offline

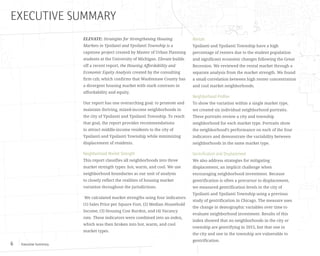
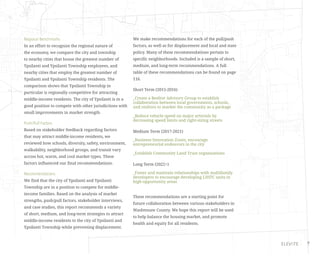


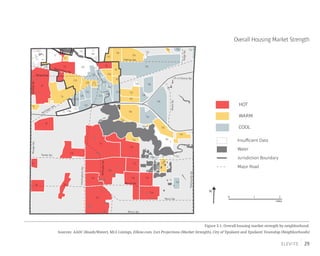

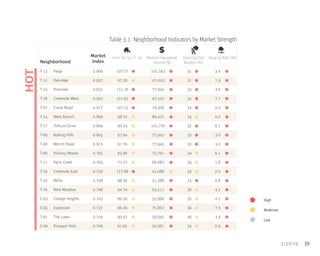
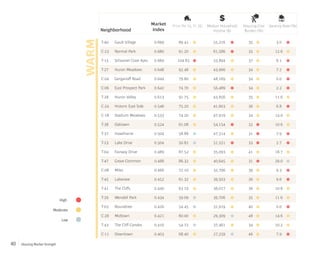
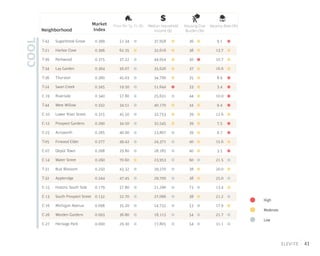


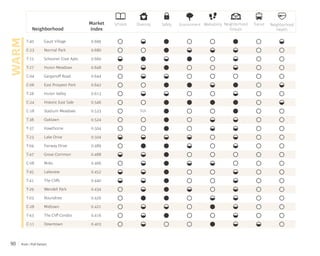
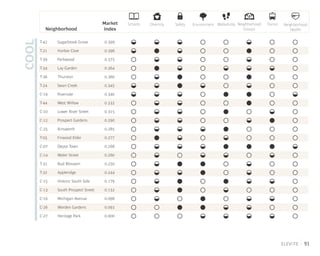


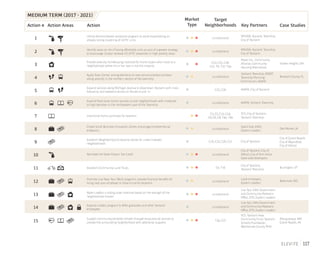
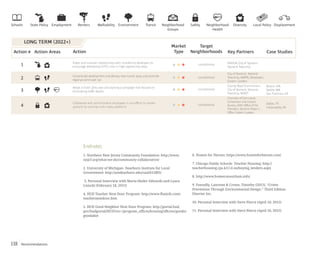


This report aims to strengthen housing markets in Ypsilanti and Ypsilanti Township by promoting mixed-income neighborhoods. It classifies all neighborhoods into "hot", "warm", or "cool" market types based on sales prices, incomes, housing costs, and vacancy rates. While the overall county housing market is healthy, Ypsilanti and the township have weaker markets and high rental concentrations. The report provides recommendations to attract middle-income residents without displacing current residents. It analyzes factors like schools, diversity, safety, and transit that influence housing choices. The recommendations target short, medium and long-term strategies at the neighborhood level to balance the market and promote equity.


