Download as XLS, PPTX
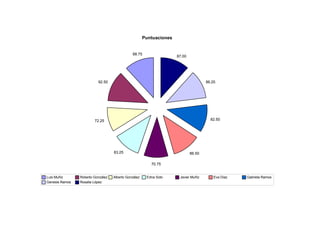

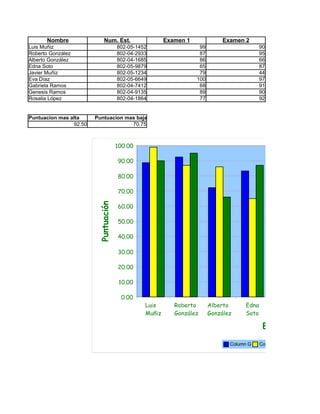
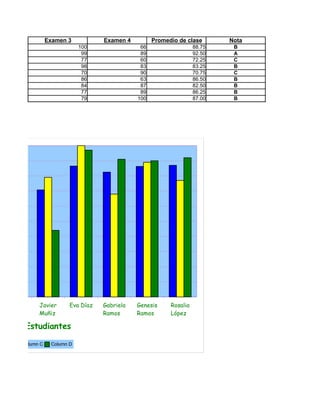
The document contains the scores of 9 students on 4 exams. It includes a bar graph showing the highest and lowest scores on Exam 1 and 2. It also includes two tables with the students' names, ID numbers, and their individual scores on each exam. The bottom table summarizes their class average, letter grade, and overall average.


![гласный звук [у], буквы уу](https://cdn.slidesharecdn.com/ss_thumbnails/random-131027132912-phpapp01-thumbnail.jpg?width=640&height=640&fit=bounds)


