Ejercicio 3
•
0 likes•12 views
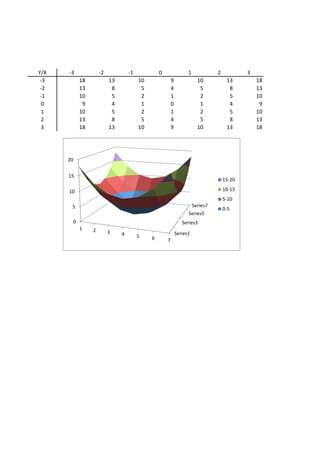
This document contains a table showing values along two axes from -3 to 3. The values along the y-axis range from 0 to 18 depending on the values along the x-axis from -3 to 3. The document also includes four unlabeled series that correspond to ranges of values in the table from 0-5, 5-10, 10-15, and 15-20.
Report
Share
Report
Share
Download to read offline
Recommended
Aerobits - Subsystems for the UAS integration into the airspace
Aerobits is a technological company specialized in avionics miniaturization. Our hardware and software solutions are dedicated, in particular, to the wide market of Unmanned Aircraft Systems. Their use is paving the way to UAS integration in the airspace, according to the planned strategy of aviation authorities.
Aerobits technology is currently the smallest and fastest implementation of the ADS-B air traffic surveillance system in the world, with ranges weighing from 1g. With the enormous level of miniaturization and patented fusion of FPGA and multi-core processor the powerful computational capacities are retained, ensuring the parallel support of many time-critical processes.
Viti rullate
Viti a ricircolo di sfere, rullate
Le viti a ricircolazione di sfere rettificate sono disponibili da diametro 16 a diametro 63 mm con passi da 5 a 40 mm. sia destro che sinistro (in alcune misure).
La chiocciola con precarico interno, con gioco o gioco ridotto, ha diverse esecuzioni di flangia.
La velocità di traslazione può arrivare ai 90 m/min. mentre viene sempre garantito un ottimo rendimento, ridotta rumorosità di funzionamento, grande affidabilità, ottima precisione di posizionamento.
Mohannad Abdullah portfolio _ V2 _22-24
Mohannad Abdullah
Architecture | Interior Design
portoflio_V2_22-24
PORTFOLIO FABIANA VILLANI ARCHITECTURE.pdf
Hello everyone! I am thrilled to present my latest portfolio on LinkedIn, marking the culmination of my architectural journey thus far. Over the span of five years, I've been fortunate to acquire a wealth of knowledge under the guidance of esteemed professors and industry mentors. From rigorous academic pursuits to practical engagements, each experience has contributed to my growth and refinement as an architecture student. This portfolio not only showcases my projects but also underscores my attention to detail and to innovative architecture as a profession.
一比一原版(LSE毕业证书)伦敦政治经济学院毕业证成绩单如何办理
原件一模一样【微信:6496090 】【(LSE毕业证书)伦敦政治经济学院毕业证成绩单】【微信:6496090 】学位证,留信认证(真实可查,永久存档)offer、雅思、外壳等材料/诚信可靠,可直接看成品样本,帮您解决无法毕业带来的各种难题!外壳,原版制作,诚信可靠,可直接看成品样本。行业标杆!精益求精,诚心合作,真诚制作!多年品质 ,按需精细制作,24小时接单,全套进口原装设备。十五年致力于帮助留学生解决难题,包您满意。
本公司拥有海外各大学样板无数,能完美还原。
1:1完美还原海外各大学毕业材料上的工艺:水印,阴影底纹,钢印LOGO烫金烫银,LOGO烫金烫银复合重叠。文字图案浮雕、激光镭射、紫外荧光、温感、复印防伪等防伪工艺。材料咨询办理、认证咨询办理请加学历顾问Q/微6496090
【主营项目】
一.毕业证【q微6496090】成绩单、使馆认证、教育部认证、雅思托福成绩单、学生卡等!
二.真实使馆公证(即留学回国人员证明,不成功不收费)
三.真实教育部学历学位认证(教育部存档!教育部留服网站永久可查)
四.办理各国各大学文凭(一对一专业服务,可全程监控跟踪进度)
如果您处于以下几种情况:
◇在校期间,因各种原因未能顺利毕业……拿不到官方毕业证【q/微6496090】
◇面对父母的压力,希望尽快拿到;
◇不清楚认证流程以及材料该如何准备;
◇回国时间很长,忘记办理;
◇回国马上就要找工作,办给用人单位看;
◇企事业单位必须要求办理的
◇需要报考公务员、购买免税车、落转户口
◇申请留学生创业基金
留信网认证的作用:
1:该专业认证可证明留学生真实身份
2:同时对留学生所学专业登记给予评定
3:国家专业人才认证中心颁发入库证书
4:这个认证书并且可以归档倒地方
5:凡事获得留信网入网的信息将会逐步更新到个人身份内,将在公安局网内查询个人身份证信息后,同步读取人才网入库信息
6:个人职称评审加20分
7:个人信誉贷款加10分
8:在国家人才网主办的国家网络招聘大会中纳入资料,供国家高端企业选择人才
一比一原版(BU毕业证书)伯恩茅斯大学毕业证成绩单如何办理
原件一模一样【微信:6496090 】【(BU毕业证书)伯恩茅斯大学毕业证成绩单】【微信:6496090 】学位证,留信认证(真实可查,永久存档)offer、雅思、外壳等材料/诚信可靠,可直接看成品样本,帮您解决无法毕业带来的各种难题!外壳,原版制作,诚信可靠,可直接看成品样本。行业标杆!精益求精,诚心合作,真诚制作!多年品质 ,按需精细制作,24小时接单,全套进口原装设备。十五年致力于帮助留学生解决难题,包您满意。
本公司拥有海外各大学样板无数,能完美还原。
1:1完美还原海外各大学毕业材料上的工艺:水印,阴影底纹,钢印LOGO烫金烫银,LOGO烫金烫银复合重叠。文字图案浮雕、激光镭射、紫外荧光、温感、复印防伪等防伪工艺。材料咨询办理、认证咨询办理请加学历顾问Q/微6496090
【主营项目】
一.毕业证【q微6496090】成绩单、使馆认证、教育部认证、雅思托福成绩单、学生卡等!
二.真实使馆公证(即留学回国人员证明,不成功不收费)
三.真实教育部学历学位认证(教育部存档!教育部留服网站永久可查)
四.办理各国各大学文凭(一对一专业服务,可全程监控跟踪进度)
如果您处于以下几种情况:
◇在校期间,因各种原因未能顺利毕业……拿不到官方毕业证【q/微6496090】
◇面对父母的压力,希望尽快拿到;
◇不清楚认证流程以及材料该如何准备;
◇回国时间很长,忘记办理;
◇回国马上就要找工作,办给用人单位看;
◇企事业单位必须要求办理的
◇需要报考公务员、购买免税车、落转户口
◇申请留学生创业基金
留信网认证的作用:
1:该专业认证可证明留学生真实身份
2:同时对留学生所学专业登记给予评定
3:国家专业人才认证中心颁发入库证书
4:这个认证书并且可以归档倒地方
5:凡事获得留信网入网的信息将会逐步更新到个人身份内,将在公安局网内查询个人身份证信息后,同步读取人才网入库信息
6:个人职称评审加20分
7:个人信誉贷款加10分
8:在国家人才网主办的国家网络招聘大会中纳入资料,供国家高端企业选择人才
ARENA - Young adults in the workplace (Knight Moves).pdf
Presentations of Bavo Raeymaekers (Project lead youth unemployment at the City of Antwerp), Suzan Martens (Service designer at Knight Moves) and Adriaan De Keersmaeker (Community manager at Talk to C)
during the 'Arena • Young adults in the workplace' conference hosted by Knight Moves.
一比一原版(NCL毕业证书)纽卡斯尔大学毕业证成绩单如何办理
学校原件一模一样【微信:6496090 】【(NCL毕业证书)纽卡斯尔大学毕业证成绩单】【微信:6496090 】学位证,留信认证(真实可查,永久存档)原件一模一样纸张工艺/offer、雅思、外壳等材料/诚信可靠,可直接看成品样本,帮您解决无法毕业带来的各种难题!外壳,原版制作,诚信可靠,可直接看成品样本。行业标杆!精益求精,诚心合作,真诚制作!多年品质 ,按需精细制作,24小时接单,全套进口原装设备。十五年致力于帮助留学生解决难题,包您满意。
本公司拥有海外各大学样板无数,能完美还原。
1:1完美还原海外各大学毕业材料上的工艺:水印,阴影底纹,钢印LOGO烫金烫银,LOGO烫金烫银复合重叠。文字图案浮雕、激光镭射、紫外荧光、温感、复印防伪等防伪工艺。材料咨询办理、认证咨询办理请加学历顾问Q/微6496090
【主营项目】
一.毕业证【q微6496090】成绩单、使馆认证、教育部认证、雅思托福成绩单、学生卡等!
二.真实使馆公证(即留学回国人员证明,不成功不收费)
三.真实教育部学历学位认证(教育部存档!教育部留服网站永久可查)
四.办理各国各大学文凭(一对一专业服务,可全程监控跟踪进度)
如果您处于以下几种情况:
◇在校期间,因各种原因未能顺利毕业……拿不到官方毕业证【q/微6496090】
◇面对父母的压力,希望尽快拿到;
◇不清楚认证流程以及材料该如何准备;
◇回国时间很长,忘记办理;
◇回国马上就要找工作,办给用人单位看;
◇企事业单位必须要求办理的
◇需要报考公务员、购买免税车、落转户口
◇申请留学生创业基金
留信网认证的作用:
1:该专业认证可证明留学生真实身份
2:同时对留学生所学专业登记给予评定
3:国家专业人才认证中心颁发入库证书
4:这个认证书并且可以归档倒地方
5:凡事获得留信网入网的信息将会逐步更新到个人身份内,将在公安局网内查询个人身份证信息后,同步读取人才网入库信息
6:个人职称评审加20分
7:个人信誉贷款加10分
8:在国家人才网主办的国家网络招聘大会中纳入资料,供国家高端企业选择人才
办理(NCL毕业证书)纽卡斯尔大学毕业证【微信:6496090 】外观非常简单,由纸质材料制成,上面印有校徽、校名、毕业生姓名、专业等信息。
办理(NCL毕业证书)纽卡斯尔大学毕业证【微信:6496090 】格式相对统一,各专业都有相应的模板。通常包括以下部分:
校徽:象征着学校的荣誉和传承。
校名:学校英文全称
授予学位:本部分将注明获得的具体学位名称。
毕业生姓名:这是最重要的信息之一,标志着该证书是由特定人员获得的。
颁发日期:这是毕业正式生效的时间,也代表着毕业生学业的结束。
其他信息:根据不同的专业和学位,可能会有一些特定的信息或章节。
办理(NCL毕业证书)纽卡斯尔大学毕业证【微信:6496090 】价值很高,需要妥善保管。一般来说,应放置在安全、干燥、防潮的地方,避免长时间暴露在阳光下。如需使用,最好使用复印件而不是原件,以免丢失。
综上所述,办理(NCL毕业证书)纽卡斯尔大学毕业证【微信:6496090 】是证明身份和学历的高价值文件。外观简单庄重,格式统一,包括重要的个人信息和发布日期。对持有人来说,妥善保管是非常重要的。
Can AI do good? at 'offtheCanvas' India HCI prelude
Invited talk at 'offtheCanvas' IndiaHCI prelude, 29th June 2024.
https://www.alandix.com/academic/talks/offtheCanvas-IndiaHCI2024/
The world is being changed fundamentally by AI and we are constantly faced with newspaper headlines about its harmful effects. However, there is also the potential to both ameliorate theses harms and use the new abilities of AI to transform society for the good. Can you make the difference?
一比一原版(毕业证)长崎大学毕业证成绩单如何办理
一模一样【q/微:1954292140】【(毕业证)长崎大学毕业证成绩单Offer】【q/微:1954292140】(留信学历认证永久存档查询)采用学校原版纸张、特殊工艺完全按照原版一比一制作(包括:隐形水印,阴影底纹,钢印LOGO烫金烫银,LOGO烫金烫银复合重叠,文字图案浮雕,激光镭射,紫外荧光,温感,复印防伪)行业标杆!精益求精,诚心合作,真诚制作!多年品质 ,按需精细制作,24小时接单,全套进口原装设备,十五年致力于帮助留学生解决难题,业务范围有加拿大、英国、澳洲、韩国、美国、新加坡,新西兰等学历材料,包您满意。
【业务选择办理准则】
一、工作未确定,回国需先给父母、亲戚朋友看下文凭的情况,办理一份就读学校的毕业证【q/微:1954292140】文凭即可
二、回国进私企、外企、自己做生意的情况,这些单位是不查询毕业证真伪的,而且国内没有渠道去查询国外文凭的真假,也不需要提供真实教育部认证。鉴于此,办理一份毕业证【q/微:1954292140】即可
三、进国企,银行,事业单位,考公务员等等,这些单位是必需要提供真实教育部认证的,办理教育部认证所需资料众多且烦琐,所有材料您都必须提供原件,我们凭借丰富的经验,快捷的绿色通道帮您快速整合材料,让您少走弯路。
留信网认证的作用:
1:该专业认证可证明留学生真实身份
2:同时对留学生所学专业登记给予评定
3:国家专业人才认证中心颁发入库证书
4:这个认证书并且可以归档倒地方
5:凡事获得留信网入网的信息将会逐步更新到个人身份内,将在公安局网内查询个人身份证信息后,同步读取人才网入库信息
6:个人职称评审加20分
7:个人信誉贷款加10分
8:在国家人才网主办的国家网络招聘大会中纳入资料,供国家高端企业选择人才
→ 【关于价格问题(保证一手价格)
我们所定的价格是非常合理的,而且我们现在做得单子大多数都是代理和回头客户介绍的所以一般现在有新的单子 我给客户的都是第一手的代理价格,因为我想坦诚对待大家 不想跟大家在价格方面浪费时间
对于老客户或者被老客户介绍过来的朋友,我们都会适当给一些优惠。
选择实体注册公司办理,更放心,更安全!我们的承诺:可来公司面谈,可签订合同,会陪同客户一起到教育部认证窗口递交认证材料,客户在教育部官方认证查询网站查询到认证通过结果后付款,不成功不收费!
Between Filth and Fortune- Urban Cattle Foraging Realities by Devi S Nair, An...
This study examines cattle rearing in urban and rural settings, focusing on milk production and consumption. By exploring a case in Ahmedabad, it highlights the challenges and processes in dairy farming across different environments, emphasising the need for sustainable practices and the essential role of milk in daily consumption.
一比一原版(UAL毕业证书)伦敦艺术大学毕业证成绩单如何办理
原件一模一样【微信:6496090 】【(UAL毕业证书)伦敦艺术大学毕业证成绩单】【微信:6496090 】学位证,留信认证(真实可查,永久存档)offer、雅思、外壳等材料/诚信可靠,可直接看成品样本,帮您解决无法毕业带来的各种难题!外壳,原版制作,诚信可靠,可直接看成品样本。行业标杆!精益求精,诚心合作,真诚制作!多年品质 ,按需精细制作,24小时接单,全套进口原装设备。十五年致力于帮助留学生解决难题,包您满意。
本公司拥有海外各大学样板无数,能完美还原。
1:1完美还原海外各大学毕业材料上的工艺:水印,阴影底纹,钢印LOGO烫金烫银,LOGO烫金烫银复合重叠。文字图案浮雕、激光镭射、紫外荧光、温感、复印防伪等防伪工艺。材料咨询办理、认证咨询办理请加学历顾问Q/微6496090
【主营项目】
一.毕业证【q微6496090】成绩单、使馆认证、教育部认证、雅思托福成绩单、学生卡等!
二.真实使馆公证(即留学回国人员证明,不成功不收费)
三.真实教育部学历学位认证(教育部存档!教育部留服网站永久可查)
四.办理各国各大学文凭(一对一专业服务,可全程监控跟踪进度)
如果您处于以下几种情况:
◇在校期间,因各种原因未能顺利毕业……拿不到官方毕业证【q/微6496090】
◇面对父母的压力,希望尽快拿到;
◇不清楚认证流程以及材料该如何准备;
◇回国时间很长,忘记办理;
◇回国马上就要找工作,办给用人单位看;
◇企事业单位必须要求办理的
◇需要报考公务员、购买免税车、落转户口
◇申请留学生创业基金
留信网认证的作用:
1:该专业认证可证明留学生真实身份
2:同时对留学生所学专业登记给予评定
3:国家专业人才认证中心颁发入库证书
4:这个认证书并且可以归档倒地方
5:凡事获得留信网入网的信息将会逐步更新到个人身份内,将在公安局网内查询个人身份证信息后,同步读取人才网入库信息
6:个人职称评审加20分
7:个人信誉贷款加10分
8:在国家人才网主办的国家网络招聘大会中纳入资料,供国家高端企业选择人才
Timeless Principles of Good Design
Timeless Principles of Good Design from my 2015 Presentation at TYPO SF
UNIT V ACTIONS AND COMMANDS, FORMS AND CONTROLS.pptx
Actions and Commands:
Tap, Swipe, and Pinch
Rotate and Shake -Buttons -Menu Bars – Menus
Toolbars - Links- Action Panels
Hover Tools - Keyboard Actions- Drag-and-Drop
Typed Commands-Affordance-Direct Manipulation.
Forms and Controls:
Basics of Form Design
Patterns.
More Related Content
More from JuanDragoTanuri
More from JuanDragoTanuri (10)
Recently uploaded
Mohannad Abdullah portfolio _ V2 _22-24
Mohannad Abdullah
Architecture | Interior Design
portoflio_V2_22-24
PORTFOLIO FABIANA VILLANI ARCHITECTURE.pdf
Hello everyone! I am thrilled to present my latest portfolio on LinkedIn, marking the culmination of my architectural journey thus far. Over the span of five years, I've been fortunate to acquire a wealth of knowledge under the guidance of esteemed professors and industry mentors. From rigorous academic pursuits to practical engagements, each experience has contributed to my growth and refinement as an architecture student. This portfolio not only showcases my projects but also underscores my attention to detail and to innovative architecture as a profession.
一比一原版(LSE毕业证书)伦敦政治经济学院毕业证成绩单如何办理
原件一模一样【微信:6496090 】【(LSE毕业证书)伦敦政治经济学院毕业证成绩单】【微信:6496090 】学位证,留信认证(真实可查,永久存档)offer、雅思、外壳等材料/诚信可靠,可直接看成品样本,帮您解决无法毕业带来的各种难题!外壳,原版制作,诚信可靠,可直接看成品样本。行业标杆!精益求精,诚心合作,真诚制作!多年品质 ,按需精细制作,24小时接单,全套进口原装设备。十五年致力于帮助留学生解决难题,包您满意。
本公司拥有海外各大学样板无数,能完美还原。
1:1完美还原海外各大学毕业材料上的工艺:水印,阴影底纹,钢印LOGO烫金烫银,LOGO烫金烫银复合重叠。文字图案浮雕、激光镭射、紫外荧光、温感、复印防伪等防伪工艺。材料咨询办理、认证咨询办理请加学历顾问Q/微6496090
【主营项目】
一.毕业证【q微6496090】成绩单、使馆认证、教育部认证、雅思托福成绩单、学生卡等!
二.真实使馆公证(即留学回国人员证明,不成功不收费)
三.真实教育部学历学位认证(教育部存档!教育部留服网站永久可查)
四.办理各国各大学文凭(一对一专业服务,可全程监控跟踪进度)
如果您处于以下几种情况:
◇在校期间,因各种原因未能顺利毕业……拿不到官方毕业证【q/微6496090】
◇面对父母的压力,希望尽快拿到;
◇不清楚认证流程以及材料该如何准备;
◇回国时间很长,忘记办理;
◇回国马上就要找工作,办给用人单位看;
◇企事业单位必须要求办理的
◇需要报考公务员、购买免税车、落转户口
◇申请留学生创业基金
留信网认证的作用:
1:该专业认证可证明留学生真实身份
2:同时对留学生所学专业登记给予评定
3:国家专业人才认证中心颁发入库证书
4:这个认证书并且可以归档倒地方
5:凡事获得留信网入网的信息将会逐步更新到个人身份内,将在公安局网内查询个人身份证信息后,同步读取人才网入库信息
6:个人职称评审加20分
7:个人信誉贷款加10分
8:在国家人才网主办的国家网络招聘大会中纳入资料,供国家高端企业选择人才
一比一原版(BU毕业证书)伯恩茅斯大学毕业证成绩单如何办理
原件一模一样【微信:6496090 】【(BU毕业证书)伯恩茅斯大学毕业证成绩单】【微信:6496090 】学位证,留信认证(真实可查,永久存档)offer、雅思、外壳等材料/诚信可靠,可直接看成品样本,帮您解决无法毕业带来的各种难题!外壳,原版制作,诚信可靠,可直接看成品样本。行业标杆!精益求精,诚心合作,真诚制作!多年品质 ,按需精细制作,24小时接单,全套进口原装设备。十五年致力于帮助留学生解决难题,包您满意。
本公司拥有海外各大学样板无数,能完美还原。
1:1完美还原海外各大学毕业材料上的工艺:水印,阴影底纹,钢印LOGO烫金烫银,LOGO烫金烫银复合重叠。文字图案浮雕、激光镭射、紫外荧光、温感、复印防伪等防伪工艺。材料咨询办理、认证咨询办理请加学历顾问Q/微6496090
【主营项目】
一.毕业证【q微6496090】成绩单、使馆认证、教育部认证、雅思托福成绩单、学生卡等!
二.真实使馆公证(即留学回国人员证明,不成功不收费)
三.真实教育部学历学位认证(教育部存档!教育部留服网站永久可查)
四.办理各国各大学文凭(一对一专业服务,可全程监控跟踪进度)
如果您处于以下几种情况:
◇在校期间,因各种原因未能顺利毕业……拿不到官方毕业证【q/微6496090】
◇面对父母的压力,希望尽快拿到;
◇不清楚认证流程以及材料该如何准备;
◇回国时间很长,忘记办理;
◇回国马上就要找工作,办给用人单位看;
◇企事业单位必须要求办理的
◇需要报考公务员、购买免税车、落转户口
◇申请留学生创业基金
留信网认证的作用:
1:该专业认证可证明留学生真实身份
2:同时对留学生所学专业登记给予评定
3:国家专业人才认证中心颁发入库证书
4:这个认证书并且可以归档倒地方
5:凡事获得留信网入网的信息将会逐步更新到个人身份内,将在公安局网内查询个人身份证信息后,同步读取人才网入库信息
6:个人职称评审加20分
7:个人信誉贷款加10分
8:在国家人才网主办的国家网络招聘大会中纳入资料,供国家高端企业选择人才
ARENA - Young adults in the workplace (Knight Moves).pdf
Presentations of Bavo Raeymaekers (Project lead youth unemployment at the City of Antwerp), Suzan Martens (Service designer at Knight Moves) and Adriaan De Keersmaeker (Community manager at Talk to C)
during the 'Arena • Young adults in the workplace' conference hosted by Knight Moves.
一比一原版(NCL毕业证书)纽卡斯尔大学毕业证成绩单如何办理
学校原件一模一样【微信:6496090 】【(NCL毕业证书)纽卡斯尔大学毕业证成绩单】【微信:6496090 】学位证,留信认证(真实可查,永久存档)原件一模一样纸张工艺/offer、雅思、外壳等材料/诚信可靠,可直接看成品样本,帮您解决无法毕业带来的各种难题!外壳,原版制作,诚信可靠,可直接看成品样本。行业标杆!精益求精,诚心合作,真诚制作!多年品质 ,按需精细制作,24小时接单,全套进口原装设备。十五年致力于帮助留学生解决难题,包您满意。
本公司拥有海外各大学样板无数,能完美还原。
1:1完美还原海外各大学毕业材料上的工艺:水印,阴影底纹,钢印LOGO烫金烫银,LOGO烫金烫银复合重叠。文字图案浮雕、激光镭射、紫外荧光、温感、复印防伪等防伪工艺。材料咨询办理、认证咨询办理请加学历顾问Q/微6496090
【主营项目】
一.毕业证【q微6496090】成绩单、使馆认证、教育部认证、雅思托福成绩单、学生卡等!
二.真实使馆公证(即留学回国人员证明,不成功不收费)
三.真实教育部学历学位认证(教育部存档!教育部留服网站永久可查)
四.办理各国各大学文凭(一对一专业服务,可全程监控跟踪进度)
如果您处于以下几种情况:
◇在校期间,因各种原因未能顺利毕业……拿不到官方毕业证【q/微6496090】
◇面对父母的压力,希望尽快拿到;
◇不清楚认证流程以及材料该如何准备;
◇回国时间很长,忘记办理;
◇回国马上就要找工作,办给用人单位看;
◇企事业单位必须要求办理的
◇需要报考公务员、购买免税车、落转户口
◇申请留学生创业基金
留信网认证的作用:
1:该专业认证可证明留学生真实身份
2:同时对留学生所学专业登记给予评定
3:国家专业人才认证中心颁发入库证书
4:这个认证书并且可以归档倒地方
5:凡事获得留信网入网的信息将会逐步更新到个人身份内,将在公安局网内查询个人身份证信息后,同步读取人才网入库信息
6:个人职称评审加20分
7:个人信誉贷款加10分
8:在国家人才网主办的国家网络招聘大会中纳入资料,供国家高端企业选择人才
办理(NCL毕业证书)纽卡斯尔大学毕业证【微信:6496090 】外观非常简单,由纸质材料制成,上面印有校徽、校名、毕业生姓名、专业等信息。
办理(NCL毕业证书)纽卡斯尔大学毕业证【微信:6496090 】格式相对统一,各专业都有相应的模板。通常包括以下部分:
校徽:象征着学校的荣誉和传承。
校名:学校英文全称
授予学位:本部分将注明获得的具体学位名称。
毕业生姓名:这是最重要的信息之一,标志着该证书是由特定人员获得的。
颁发日期:这是毕业正式生效的时间,也代表着毕业生学业的结束。
其他信息:根据不同的专业和学位,可能会有一些特定的信息或章节。
办理(NCL毕业证书)纽卡斯尔大学毕业证【微信:6496090 】价值很高,需要妥善保管。一般来说,应放置在安全、干燥、防潮的地方,避免长时间暴露在阳光下。如需使用,最好使用复印件而不是原件,以免丢失。
综上所述,办理(NCL毕业证书)纽卡斯尔大学毕业证【微信:6496090 】是证明身份和学历的高价值文件。外观简单庄重,格式统一,包括重要的个人信息和发布日期。对持有人来说,妥善保管是非常重要的。
Can AI do good? at 'offtheCanvas' India HCI prelude
Invited talk at 'offtheCanvas' IndiaHCI prelude, 29th June 2024.
https://www.alandix.com/academic/talks/offtheCanvas-IndiaHCI2024/
The world is being changed fundamentally by AI and we are constantly faced with newspaper headlines about its harmful effects. However, there is also the potential to both ameliorate theses harms and use the new abilities of AI to transform society for the good. Can you make the difference?
一比一原版(毕业证)长崎大学毕业证成绩单如何办理
一模一样【q/微:1954292140】【(毕业证)长崎大学毕业证成绩单Offer】【q/微:1954292140】(留信学历认证永久存档查询)采用学校原版纸张、特殊工艺完全按照原版一比一制作(包括:隐形水印,阴影底纹,钢印LOGO烫金烫银,LOGO烫金烫银复合重叠,文字图案浮雕,激光镭射,紫外荧光,温感,复印防伪)行业标杆!精益求精,诚心合作,真诚制作!多年品质 ,按需精细制作,24小时接单,全套进口原装设备,十五年致力于帮助留学生解决难题,业务范围有加拿大、英国、澳洲、韩国、美国、新加坡,新西兰等学历材料,包您满意。
【业务选择办理准则】
一、工作未确定,回国需先给父母、亲戚朋友看下文凭的情况,办理一份就读学校的毕业证【q/微:1954292140】文凭即可
二、回国进私企、外企、自己做生意的情况,这些单位是不查询毕业证真伪的,而且国内没有渠道去查询国外文凭的真假,也不需要提供真实教育部认证。鉴于此,办理一份毕业证【q/微:1954292140】即可
三、进国企,银行,事业单位,考公务员等等,这些单位是必需要提供真实教育部认证的,办理教育部认证所需资料众多且烦琐,所有材料您都必须提供原件,我们凭借丰富的经验,快捷的绿色通道帮您快速整合材料,让您少走弯路。
留信网认证的作用:
1:该专业认证可证明留学生真实身份
2:同时对留学生所学专业登记给予评定
3:国家专业人才认证中心颁发入库证书
4:这个认证书并且可以归档倒地方
5:凡事获得留信网入网的信息将会逐步更新到个人身份内,将在公安局网内查询个人身份证信息后,同步读取人才网入库信息
6:个人职称评审加20分
7:个人信誉贷款加10分
8:在国家人才网主办的国家网络招聘大会中纳入资料,供国家高端企业选择人才
→ 【关于价格问题(保证一手价格)
我们所定的价格是非常合理的,而且我们现在做得单子大多数都是代理和回头客户介绍的所以一般现在有新的单子 我给客户的都是第一手的代理价格,因为我想坦诚对待大家 不想跟大家在价格方面浪费时间
对于老客户或者被老客户介绍过来的朋友,我们都会适当给一些优惠。
选择实体注册公司办理,更放心,更安全!我们的承诺:可来公司面谈,可签订合同,会陪同客户一起到教育部认证窗口递交认证材料,客户在教育部官方认证查询网站查询到认证通过结果后付款,不成功不收费!
Between Filth and Fortune- Urban Cattle Foraging Realities by Devi S Nair, An...
This study examines cattle rearing in urban and rural settings, focusing on milk production and consumption. By exploring a case in Ahmedabad, it highlights the challenges and processes in dairy farming across different environments, emphasising the need for sustainable practices and the essential role of milk in daily consumption.
一比一原版(UAL毕业证书)伦敦艺术大学毕业证成绩单如何办理
原件一模一样【微信:6496090 】【(UAL毕业证书)伦敦艺术大学毕业证成绩单】【微信:6496090 】学位证,留信认证(真实可查,永久存档)offer、雅思、外壳等材料/诚信可靠,可直接看成品样本,帮您解决无法毕业带来的各种难题!外壳,原版制作,诚信可靠,可直接看成品样本。行业标杆!精益求精,诚心合作,真诚制作!多年品质 ,按需精细制作,24小时接单,全套进口原装设备。十五年致力于帮助留学生解决难题,包您满意。
本公司拥有海外各大学样板无数,能完美还原。
1:1完美还原海外各大学毕业材料上的工艺:水印,阴影底纹,钢印LOGO烫金烫银,LOGO烫金烫银复合重叠。文字图案浮雕、激光镭射、紫外荧光、温感、复印防伪等防伪工艺。材料咨询办理、认证咨询办理请加学历顾问Q/微6496090
【主营项目】
一.毕业证【q微6496090】成绩单、使馆认证、教育部认证、雅思托福成绩单、学生卡等!
二.真实使馆公证(即留学回国人员证明,不成功不收费)
三.真实教育部学历学位认证(教育部存档!教育部留服网站永久可查)
四.办理各国各大学文凭(一对一专业服务,可全程监控跟踪进度)
如果您处于以下几种情况:
◇在校期间,因各种原因未能顺利毕业……拿不到官方毕业证【q/微6496090】
◇面对父母的压力,希望尽快拿到;
◇不清楚认证流程以及材料该如何准备;
◇回国时间很长,忘记办理;
◇回国马上就要找工作,办给用人单位看;
◇企事业单位必须要求办理的
◇需要报考公务员、购买免税车、落转户口
◇申请留学生创业基金
留信网认证的作用:
1:该专业认证可证明留学生真实身份
2:同时对留学生所学专业登记给予评定
3:国家专业人才认证中心颁发入库证书
4:这个认证书并且可以归档倒地方
5:凡事获得留信网入网的信息将会逐步更新到个人身份内,将在公安局网内查询个人身份证信息后,同步读取人才网入库信息
6:个人职称评审加20分
7:个人信誉贷款加10分
8:在国家人才网主办的国家网络招聘大会中纳入资料,供国家高端企业选择人才
Timeless Principles of Good Design
Timeless Principles of Good Design from my 2015 Presentation at TYPO SF
UNIT V ACTIONS AND COMMANDS, FORMS AND CONTROLS.pptx
Actions and Commands:
Tap, Swipe, and Pinch
Rotate and Shake -Buttons -Menu Bars – Menus
Toolbars - Links- Action Panels
Hover Tools - Keyboard Actions- Drag-and-Drop
Typed Commands-Affordance-Direct Manipulation.
Forms and Controls:
Basics of Form Design
Patterns.
EASY TUTORIAL OF HOW TO USE CAPCUT BY: FEBLESS HERNANE
CapCut is an easy-to-use video editing app perfect for beginners. To start, download and open CapCut on your phone. Tap "New Project" and select the videos or photos you want to edit. You can trim clips by dragging the edges, add text by tapping "Text," and include music by selecting "Audio." Enhance your video with filters and effects from the "Effects" menu. When you're happy with your video, tap the export button to save and share it. CapCut makes video editing simple and fun for everyone!
Design Thinking Design thinking Design thinking
https://www.google.com/maps/d/view?mid=1GLIP8ROi4pdWoJ20H59hiDkXGn_aau0&ll=22.396537375469673%2C114.10949749999997&z=11
https://www.google.com/maps/d/view?mid=1VqNLpP6H4bXwKQoiq7ctlJ6hV6Rf7bU&ll=22.396537375469673%2C114.10949749999997&z=11
https://www.google.com/maps/d/view?mid=1P9FRl4ZIqXk8l_6Q3BzRa-6I-m5dSMw&ll=22.396537375469673%2C114.10949749999997&z=11
https://www.google.com/maps/d/view?mid=1S47yy5qCcoQnEIj8-8VWfFP3KF8F5dE&ll=22.396537375469673%2C114.10949749999997&z=11
https://www.google.com/maps/d/view?mid=1GjI1ThsmUCrOPcnT5LeAzdNFxVigfG8&ll=22.396537375469673%2C114.10949749999997&z=11
https://www.google.com/maps/d/view?mid=1jaCJIVbvR0eIjwaQTzCl4todLsfxCYY&ll=22.396537375469673%2C114.10949749999997&z=11
https://www.google.com/maps/d/view?mid=19cUdSW_Zt7BZnwBX5owfJfjSL9X5nFU&ll=22.396537375469673%2C114.10949749999997&z=11
https://www.google.com/maps/d/view?mid=1VZdW6ZnJJLMNqRa0x_dYPVgQ5aEvgnc&ll=22.396537375469673%2C114.10949749999997&z=11
https://www.google.com/maps/d/view?mid=1wJYkMPkdjK0D8PYQeKQCPR5vbnfJSfo&ll=22.396537375469673%2C114.10949749999997&z=11
https://www.google.com/maps/d/view?mid=1WeIHKG9Zhi_JaLfqSC845HAeS65f894&ll=22.396537375469673%2C114.10949749999997&z=11
https://www.google.com/maps/d/view?mid=15LiUYaeD2uCOeHMKvn9tQ6tLCOsxcv0&ll=22.396537375469673%2C114.10949749999997&z=11
https://www.google.com/maps/d/view?mid=1iLLsh30u99WyTc8rRXL4wUUsSp5MnJk&ll=22.396537375469673%2C114.10949749999997&z=11
https://www.google.com/maps/d/view?mid=1S03vvWWj_n6xBxG8SKepMSOj7wrfHRQ&ll=22.396537375469673%2C114.10949749999997&z=11
https://www.google.com/maps/d/view?mid=1tn4RiW3Skp5YCJ_a-GlA7TJub2Ia7Oc&ll=22.396537375469673%2C114.10949749999997&z=11
https://www.google.com/maps/d/view?mid=1HafSOZ3MkJGTXBeI_L_t5lKjxZ6XayE&ll=22.396537375469673%2C114.10949749999997&z=11
https://www.google.com/maps/d/view?mid=19tqnZi3jiWXyBjrt0EL5C3_h_RW2dII&ll=22.396537375469673%2C114.10949749999997&z=11
https://www.google.com/maps/d/view?mid=1pj59fnGHnUAEdsdwfba4GdR9R-FsSfc&ll=22.396537375469673%2C114.10949749999997&z=11
https://www.google.com/maps/d/view?mid=1jH7Mh5Qc0cGsM7tNjApTN5mn5sr3sWA&ll=22.396537375469673%2C114.10949749999997&z=11
https://www.google.com/maps/d/view?mid=192sbDAjg_ufyPg3gOa-QPLaQe4Teb9s&ll=22.396537375469673%2C114.10949749999997&z=11
https://www.google.com/maps/d/view?mid=1O7GD4hBEOg-BVrdKpqYQhMAl-wUU4Go&ll=22.396537375469673%2C114.10949749999997&z=11
https://www.google.com/maps/d/view?mid=13ViiBwWTWravc5uHEmkyPyzVgbNAIu4&ll=22.396537375469673%2C114.10949749999997&z=11
SECURING BUILDING PERMIT CITY OF CALOOCAN.pdf
How to apply for building permit in the city of Caloocan?
What is a building permit?
Who applies for building permit?
一比一原版(Glasgow毕业证书)格拉斯哥大学毕业证成绩单如何办理
原件一模一样【微信:6496090 】【(Glasgow毕业证书)格拉斯哥大学毕业证成绩单】【微信:6496090 】学位证,留信认证(真实可查,永久存档)offer、雅思、外壳等材料/诚信可靠,可直接看成品样本,帮您解决无法毕业带来的各种难题!外壳,原版制作,诚信可靠,可直接看成品样本。行业标杆!精益求精,诚心合作,真诚制作!多年品质 ,按需精细制作,24小时接单,全套进口原装设备。十五年致力于帮助留学生解决难题,包您满意。
本公司拥有海外各大学样板无数,能完美还原。
1:1完美还原海外各大学毕业材料上的工艺:水印,阴影底纹,钢印LOGO烫金烫银,LOGO烫金烫银复合重叠。文字图案浮雕、激光镭射、紫外荧光、温感、复印防伪等防伪工艺。材料咨询办理、认证咨询办理请加学历顾问Q/微6496090
【主营项目】
一.毕业证【q微6496090】成绩单、使馆认证、教育部认证、雅思托福成绩单、学生卡等!
二.真实使馆公证(即留学回国人员证明,不成功不收费)
三.真实教育部学历学位认证(教育部存档!教育部留服网站永久可查)
四.办理各国各大学文凭(一对一专业服务,可全程监控跟踪进度)
如果您处于以下几种情况:
◇在校期间,因各种原因未能顺利毕业……拿不到官方毕业证【q/微6496090】
◇面对父母的压力,希望尽快拿到;
◇不清楚认证流程以及材料该如何准备;
◇回国时间很长,忘记办理;
◇回国马上就要找工作,办给用人单位看;
◇企事业单位必须要求办理的
◇需要报考公务员、购买免税车、落转户口
◇申请留学生创业基金
留信网认证的作用:
1:该专业认证可证明留学生真实身份
2:同时对留学生所学专业登记给予评定
3:国家专业人才认证中心颁发入库证书
4:这个认证书并且可以归档倒地方
5:凡事获得留信网入网的信息将会逐步更新到个人身份内,将在公安局网内查询个人身份证信息后,同步读取人才网入库信息
6:个人职称评审加20分
7:个人信誉贷款加10分
8:在国家人才网主办的国家网络招聘大会中纳入资料,供国家高端企业选择人才
Game Concept Presentation for Ukrainian Mythology Based Game With Designs
The Game Concept created as a Final Project piece for college. Creative Media year 2 student
Storytelling For The Web: Integrate Storytelling in your Design Process
In this slides I explain how I have used storytelling techniques to elevate websites and brands and create memorable user experiences. You can discover practical tips as I showcase the elements of good storytelling and its applied to some examples of diverse brands/projects..
Impact of Fonts: in Web and Apps Design
Fonts play a crucial role in both User Interface (UI) and User Experience (UX) design. They affect readability, accessibility, aesthetics, and overall user perception.
Recently uploaded (20)
ARENA - Young adults in the workplace (Knight Moves).pdf
ARENA - Young adults in the workplace (Knight Moves).pdf
Can AI do good? at 'offtheCanvas' India HCI prelude
Can AI do good? at 'offtheCanvas' India HCI prelude
Between Filth and Fortune- Urban Cattle Foraging Realities by Devi S Nair, An...
Between Filth and Fortune- Urban Cattle Foraging Realities by Devi S Nair, An...
UNIT V ACTIONS AND COMMANDS, FORMS AND CONTROLS.pptx
UNIT V ACTIONS AND COMMANDS, FORMS AND CONTROLS.pptx
EASY TUTORIAL OF HOW TO USE CAPCUT BY: FEBLESS HERNANE
EASY TUTORIAL OF HOW TO USE CAPCUT BY: FEBLESS HERNANE
Game Concept Presentation for Ukrainian Mythology Based Game With Designs
Game Concept Presentation for Ukrainian Mythology Based Game With Designs
Storytelling For The Web: Integrate Storytelling in your Design Process
Storytelling For The Web: Integrate Storytelling in your Design Process
Ejercicio 3
- 1. Y/X -3 -2 -1 0 1 2 3 -3 18 13 10 9 10 13 18 -2 13 8 5 4 5 8 13 -1 10 5 2 1 2 5 10 0 9 4 1 0 1 4 9 1 10 5 2 1 2 5 10 2 13 8 5 4 5 8 13 3 18 13 10 9 10 13 18 Series1 Series3 Series5 Series7 0 5 10 15 20 1 2 3 4 5 6 7 15-20 10-15 5-10 0-5