Download to read offline
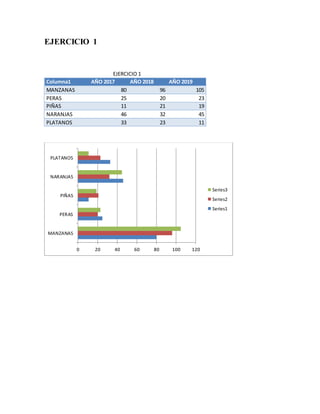
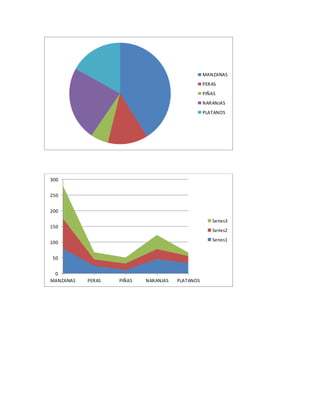
This document contains data on the production of various fruits from 2017 to 2019. It shows the number of apples, pears, pineapples, oranges, and bananas produced each year. A chart displays the yearly data for each fruit as well as two line graphs comparing production levels over the three years.


