Dokumen ini merupakan modul bagi pengurusan sekolah berasrama penuh dan sekolah kecemerlangan untuk subjek Matematik Tambahan tahun 2012. Ia mengandungi formula dan rumusan penting tentang pelbagai topik termasuk algebra, kalkulus, geometri, statistik, dan trigonometri. Terdapat juga analisis kertas peperiksaan dan soalan serta jawapan berkaitan Matematik Tambahan dari tahun 2006 hingga 2011.

![The following formulae may be helpful in answering the questions. The symbols given are the ones
commonly used.
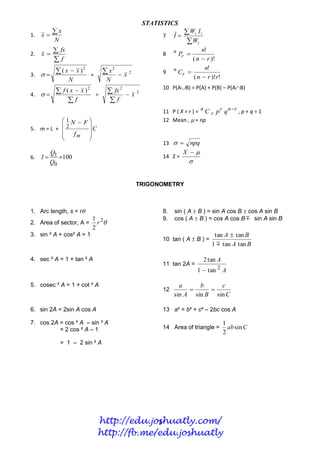
ALGEBRA
2
b b 4ac log c b
1. x = 8. log a b
2a log c a
mn 9. T n a (n 1)d
a a a
2. m n
mn
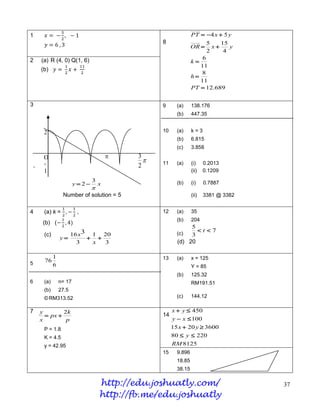
a a a n
m n
3. 10. S n [ 2a ( n 1 ) d ]
2
n
11. T n ar n 1
(a m ) a
4. mn
5. log a mn log a m log a n a ( r n 1) a (1 r n )
12. S n , r≠1
r 1 1 r
m a
6. log a log a m log a n 13. S , r <1
n 1 r
7. log a m n n log a m
CALCULUS
dy dv du 4 Area under a curve
1. y = uv, u v b
dx dx dx = a y dx or
b
= a x dy
du dv 5. Volume of revolution
v u
= a y 2 dx
u dy b
2. y = , dx dx or
v dx 2
v
= a x 2 dy
b
dy dy du
3.
dx du dx
GEOMETRY
4. Area of triangle
1. Distance = ( x2 x1 ) 2 ( y 2 y1 ) 2
1
= ( x1 y2 x2 y3 x3 y1 ) ( x2 y1 x3 y2 x1 y3 )
2
2. Mid point
5. r x2 y2
x x2 y1 y 2
(x,y)= 1 ,
2 2
3. Division of line segment by a point xi yj
6. ˆ
r
nx mx2 ny1 my2
(x,y)= 1
mn , mn
x2 y 2
http://edu.joshuatly.com/
2
http://fb.me/edu.joshuatly](https://image.slidesharecdn.com/edu-joshuatly-commodulesbpperfectscorespm2012addmaths286e5bb3-130414194727-phpapp01/85/Edu-joshuatly-com-module-sbp-perfect-score-spm-2012-add-maths-286-e5bb3-2-320.jpg)
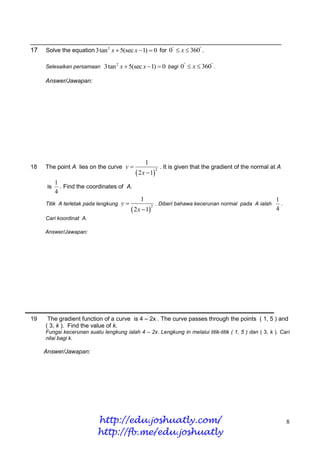
![5
20 Given that 1
g ( x)dx 8 , find
5
Diberi 1
g ( x)dx 8 , cari
1 3
(a) the value of 4 g ( x)dx
5
1 3
nilai 4 g ( x)dx
5
5
(b) the value of k if [kx g ( x)]dx 12
1
5
nilai k jika [kx g ( x)]dx 12
1
Answer/Jawapan
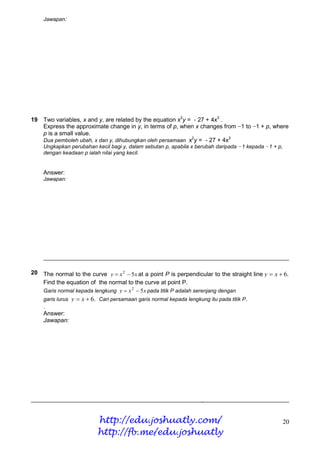
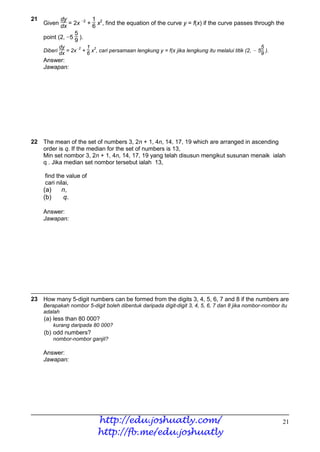
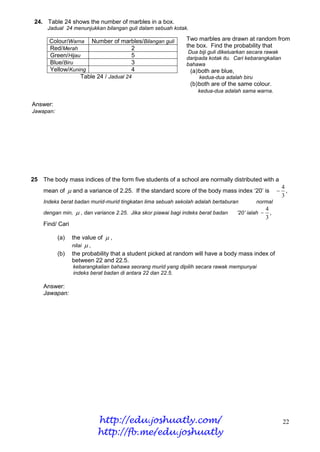
21 The mean of a set of number 16, 14, 17, a, 2a, 19 and 24 is 18.
Min bagi satu set nombor 16, 14, 17, a, 2a, 19 dan 24 ialah 18.
(a) Find the value of a and the standard deviation of the set of the numbers.
Cari nilai a dan sisihan piawai bagi set nombor itu.
(b) If each of the numbers in the set is multiplied by 6, find the variance of the new set
of the numbers.
Jika setiap nombor dalam set itu didarab dengan 6, cari varians bagi set nombor yang baru
itu.
Answer/Jawapan
http://edu.joshuatly.com/ 9
http://fb.me/edu.joshuatly](https://image.slidesharecdn.com/edu-joshuatly-commodulesbpperfectscorespm2012addmaths286e5bb3-130414194727-phpapp01/85/Edu-joshuatly-com-module-sbp-perfect-score-spm-2012-add-maths-286-e5bb3-15-320.jpg)
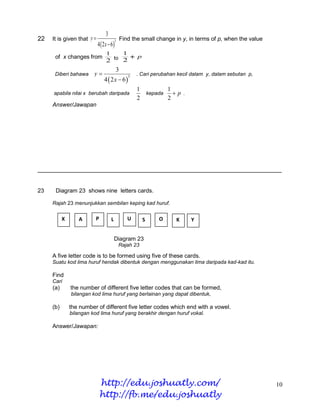
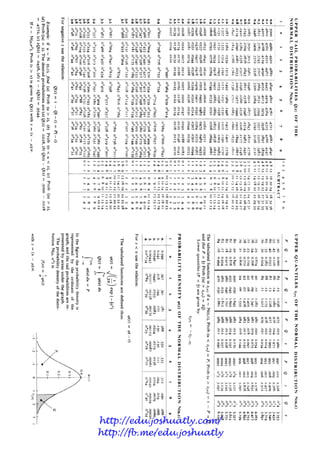
![Section A
MODEL 1 : PAPER 2 Bahagian A
[ 40 marks]
[ 40 markah]
Answer all questions
Jawab semua soalan
1 Solve the simultaneous equations :
Selesaikan persamaan serentak berikut:
2x+ y - 1= 0 , 2x2 + 5x - y + 6 = 0. [5 marks]
[5 markah]
2. Solution by scale drawing is not accepted.
Penyelesaian secara lukisan berkala tidak diterima.
In Diagram 2, the straight line PR has an equation y + 2x = 8.PR intersects the x- axis at point
R.
Dalam rajah 2, garis lurus PR mempunyai persamaan y + 2x = 8. PR menyilang paksi-x di titik R.
P (-1,10)
• y
• Q
•
O R x
Diagram 2
Rajah 2
Point Q lies on PR such that PQ:QR = 2 : 3
Titik Q terletak pada PR dengan keadaan PQ:QR = 2 : 3
Find
cari
(a) the coordinate of Q. [3 marks]
koordinat Q [3 markah]
(b) The equation of straight line that passes through point Q and perpendicular to PR.
[3 marks]
Persamaan garis lurus yang melalui Q dan berserenjang dengan PR [ 3 markah]
http://edu.joshuatly.com/ 25
http://fb.me/edu.joshuatly](https://image.slidesharecdn.com/edu-joshuatly-commodulesbpperfectscorespm2012addmaths286e5bb3-130414194727-phpapp01/85/Edu-joshuatly-com-module-sbp-perfect-score-spm-2012-add-maths-286-e5bb3-19-320.jpg)
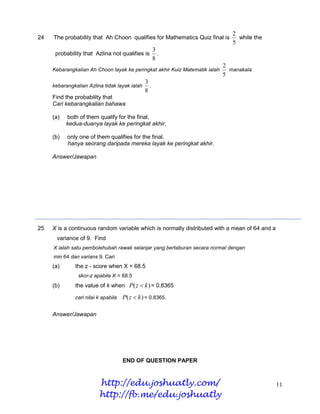
![3
3 (a) Sketch the graph of for 0 x . [4 marks]
2
3
Lakar graf bagi untuk 0 x . [4 markah]
2
(b) Hence, using the same axes, draw a suitable straight line to find the number of solution to
3x 3
the equation 3 3 cos 2 x for 0 x State the number of solutions. [3 marks]
π 2
Seterusnya dengan menggunakan paksi yang sama, lakar satu garis lurus yang sesuai untuk
3x 3
mencari bilangan penyelesaian bagi persamaan 3 3 cos 2 x untuk 0 x .Nyatakan
π 2
bilangan penyelesaian itu. [3 markah]
2 1
4 A curve with gradient function as 16 x has a turning point at (k, 4)
x2
2 1
Suatu lengkung dengan fungsi kecerunan 16 x 2 mempunyai titik pusingan di (k, 4)
x
(a) Find the values of k. [3 marks]
Cari nilai- nilai k. [3 markah]
(b) Find maximum point. [2 marks]
Carikan titik maksimum ,[2 markah]
(c) By using the answer from 4(b), find the equation of the curve. [3 marks]
Dengan menggunakan jawapan daripada 4 (b), cari persamaan lengkung itu. [3 markah]
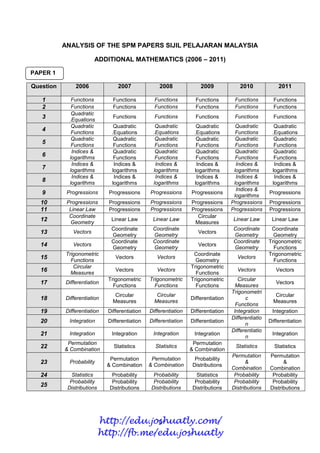
5. Table 5 shows the cumulative frequency distribution for the scores of 40 students in a
competition.
Jadual 5 menunjukkan taburan kekerapan longgokan bagi skor 40 orang murid dalam suatu
pertandingan.
Score <40 <50 <60 <70 <80 <90
skor
Number of
students 5 11 20 28 34 40
Bilangan murid
Table 5
Jadual 5
http://edu.joshuatly.com/ 26
http://fb.me/edu.joshuatly](https://image.slidesharecdn.com/edu-joshuatly-commodulesbpperfectscorespm2012addmaths286e5bb3-130414194727-phpapp01/85/Edu-joshuatly-com-module-sbp-perfect-score-spm-2012-add-maths-286-e5bb3-20-320.jpg)
![(a) Based on Table 5, copy and complete Table 5(a).
Berdasarkan jadual 5, salin dan lengkapkan jadual 2.
Score 30 – 39 40 – 49 50 – 59 60 – 69 70 – 79 80 – 89
skor
Number of students
Bilangan murid
Table 5(a)
Jadual 5(a)
[1 mark]
(b) Without drawing ogive , find the score if 80% of students are able to get into the second
round. [4 marks]
Tanpa melukis ogif, cari nilai skor jika 80% pelajar dapat masuk ke pusingan yang kedua.[4 markah]
6 A piece of bamboo cane with a length 527 cm is cut into pieces and bent the loop as shown in
Diagram 6
Sebatang rotan buluh dengan panjang 527 cm dipotong kepada beberapa bahagian dan di bengkok
menjadi gegelung seperti yang ditunjukkan dalam rajah 6
3.5cm 6.5cm
5cm
Diagram 6
Rajah 6
The radius of each loop increases by 1.5 cm consecutively.
Jejari bagi setiap ge gelung masing-masing meningkat sebanyak 1.5 cm
Calculate
Kira
(a) the number of loops [4 marks]
bilangan gegelung yang terbentuk [4 markah]
(b) the radius of the last loop. [2 marks]
Jejari gegelung yang terakhir [2 markah]
(c) If the price of the first loop is RM1.10, and the price of each loop to increase by 30% of the
previous loop, calculate the total price of all the loops. [3 marks]
Jika harga gegelung yang pertama ialah RM1.10, dan harga setiap gelung meningkat sebanyak
30% dari harga gegelung sebelumnya, hitung jumlah harga kesemua gegelung tersebut. [3 markah]
http://edu.joshuatly.com/ 27
http://fb.me/edu.joshuatly](https://image.slidesharecdn.com/edu-joshuatly-commodulesbpperfectscorespm2012addmaths286e5bb3-130414194727-phpapp01/85/Edu-joshuatly-com-module-sbp-perfect-score-spm-2012-add-maths-286-e5bb3-21-320.jpg)
![Section B
Bahagian B
[ 40 marks]
[40 markah]
Answer four questions from this section
Jawab empat soalan daripada bahagian ini
7. Use the graph paper to answer this question.
Gunakan kertas graf untuk menjawab soalan ini.
Table 7 shows the values of two variables, x and y, obtained from an experiment.
2k
The variable x and y are related by the equation y px 2 x where p and k are constants.
p
Jadual 7 menunjukkan nilai-nilai bagi dua pemboleh ubah, x dan y yang diperoleh daripada satu
2k
experiment. Pemboleh ubah x dan y dihubungkan oleh persamaan y px 2 x dengan keadaan p
p
dan k adalah pemalar
x 1 2 3 4 5 6
y 6.8 17.2 31.8 48 70 94.8
Table 7
Jadual 7
(a) Plot against x , by using a scale of 2 cm to 1 units on - axis and 2cm to 2 unit on
the –axis , Hence, draw the line of best fit. [4 marks]
Plot melawan x, dengan menggunakan skala 2 cm kepada 1 unit pada pada paksi –x dan 2 cm
kepada 2 unit pada paksi . Seterusnya, lukis garis lurus penyesuaian terbaik. [4 markah]
(b) Use the graph from 7(a) to find the value of
Gunakan graf anda di 7(a) untuk mencari nilai
(i) p
(ii) k
(iii) y when x = 3.7 [6 marks]
y apabila x = 3.7 [6 markah]
http://edu.joshuatly.com/ 28
http://fb.me/edu.joshuatly](https://image.slidesharecdn.com/edu-joshuatly-commodulesbpperfectscorespm2012addmaths286e5bb3-130414194727-phpapp01/85/Edu-joshuatly-com-module-sbp-perfect-score-spm-2012-add-maths-286-e5bb3-22-320.jpg)
![8 Diagram 8 shows triangle OTQ. The point P lies on OQ and the point R lies on QT. The straight
line OR intersects the straight line PT at the point S.
Rajah 8 menunjukkan segitiga OTQ. Titik P terletak pada OQ dan titik R terletak pada QT. Garis lurus OR
bersilang dengan garis lurus PT pada titik S.
Q
R
P
●
S T
Diagram 8
O
Rajah 8
It is given that
Diberi bahawa
OP: PQ = 2 : 3, QR : RT = 3 : 1, = 4x, = 5y
(a) Express in terms of x and/or y:
Ungkapkan dalam sebutan dan/ atau y:
(i)
(ii) [3 marks]
[3 markah]
(b) Using =h and =k , where h and k are constants, find the value of h and of k
[5 marks]
. Dengan menggunakan =h dan = k , dengan keadaad h dan k adalah pemalar, cari
nilai h dan nilai k [5 markah]
(c) Given that and OPT = 90o find [2 marks]
o
Diberi danOPT = 90 cari [2 markah]
http://edu.joshuatly.com/ 29
http://fb.me/edu.joshuatly](https://image.slidesharecdn.com/edu-joshuatly-commodulesbpperfectscorespm2012addmaths286e5bb3-130414194727-phpapp01/85/Edu-joshuatly-com-module-sbp-perfect-score-spm-2012-add-maths-286-e5bb3-23-320.jpg)
![9 Diagram 9 shows a circle with diameter OS, inscribed in a circle with centre O and radius 10
cm and a quadrilateral sector PQOR . The straight lines, PQ and PR, are tangents to the circle
at point Q and point R, respectively.
Rajah 9 menunjukkan sebuah bulatan berdiameter OS terterap di dalam bulatan berpusat O dan berjejari
10 cm dan sektor PQR berpusat P.Garis lurus PQ dan PR adalah tengent lepada bulatan masing-masing
pada titk Q dan titik R. S
O
148o
Q R
S
Diagram 9
Rajah 9
[Use/ guna = 3.142]
P
Calculate
Hitung
(a) the perimeter, in cm, of the shaded region. [5 marks]
Perimeter, dalam cm kawasan berlorek, [5 markah]
(b) the area, in cm2, of the shaded region. [5 marks]
2
Luas dalam cm , kawasan berlorek [5 markah]
http://edu.joshuatly.com/ 30
http://fb.me/edu.joshuatly](https://image.slidesharecdn.com/edu-joshuatly-commodulesbpperfectscorespm2012addmaths286e5bb3-130414194727-phpapp01/85/Edu-joshuatly-com-module-sbp-perfect-score-spm-2012-add-maths-286-e5bb3-24-320.jpg)
![10 Diagram 10 shows part of the curve, y = 3x2 -5x
2
Rajah 10 menunjukkan sebahagian daripada lengkung y = 3x -5x.
.
y
A ●
P
O x=k x
Diagram 10
Rajah 10
dy
The curve intersects the straight line x = k at point A. Given that at point A 13 .
dx
dy
Lengkung itu bersilang dengan garis lurus x = k di titik A.Diberi bahawa di titik A 13.
dx
(a) Find the value of k. [ 3 marks]
Cari nilai k. [3 markah]
(b) Hence, calculate
Seterusnya, hitung
(i) the area of the shaded region P,
Luas rantau berlorek P
(ii) The volume generated, in terms of , when the region R which is bounded by the
curve, and the x-axis, is revolved through 360° about the x-axis.
Isipadu yang dijanakan dalam sebutan , apabila rantau R yang dibatasi oleh lengkung
itu dan paksi- x dikisarkan melalui 360o pada paksi-x [7 marks]
[ 7 markah]
http://edu.joshuatly.com/ 31
http://fb.me/edu.joshuatly](https://image.slidesharecdn.com/edu-joshuatly-commodulesbpperfectscorespm2012addmaths286e5bb3-130414194727-phpapp01/85/Edu-joshuatly-com-module-sbp-perfect-score-spm-2012-add-maths-286-e5bb3-25-320.jpg)
![11 (a) In a survey carried out in a factory, it is found that 1 out of 5 workers have a life
insurance . If 10 workers from that factory are chosen at random, calculate the probability
that
Dalam satu tinjauan yang dijalankan ke atas pekerja-pekerja di sebuah kilang, didapati bahawa 1
daripada 5 pekerja mempunyai insurans hayat . Jika 10 orang pekerja daripada kilang itu dipilih
secara rawak, hitungkan kebarangkalian bahawa
(i) exactly 3 workers have insurances,
tepat 3 orang pekerja memiliki insurans hayat.
(ii) more than 3 workers have life insurances.
Lebih daripada 3 orang pekerja mempunyai insuran hayat. [5 marks]
[5 markah]
(b) A group of workers are given medical check up. The weight of a worker has a normal
distribution with a mean of 80 kg and a standard deviation of 16 kg.The weight
that is more than 120 is classified as “obesity”
Satu pemeriksaan kesihatan dijalankan ke atas sekumpulan pekerja.Berat badan seorang pekerja
adalah mengikut i taburan normal dengan min 80 kg dan sisihan piawai 16 kg.Berat badan yang
melebihi 120 kg diklasifikasikan sebagai "obesiti"
(i) A worker is chosen at random from the group.
Find the probability that the workers has a weight between 60 kg and 100 kg.
Seorang pekerja dipilih secara rawak daripada kumpulan tersebut.
Cari kebarangkalian bahawa pekerja itu mempunyai berat badan antara 60 kg dan 100 kg
(ii) It is found that 21 workers have “obesity”. Find the total number of workers in the
group.
Didapati bahawa 21 orang pekerja adalh obesiti, cari jumlah pekerja dalam kumpulan itu.
[5 marks]
[5 markah]
http://edu.joshuatly.com/ 32
http://fb.me/edu.joshuatly](https://image.slidesharecdn.com/edu-joshuatly-commodulesbpperfectscorespm2012addmaths286e5bb3-130414194727-phpapp01/85/Edu-joshuatly-com-module-sbp-perfect-score-spm-2012-add-maths-286-e5bb3-26-320.jpg)
![Section C
Bahagian C
[ 20 marks]
[20 markah]
Answer two questions from this section
Jawab dua soalan daripada bahagian ini
12 A particle moves along a straight line and passes through a fixed point O. Its displacement,s m
is given by s=t3 – 13t2 + 35t where t is the time, in seconds, after passing through O.
Suatu zarah bergerak disepanjang suatu garis lurus dan melalui satu titik tetap O. sesarannya m
.diberi oleh s=t3 – 13t2 + 35t , dengan keadaan t ialah masa, dalam saat, selepas melalui O
[Assume motion to the right is positive.]
[Anggapkan gerakkan kea rah kanan sebagai positive]
Find
Cari
(a) the initial velocity, in m s-1, [3 marks]
Halaju awal , dalam ms-1 [3 markah]
(b) the minimum velocity, in m s-1, [3 marks]
halaju minimum, dalam ms-1 [3 markah]
(c) the range of values of t during which the particle moves to the left, [ 1 marks]
Julat nilai t ketika zarah bergerak ke arah kiri. [1 markah]
(d) the distance, in m, travelled by the particle in the fifth seconds. [3 marks]
Jarak yang dilalui oleh zarah dalam saat kelima. [3 markah]
13. The Table 13 shows the prices , price indices and percentage expenditure for five types of
ingredients, A , B, C, D and E needed in production of a type of medicine.
Diagram 13 shows a pie chart which represents the relative quantities of the ingredients used.
Jadual 13 menunjukkan harga dan indeks harga bagi lima jenis bahan , A , B, C, D dan E, yang
digunakan untuk menghasilkan sejenis ubat.
Rajah 13 menunjukkan carta pai yang mewakili kuantiti relatif bagi penggunaan bahn-bahan itu.
Price (RM) per gram Price indices in the year 2007
Ingredients
Harga(RM) pergram based on the year 2005
Bahan-
Indek harga pada tahun 2007
bahan 2005 2007 berasaskan tahun 2005
A 120 150 125
B x 200 160
C 400 560 140
D 300 255 y
E 200 260 130
Table 13
Jadual 13
http://edu.joshuatly.com/ 33
http://fb.me/edu.joshuatly](https://image.slidesharecdn.com/edu-joshuatly-commodulesbpperfectscorespm2012addmaths286e5bb3-130414194727-phpapp01/85/Edu-joshuatly-com-module-sbp-perfect-score-spm-2012-add-maths-286-e5bb3-27-320.jpg)
![C
D
45o
84o B
E
121o
A
Diagram 13
Rajah 13
(a) Find the values of x and y [3 marks]
Cari nilai x dan nilai y [ 3 markah]
(b) (i) Calculate the composite index for the cost of producing the medicine in the year 2007
based on the year 2005,
Hitung indeks gubahan bagi kos penghasilan ubat itu pada tahun 2007 berasaskan
tahun 2005
(ii) Calculate the cost of producing this medicine in the year 2005 if its corresponding cost
of production in the year 2007 was RM240.
Hitungkan kos untuk menghasilkan ubat ini dalam tahun 2005 jika kos pengeluaran
yang sepadan pada tahun 2007 adalah RM240. [4 marks]
[4 markah]
(c) If the cost of all ingredients increase by 15% from the year 2007 to the year 2009. Find
the composite index for the year 2009 based on the year 2005.
Jika kos semua bahan meningkat sebanyak 15% dari tahun 2007 hingga tahun 2009. Cari indeks
gubahan bagi tahun 2009 berasaskan tahun 2005. [3 marks]
[3 markah]
http://edu.joshuatly.com/ 34
http://fb.me/edu.joshuatly](https://image.slidesharecdn.com/edu-joshuatly-commodulesbpperfectscorespm2012addmaths286e5bb3-130414194727-phpapp01/85/Edu-joshuatly-com-module-sbp-perfect-score-spm-2012-add-maths-286-e5bb3-28-320.jpg)
![14 Use graph paper to answer this question.
Gunakan kertas graf untuk menjawab soalan ini.
A factory produces two components, P and Q. In a particular day, the factory produced x pieces
of component P and y pieces of component Q. The profit from the sales of a piece of component
P is RM15 and a piece of component Q is RM20.
Sebuah kilang menghasilkan dua komponen, P dan Q. Pada satu hari tertentu, kilang itu menghasilkan x
keping komponen P dan y keping komponen Q. Keuntungan daripada penjualan sekeping komponen P
ialah RM 15 dan sekeping komponen Q ialah RM20.
The production of the components per day is based on the following constraints:
Penghasilan komponen-komponen itu dalam sehari adalah berdasarkan kekangan berikut.
I: The total number of components produced is at most 450.
Jumlah komponen yang dihasilkan adalah selebih-lebihnya 450.
II: The number of component Q must exceed the number of component P not more than 100
Bilangan komponen P mesti melebihi bilangan komponen Q tidak lebih daripada 100.
III: The minimum total profit for both components is RM3600.
Jumlah keuntungan minimum bagi kedua-dua komponen adalah RM3600.
(a) Write three inequalities, other than x 0 and y 0 , which satisfy all the above
constraints. [3 marks]
Tulis tiga ketaksamaan, selain x 0 dan y 0, yang memenuhi semua kekangan di atas.
[3 markah]
(b) Using a scale of 2 cm to 50 components on both axes, construct and shade the region R
which satisfies all of the above constraints. [3 marks]
Dengan menggunakan skala 2 cm kepada 50 komponen pada kedua-dua paksi, bina dan lorek
rantau R yang memenuhi semua kekangan di atas. [3 markah]
(c) Use your graph in 14 (b) to find
Gunakan graf anda di 14(b) untuk mencari
(i) The range of number of pieces of component Q if the number of pieces component P
produced on a particular day is 120,
Julat bilangan komponen Q jika bilangan komponen P pada satu hari tertentu ialah
120.
(ii) the maximum total profit per day.
Jumlah keuntungan maksimum dalam sehari.
[4 marks]
[4 markah]
http://edu.joshuatly.com/ 35
http://fb.me/edu.joshuatly](https://image.slidesharecdn.com/edu-joshuatly-commodulesbpperfectscorespm2012addmaths286e5bb3-130414194727-phpapp01/85/Edu-joshuatly-com-module-sbp-perfect-score-spm-2012-add-maths-286-e5bb3-29-320.jpg)
![15 Diagram 15 shows triangle ABC.
Rajah 15 menunjukkan segitiga ABC
B
7 cm
78o C
5 cm
D
3.6 cm
A
Diagram 15
Rajah 15
(a) Calculate
Hitung
(i) the length, in cm, of AB,
panjang, dalam cm, AB
(ii) ABD
(iii) Calculate the area , in cm2, of ABD.
Hitung luas, dalam cm2,bagi ABD.
(b) Point A’ lies on AB such that A’D = AD
Titik A” terletak di atas AB dengan keadaan A’D = AD.
Sketch A ‘BD.
Lakar A ‘BD.
[10 marks]
[10markah]
THE END
http://edu.joshuatly.com/ 36
http://fb.me/edu.joshuatly](https://image.slidesharecdn.com/edu-joshuatly-commodulesbpperfectscorespm2012addmaths286e5bb3-130414194727-phpapp01/85/Edu-joshuatly-com-module-sbp-perfect-score-spm-2012-add-maths-286-e5bb3-30-320.jpg)
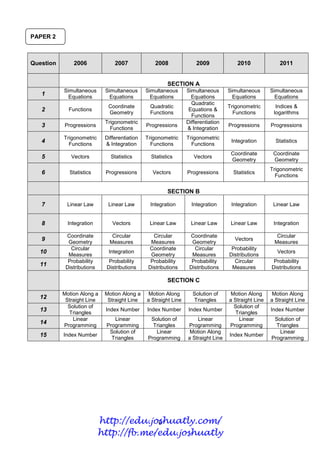
![MODEL 2 : PAPER 1 Answer All Questions
Jawab semua soalan
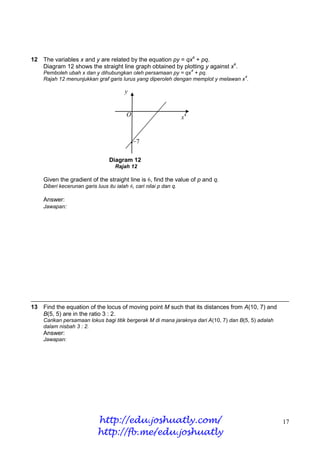
1 Diagram 1 shows part of the graph of the function f(x) = 3x2 + 1.
Rajah 1 menunjukkan sebahagian graf bagi fungsi f(x) = - 3x + 1.
2
f (x)
(0, 1)
0 x
( 1, - 2)
DIAGRAM 1
State/ Nyatakan (2, - 11)
(a) the domain,
domain
(b) the range
julat
(c) the object for 1
objek bagi 1
Answer:
Jawapan:
2 The function f is defined by f: x kx2 + p and the function g is defined by g: x 1 + 2x.
Given the composite function fg is fg : x x2 + x + 6, find the values of k and p.
2
Fungsi-fungsi f dan g ditakrifkan sebagai f: x kx + p dan g: x 1 + 2x.
2
Diberi fungsi gubahan fg : x x + x + 6, cari nilai –nilai of k and p
]
Answer:
Jawapan:
http://edu.joshuatly.com/ 13
http://fb.me/edu.joshuatly](https://image.slidesharecdn.com/edu-joshuatly-commodulesbpperfectscorespm2012addmaths286e5bb3-130414194727-phpapp01/85/Edu-joshuatly-com-module-sbp-perfect-score-spm-2012-add-maths-286-e5bb3-32-320.jpg)
![x
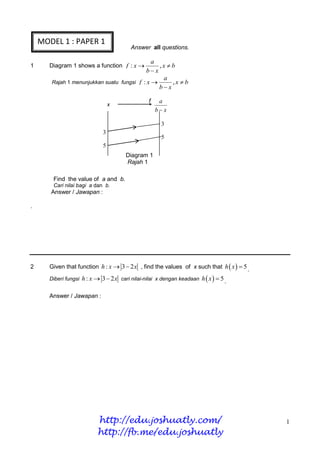
3. Given the function h( x) 5x 1 and g ( x) . Find
3
x
Diberi fungsi h( x) 5x 1 dan g ( x) . Cari
3
(a) h 1 (9)
(b) gh 1 ( x)
Answer:
Jawapan:
4 Given the quadratic equation px2 + (q + 1)x + 1 – q2 = 0, where p and q are constants, has
equal roots, express p in terms of q.
Diberi persamaan kuadratik px2 + (q + 1)x + 1 – q2 = 0, dengan keadaan p dan q ialah
pemalar mempunyai punca-punca sama, ungkapkan p dalam sebutan q.
]
Answer:
Jawapan:
5 Find the range of the values of x such that x(x − 1) ≥ 72.
Cari julat nilai x bagi x(x − 1) ≥ 72.
Answer:
Jawapan:
http://edu.joshuatly.com/ 14
http://fb.me/edu.joshuatly](https://image.slidesharecdn.com/edu-joshuatly-commodulesbpperfectscorespm2012addmaths286e5bb3-130414194727-phpapp01/85/Edu-joshuatly-com-module-sbp-perfect-score-spm-2012-add-maths-286-e5bb3-33-320.jpg)
![6 The quadratic function f(x) = − 4x2 − 8mx − 4m2 − 6, has a maximum point (−3, n), where m
and n are constant Find the value of m and the value of n
2
Fungsi kuadratik f(x) = −4(x + m) − 6, mempunyai titik maksimum (−3, n) di mana mdan n adalah
pemalar.Carikan nilai m dan nilai n
]
Answer:
Jawapan:
7 Solve the equation 9−2x + 5 = 47x.
+5 7x
Selesaikan persamaan 9−2x =4 .
Answer:
Jawapan:
8 Given log243 x = log3 2, find the value of x.
Diberi log243 x = log3 2, cari nilai x.
Answer:
Jawapan:
http://edu.joshuatly.com/ 15
http://fb.me/edu.joshuatly](https://image.slidesharecdn.com/edu-joshuatly-commodulesbpperfectscorespm2012addmaths286e5bb3-130414194727-phpapp01/85/Edu-joshuatly-com-module-sbp-perfect-score-spm-2012-add-maths-286-e5bb3-34-320.jpg)
![9 The first four terms of a geometric progression are 3888, −648, 108, x.
Find the value of x.
Empat sebutan pertama suatu janjang geometri ialah 3888, −648, 108, x.
Cari nilai x.
[3 marks]
[3 markah]
Answer:
Jawapan:
10 In a geometric progression, the first term is 648. Given that the sum to infinity of this
3
progression is 777 , find the common ratio of the geometric progression.
5
Dalam suatu janjang geometri, sebutan pertama ialah 648. Diberi hasil tambah hingga
3
ketakterhinggaan bagi janjang ini ialah 7775 , cari nisbah sepunya janjang geometri ini.
Answer:
Jawapan:
11 n
The sum of the first n terms of an arithmetic progression is given by Sn = 2 ( 3n − 1).
n
Hasil tambah n sebutan pertama bagi suatu janjang aritmetik diberi oleh Sn = 2 ( 3n − 1).
Find
Carikan
(a) the sum of the first 10 terms.
hasil tambah 10 sebutan pertama.
(b) the 10th terms.
sebutan 10th.
Answer:
Jawapan:
http://edu.joshuatly.com/ 16
http://fb.me/edu.joshuatly](https://image.slidesharecdn.com/edu-joshuatly-commodulesbpperfectscorespm2012addmaths286e5bb3-130414194727-phpapp01/85/Edu-joshuatly-com-module-sbp-perfect-score-spm-2012-add-maths-286-e5bb3-35-320.jpg)
![Section A
MODEL 2 : PAPER 2 Bahagian A
[40 marks]
[ 40 markah]
Answer all questions in this section .
Jawab semua soalan dalam bahagian ini.
1
1 Solve the simultaneous equations y 2 xy x y4
2
Give your answer correct to four significant figures. [5 marks]
1
Selesaikan persamaan serentak y 2 xy x y4 .
2
Beri jawapan anda betul kepada 4 angka bererti. [5 markah]
2 A quadratic function f is defined by f ( x) k 4 x 2 x 2 , where k is a constant.
Suatu fungsi kuadratik f ditakrifkan sebagai f ( x) k 4 x 2 x 2 , dengan keadaan k adalah pemalar.
(a) Express f(x) in the form a(x + p)2 + q, where a, p and q are constants. [2 marks]
2
Ungkapkan f(x) dalam bentuk a(x + p) + q, dengan keadaan a, p dan q adalah pemalar. [2 markah]
(b) Find the value of k if the maximum value of f(x) is 11 and state the corresponding
value of x. [3 marks]
Cari nilai k jika nilai maksimum f(x) ialah 11 dan nyatakan nilai x yang sepadan. [3 markah]
(c) Sketch the graph of the function f(x). [3 marks]
Lakar graf bagi fungsi f(x). [3 markah]
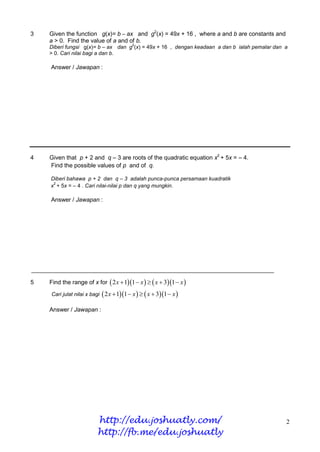
3 Diagram 3 shows part of a pattern which consist of equilateral triangles arranged in rows. The
number of triangles in the lowest row is 156. For each of the other rows, the number of triangles is
3 less than that in the row below. The height of each triangles is 8 cm. The number of triangles in
the highest row is 15.
Rajah 3 menunjukkan sebahagian dari pola yang terdiri dari segitiga sama sisi yang disusun dalam barisan.
Jumlah segitiga di barisan terendah adalah 156. Bagi setiap baris yang berikutnya, jumlah segitiga
berkurangan sebanyak 3. Ketinggian masing-masing segitiga adalah 8 cm. Jumlah segitiga di barisan
tertinggi adalah 15.
http://edu.joshuatly.com/ 38
http://fb.me/edu.joshuatly](https://image.slidesharecdn.com/edu-joshuatly-commodulesbpperfectscorespm2012addmaths286e5bb3-130414194727-phpapp01/85/Edu-joshuatly-com-module-sbp-perfect-score-spm-2012-add-maths-286-e5bb3-44-320.jpg)
![Calculate
Hitung
(a) the height of the pattern in cm. [3 marks]
ketinggian pola, dalam cm. [3 markah]
(b) the total number of triangles used to build the pattern. [2 marks]
jumlah bilangan segitiga yang digunakan untuk membentuk pola. [2 markah]
sin 2
4 (a) Prove that 1 cos [2 marks]
1 cos
sin 2
Buktikan 1 cos [2 markah]
1 cos
(b) (i) Sketch the graph of y = 1 cos x for 0 x 2 . [3 marks]
Lakarkan graf y = 1 cos x bagi 0 x 2 [3 markah]
(ii) Hence, using the same axes, sketch a suitable straight line to find the number
sin 2 x
of solutions for the equation 0 for 0 x 2 .
1 cos 2
State the number of solutions. [3 marks]
Seterusnya, gunakan paksi yang sama, lakarkan garislurus yang sesuai untuk mencari bilangan
sin 2 x
penyelesaian persamaan 0 bagi 0 x 2 .
1 cos 2
Nyatakan bilangan penyelesaian. [3 markah]
5 Table 5 shows the cumulative frequency distribution of the mass of a group of children.
Jadual 5 menunjukkan taburan kekerapan longgokan jisim bagi sekumpulan kanak-kanak .
Mass(kg)
16 19 22 25 28
Jisim (kg)
Cumulative Frequency
6 16 28 36 40
Kekerapan longgokan
Table 1/ Jadual 1
(a) Without drawing an ogive, determine the median of the distribution, [4 marks]
Tanpa melukis ogif, cari median bagi taburan itu [4 markah]
(b) Calculate the standard deviation of the mass. [3 marks]
Hitung sisihan piwai bagi berat itu [3 markah]
http://edu.joshuatly.com/ 39
http://fb.me/edu.joshuatly](https://image.slidesharecdn.com/edu-joshuatly-commodulesbpperfectscorespm2012addmaths286e5bb3-130414194727-phpapp01/85/Edu-joshuatly-com-module-sbp-perfect-score-spm-2012-add-maths-286-e5bb3-45-320.jpg)
![6 Diagram 6 shows a triangle OPQ . Point F lies on the straight line OQ and point E lies
on the straight line PQ. The straight line OE intersects the straight line PF at the point G.
Rajah 6 menunjukkan segitiga OPQ.Titk F terletak pada garis lurus OQ dan titik E terletak pada
garis lurus PQ . Garis lurus OE bersilang dengan garis lurus PF pada titik G.
P
E
G
O Q
F
Diagram 6
Rajah 6
1
PE 1
It is given that OP 3 x , OQ 6 y , OF OQ and
2
EQ 2
1 PE 1
Diberi bahawa OP 3 x , OQ 6 y , OF OQ dan
2 EQ 2
(a) Express in terms of x and / or y :
Ungkapkan dalam sebutan x dan / atau y :
(i) OF ,
(ii) OE .
[3 marks]
[3 markah]
(b) Given that OG h OE and PG k PF , where h and k are constants,find the value of h
and of k
Diberi bahawa OG h OE dan PG k PF , dengan keadaan h dan k ialah pemalar, cari nilai h
dan nilai k
[4 marks]
[4 markah]
http://edu.joshuatly.com/ 40
http://fb.me/edu.joshuatly](https://image.slidesharecdn.com/edu-joshuatly-commodulesbpperfectscorespm2012addmaths286e5bb3-130414194727-phpapp01/85/Edu-joshuatly-com-module-sbp-perfect-score-spm-2012-add-maths-286-e5bb3-46-320.jpg)
![Section B
Bahagian B
[40 marks]
[ 40 markah]
Answer four questions from this section.
Jawab empat soalan dalam bahagian ini
7 Diagram 7 shows the curve y 4 x 4 intersects with the straight line x = 3 at the point B
and AB is parallel to the x-axis.
Rajah 7 menunjukkan lengkung y 4 x 4 bersilang dengan garis lurus x = 3 pada titik B dan
garis lurus AB adalah selari dengan paksi-x.
y x=3
y 4x 4
A B
y = 4x + 4
P
Q
x
0
Diagram 7
Rajah 7
(a) Find the coordinates of A and B. [ 3 marks]
Cari koordinat bagi titik A dan B . [3 markah]
(b) Find the area of the shaded region P. [ 4 marks]
Cari luas rantau berlorek P. [4 markah]
(c) Calculate the volume generated, in terms of , when the shaded area Q is revolved 360o
about the x-axis. [3 marks]
Hitung isipadu janaan, dalam sebutan ,apabila rantau berlorek Q dikisarkan melalui 360
pada paksi-x [3 markah]
http://edu.joshuatly.com/ 41
http://fb.me/edu.joshuatly](https://image.slidesharecdn.com/edu-joshuatly-commodulesbpperfectscorespm2012addmaths286e5bb3-130414194727-phpapp01/85/Edu-joshuatly-com-module-sbp-perfect-score-spm-2012-add-maths-286-e5bb3-47-320.jpg)
![8 Use graph paper to answer this question.
Gunakan kertas graf untuk menjawab soalan ini.
Table 8 shows the values of two variables, x and y obtained from an experiment. Variables x
and y are related by the equation y k p , where p and k are constants.
x
Jadual 8 menunjukkan nilai-nilai bagi dua pembolehubah x dan y, yang diperoleh daripada satu
eksperimen. Pembolehubah x dan y dihubungkan oleh persamaan y k x p , di mana p dan k
adalah pemalar.
x 1.0 1.5 2.0 2.5 3.0 3.5
y 31.62 16.60 9.55 4.57 2.19 1.26
Table 8
Jadual 8
(a) Based on the table, construct a table for the value of log10 y [1 marks]
Berdasarkan jadual, bina satu jadual bagi nilai-nilai log10 y [1 markah]
(b) Plot log10 y against x using a scale of 2 cm to 0.5 unit on the x-axis and 2 cm to 0.2 unit
on the log y –axis. Hence, draw the the of best fit. [3 marks]
Plot log10 y melawan x dengan menggunakan skala 2cm kepada 0.5 unit pada paksi-x dan 2 cm
kepada 0.2 unit pada paksi-log y. Seterusnya, lukis garis penyuaian terbaik. [3 markah]
(c) Use the graph in 8 (b) to find the value of
Gunakan graf di 8 b) untuk mencari nilai
(i) p,
(ii) k,
(iii) y when x = 0.3
y apabila x = 0.3 [6 marks]
[6 markah]
http://edu.joshuatly.com/ 42
http://fb.me/edu.joshuatly](https://image.slidesharecdn.com/edu-joshuatly-commodulesbpperfectscorespm2012addmaths286e5bb3-130414194727-phpapp01/85/Edu-joshuatly-com-module-sbp-perfect-score-spm-2012-add-maths-286-e5bb3-48-320.jpg)
![9 Diagram 9 shows two circles with centres P and Q intersect at point A and B. At the points of
intersection, the radius of one circle is perpendicular to the radius of the other.
Rajah 9 menunjukkan dua bulatan berpusat P dan Q yang bersilang di titik A dan B. Pada titik-titik
persilangan itu, jejari sebuah bulatan adalah berserenjang dengan jejari bulatan yang satu lagi.
A
P Q
B
Diagram 9
Rajah 9
It is given that PA = 8 cm and PQ = 10 cm. Find
Diberi bahawa PA = 8 cm dan PQ = 10 cm. Cari
[ Use / Guna π = 3.142 ]
(a) APB in radians, [2 marks]
APB dalam radian, [2 markah]
(b) the perimeter, in cm, of the shaded region, [4 marks]
perimeter, dalam cm, rantau berlorek , [4 markah]
(c) the area, in cm2 , of the shaded region. [4 marks]
2
luas, dalam cm , rantau berlorek. [4 markah]
http://edu.joshuatly.com/ 43
http://fb.me/edu.joshuatly](https://image.slidesharecdn.com/edu-joshuatly-commodulesbpperfectscorespm2012addmaths286e5bb3-130414194727-phpapp01/85/Edu-joshuatly-com-module-sbp-perfect-score-spm-2012-add-maths-286-e5bb3-49-320.jpg)
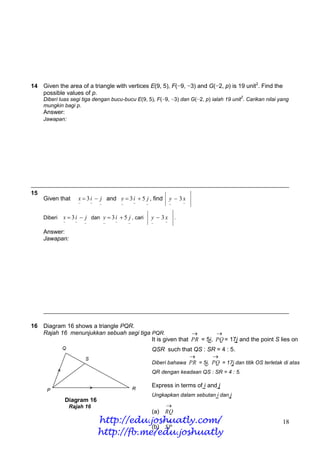
![10 Diagram 10 shows a rhombus PQRS with its sides PS and QR parallel to the y-axis.
The diagonals PR and QS intersect at point N (4,1 ).
Rajah 10 menunjukkan sebuah rombus PQRS dengan keadaan sisi PS dan QR selari dengan paksi-y.
Pepenjuru-pepenjuru PR dan QS bersilang di titik N (4,1).
y
R
S
N (4,1)
x
Q (6,0)
P (2,−3)
Diagram 10
Rajah 10
Find
Cari
(a) the coordinates of vertices S and R, [3 marks]
koordinat bucu S dan R, [3 markah]
(b) the area of the rhombus, [2 marks]
luas rombus itu, [2 markah]
(c) the equation of the locus of a point that moves such that its distance from P is 45 unit
[2 marks]
persamaan lokus bagi satu titik bergerak supaya jaraknya dari titik P ialah 45 unit. [2 markah]
(d) the ratio EQ : QF, where E and F are the points of intersection between the locus and the
x-axis. [3 marks]
nisbah EQ : QF, dimana E dan F ialah titik-titik persilangan lokus itu dengan paksi-x. [3 markah]
http://edu.joshuatly.com/ 44
http://fb.me/edu.joshuatly](https://image.slidesharecdn.com/edu-joshuatly-commodulesbpperfectscorespm2012addmaths286e5bb3-130414194727-phpapp01/85/Edu-joshuatly-com-module-sbp-perfect-score-spm-2012-add-maths-286-e5bb3-50-320.jpg)
![11 (a) Given that 70% of students from a class passed their Additional Mathematics test. A sample
of 10 students is taken at random from the class.
Diberi 70% daripada pelajar di sebuah kelas lulus ujian Matematik Tambahan. Satu sampel yang
terdiri daripada 10 pelajar diambil secara rawak dari kelas itu.
(i) Find the probability that at most 8 students passed the test.
Cari kebarangkalian bahawa selebih-lebihnya 8 pelajar lulus dalam ujian itu.
(ii) If the variance of the student passed is 6.72, find the total number of students in the
class.
Jika varians bagi pelajar yang lulus ialah 6.72, cari jumlah pelajar dalam kelas itu. [5 mark]
[5 markah]
(b) The mass of packets of fish cracker produced by a factory is normally distributed with a
mean of 200 g and a variance of 20.25.
Jisim bungkusan-bungkusan keropok ikan yang dihasilkan dari sebuah kilag bertabur secara normal
dengan min 200 g dan varian 20.25
(i) Find the probability that a packet of fish cracker chosen at random has a mass between
198 g and 204 g.
Cari kebarangkalian bahawa sebungkus keropok ikan yang dipilih secara rawak mempunyai
jisim antara 198 g dan 204 g.
(ii) It is found that from the total number of packets produced in a day, 6 packets of fish
cracker have mass greater than 210 g. Find the total number of packets of fish
cracker produced in a day.
Didapati bahawa daripada jumlah bungkusan yang dihasilkan dalam satu hari, 6 bungkus
keropok ikan mempunyai jisim lebih besar daripada 210 g. cari jumlah bilangan bungkusan
keropok ikan yang dihasilkan dalam satu hari.
[5 marks]
[5 markah]
http://edu.joshuatly.com/ 45
http://fb.me/edu.joshuatly](https://image.slidesharecdn.com/edu-joshuatly-commodulesbpperfectscorespm2012addmaths286e5bb3-130414194727-phpapp01/85/Edu-joshuatly-com-module-sbp-perfect-score-spm-2012-add-maths-286-e5bb3-51-320.jpg)
![Section C
Bahagian C
[20 marks]
[ 20 markah]
Answer two questions from this section.
Jawab dua soalan dalam bahagian ini
12 A particle moves along a straight line and passes through a fixed point O. Its velocity, v m s−1, is
given by v p t 2 qt 8 , where p and q are constants, and t is the time, in seconds, after
passing through O. When t = 3 s, the acceleration of the particle is − 8 m s−2. and its velocity is
−7 m s−1.
Suatu zarah bergerak di sepanjang suatu garis lurus dan melalui satu titik tetap 0.
Halajunya, v m s , diberi oleh v p t qt 8 , dengan keadaan p dan q adalah pemalar, dan t ialah
−1 2
−2
masa, dalam saat, selepas melalui O. Pada ketika t = 3 s,zarah bergerak dengan pecutan − 8 m s dan
−1
halajunya ialah −7 m s .
[Assume motion to the right is positive.]
[Anggapkan gerakan ke arah kanan sebagai positif]
Find
Cari
(a) the value of p and of q. [5 marks]
nilai p dan nilai q. [5 markah]
(b) the time when the particle reverse its direction, [2 marks]
masa ketika zarah itu bertukar arah gerakan. [2 markah]
(c) the total distance, in m, travelled by the particle in the first 2 seconds. [3 marks]
jumlah jarak, dalam m, yang dilalui oleh zarah itu dalam 2 saat pertama. [3 markah]
http://edu.joshuatly.com/ 46
http://fb.me/edu.joshuatly](https://image.slidesharecdn.com/edu-joshuatly-commodulesbpperfectscorespm2012addmaths286e5bb3-130414194727-phpapp01/85/Edu-joshuatly-com-module-sbp-perfect-score-spm-2012-add-maths-286-e5bb3-52-320.jpg)
![13 Table 13 shows the price indices and weightages for four ingredients , P,Q,R and S , used in
making biscuits.
Jadual 13 menunjukkan indeks harga dan pemberat bagi empat bahan, P,Q,R dan S yang digunakan
untuk membuat biskut.
Price Index in the year 2008
Ingredient based on the year 2004 Weightage
Bahan Indeks harga pada tahun 2008 Pemberat
berasaskan tahun 2004
P 110 2
Q 130 h
R 105 k
S 120 1
Table 13
Jadual 13
(a) Given that total weightage is 10 and the composite index in the year 2008 based on the
year 2004 is 117.5. Calculate the values of h and k. [5 marks]
Diberi jumlah pemberat ialah 10 dan indeks gubahan dalam tahun 2008 berasaskan tahun 2004 ialah
117.5. Hitung nilai-nilai bagi h dan k. [5 markah]
(b) The price index of each ingredient increases by 15% from the year 2008 to the year 2010.
Index harga bagi setiap bahan meningkat 15% dari tahun 2008 ke tahun 2010
Calculate
Hitung
(i) the price index of each ingredient in the year 2010 using 2004 as the base year.
Indeks harga bagi setiap bahan dalam tahun 2010 menggunakan 2004 sebagai tahun asas.
(ii) the composite index in the year 2010 using 2004 as the base year.
Indeks gubahan dalam tahun 2010 menggunakan 2004 sebagai tahun asas.
[5 marks]
[5 markah]
http://edu.joshuatly.com/ 47
http://fb.me/edu.joshuatly](https://image.slidesharecdn.com/edu-joshuatly-commodulesbpperfectscorespm2012addmaths286e5bb3-130414194727-phpapp01/85/Edu-joshuatly-com-module-sbp-perfect-score-spm-2012-add-maths-286-e5bb3-53-320.jpg)
![14 Solution by scale drawing will not be accepted.
Penyelesaian secara lukisan berskala tidak diterima
Diagram 14 shows triangles ABE and CDE.
B
20 cm C
D
10 cm
o
30 E
A Diagram 14
Rajah 14
It is given that BAE = 30o , AB = 20 cm, DE = 10 cm, , AE = BE and AED is a straight line.
Diberi bahawa BAE = 30 , AB = 20 cm, DE = 10 cm, , AE = BE dan AED ialah garis lurus.
o
(a) Find the length, in cm, of AE. [2 marks]
Cari panjang , dalam cm bagi AE [2 markah]
(b) The area of triangle ABE is twice the area of triangle CDE.
Luas segi tiga ABE adalah dua kali luas segi tiga CDE.
Calculate the length, in cm, of
Hitung panjang, dalam cm, bagi
(i) CE.
(ii) CD
[5 marks]
[5 markah]
(c) (i) Calculate CDE.
Hitung CDE.
(ii) Sketch and label triangle CDF which has a different shape from triangle CDE,
such that CF = CE and CDF = CDE.
Lakar dan label segi tiga CDF yang mempunyai bentuk yang berlainan daripada segi tiga
CDE dengan keadaan CF = CE and CDF = CDE.
[3 marks]
[3 markah]
http://edu.joshuatly.com/ 48
http://fb.me/edu.joshuatly](https://image.slidesharecdn.com/edu-joshuatly-commodulesbpperfectscorespm2012addmaths286e5bb3-130414194727-phpapp01/85/Edu-joshuatly-com-module-sbp-perfect-score-spm-2012-add-maths-286-e5bb3-54-320.jpg)
![15 Pn Julia sells two models of calculators, P and Q. In one month she sells x number of model P
calculators and y number of model Q calculators based on the following constraints:
Pn Julia menjual dua jenis model kalkulator, P dan Q. Dalam suatu bulan tertentu, dia menjual x buah
kalkulator model P dan y buah kalkulator model Q, berdasarkan kekangan berikut:
I : Pn Julia must sell at least 100 model P calculators.
Pn Julia mesti menjual sekurang-kurangnya 100 buah kalkulator model P
II : Pn Julia must sell model Q at least twice the number of model P calculators.
Pn Julia mesti menjual kalkulator model Q sekurang-kurangnya dua kali bilangan kalkulator
model P.
III : The total number of calculators cannot exceed 600.
Jumlah bilangan kalkulator yang dijual tidak boleh melebihi 600.
(a) Write three inequalities, other than x ≥ 0 and y ≥ 0, which satisfy all the above constrainsts.
[3 marks]
Tulis tiga ketaksamaan selain daripada x ≥ 0 dan y ≥ 0, yang memenuhi semua kekangan di atas.
[3 markah]
(b) Using a scale of 2 cm to 100 units of calculators on both axes, construct and shade the
region R which satisfies all the above constraints. [3 marks]
Dengan menggunakan skala 2 cm kepada 100 unit pada kedua-dua paksi, bina dan lorek rantai R
yang memuaskan semua kekangan di atas. [3 markah]
(c) Using the graph constructed in 15 (b), find
Guna graf yang dibina di 15(b), cari
(i) the maximum and the minimum numbers of model Q calculators can be
sold if the numbers of model P is 150.
bilangan maksimum dan minimum kalkulator model Q yang boleh dijual jika bilangan
kalkuator model P yang dijual ialah 150
(ii) the maximum profit obtained by the book seller if the profit for the calculator
model P is RM4 and the model Q is RM6.
keuntungan maksimum yang diperoleh penjual buku itu jika keuntungan sebuah kalkulator
model P ialah RM4 dan model Q ialah RM6.
[4 marks]
[4 markah]
http://edu.joshuatly.com/ 49
http://fb.me/edu.joshuatly](https://image.slidesharecdn.com/edu-joshuatly-commodulesbpperfectscorespm2012addmaths286e5bb3-130414194727-phpapp01/85/Edu-joshuatly-com-module-sbp-perfect-score-spm-2012-add-maths-286-e5bb3-55-320.jpg)


![Spm 2014 add math modul sbp super score post test [lemah] k2 set 5 dan skema](https://cdn.slidesharecdn.com/ss_thumbnails/spm2014addmathmodulsbpsuperscoreposttestlemahk2set5danskema-141015073522-conversion-gate02-thumbnail.jpg?width=640&height=640&fit=bounds)


![Spm 2014 add math modul sbp super score post test [lemah] k1 set 5 dan skema](https://cdn.slidesharecdn.com/ss_thumbnails/spm2014addmathmodulsbpsuperscoreposttestlemahk1set5danskema-141015073522-conversion-gate02-thumbnail.jpg?width=640&height=640&fit=bounds)
