Download to read offline

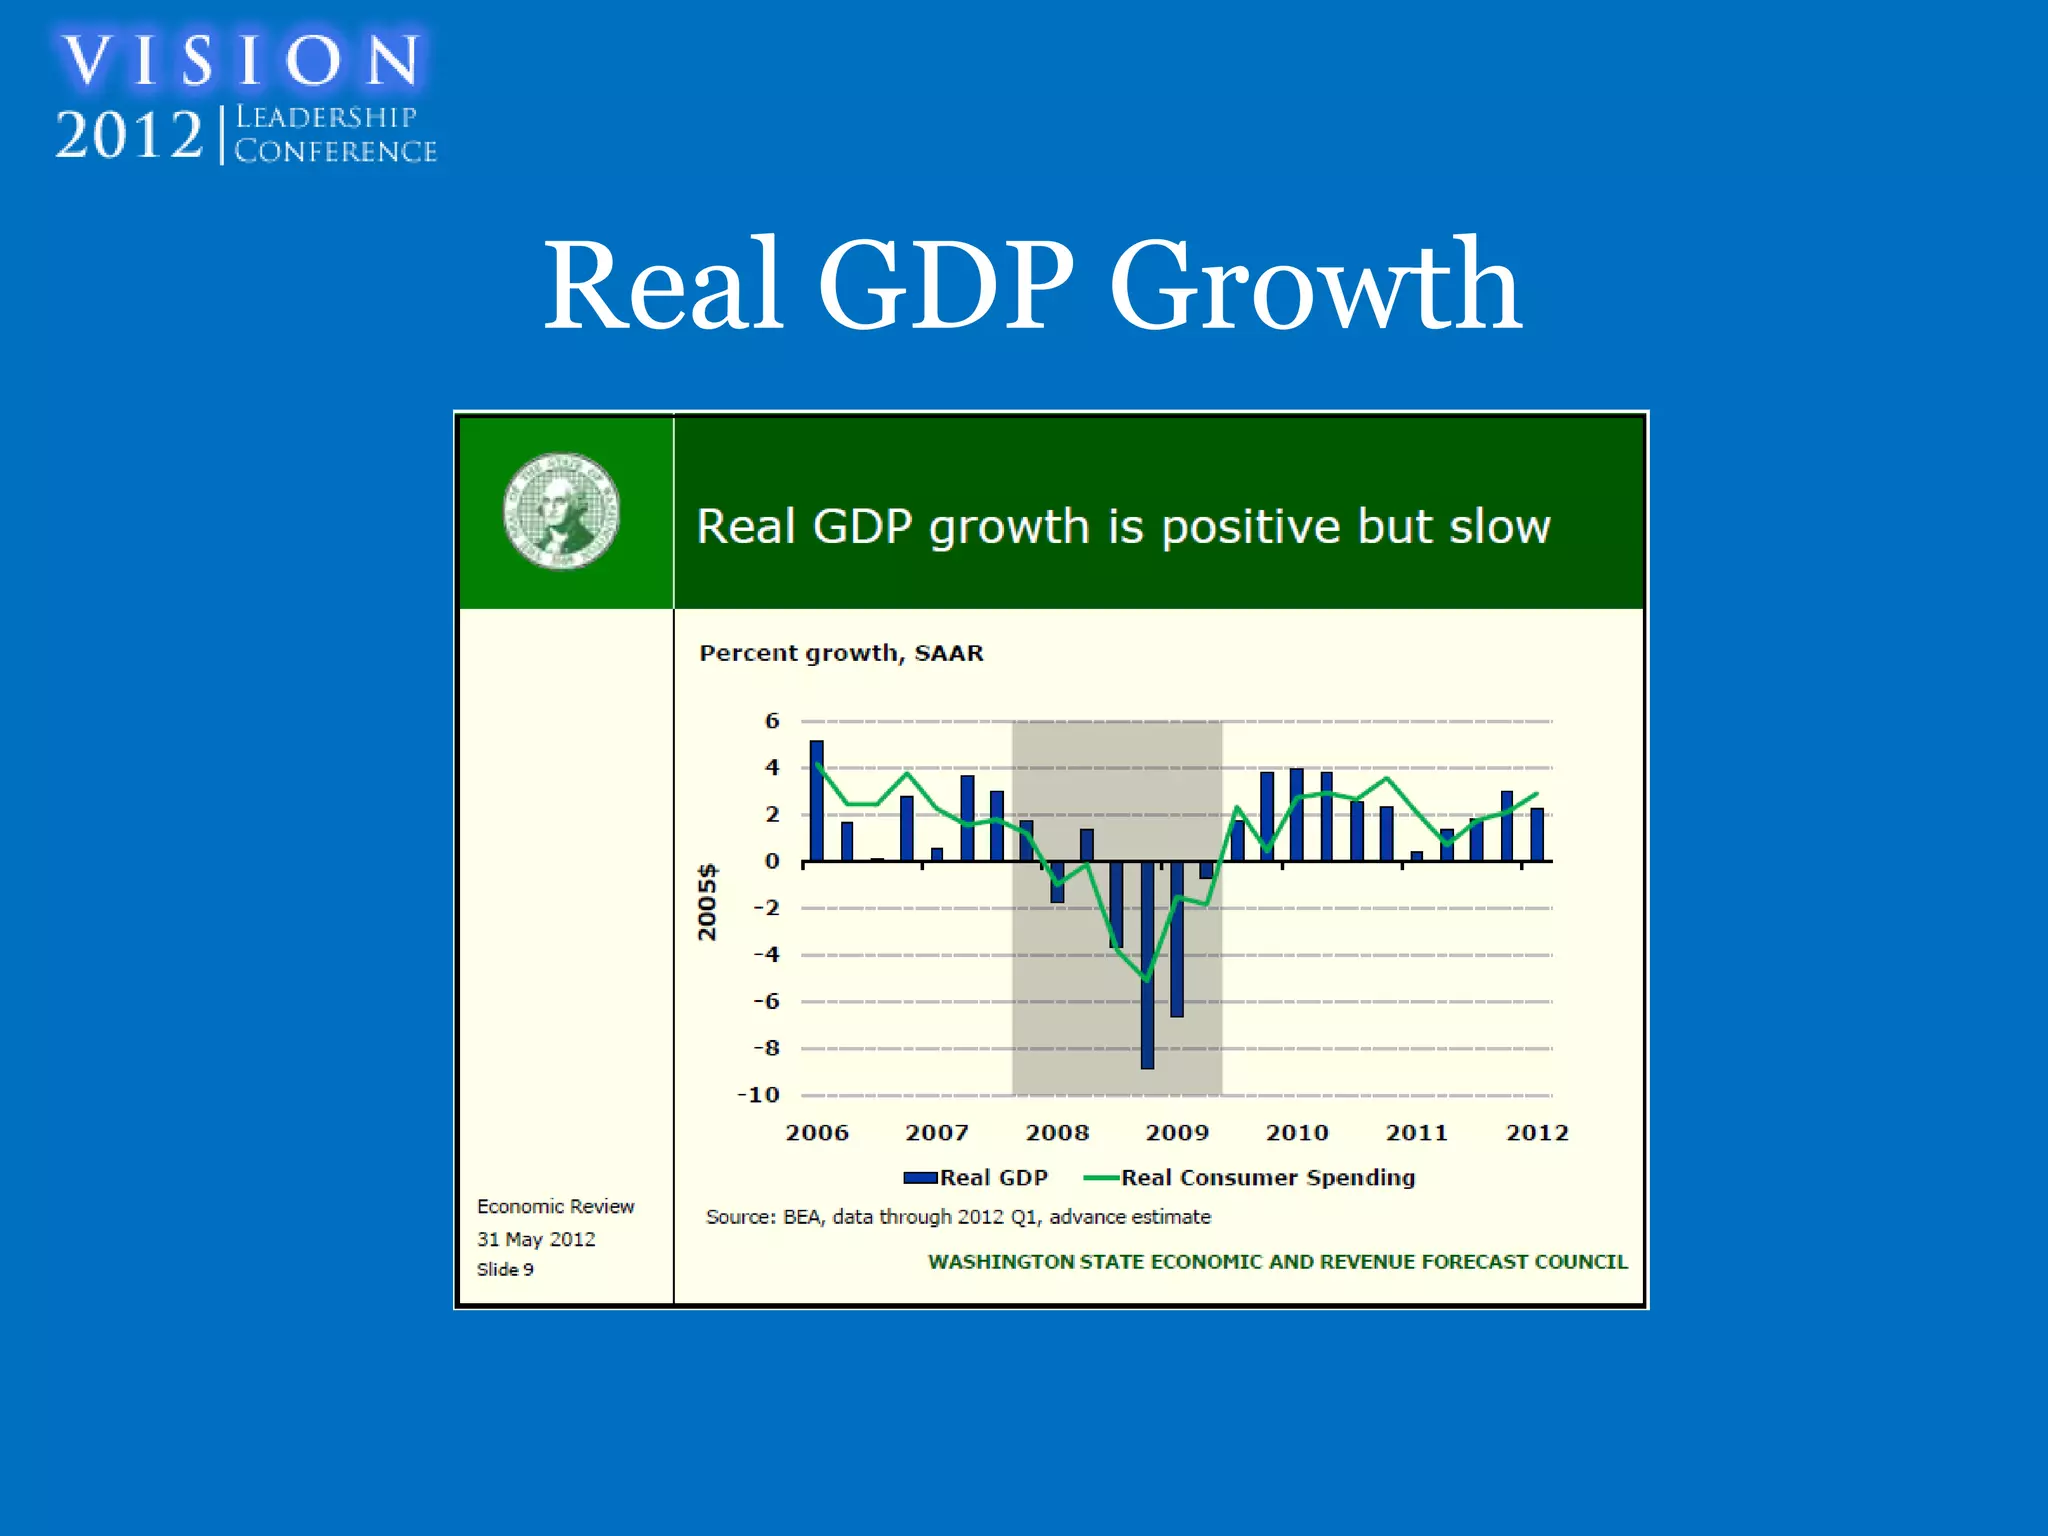
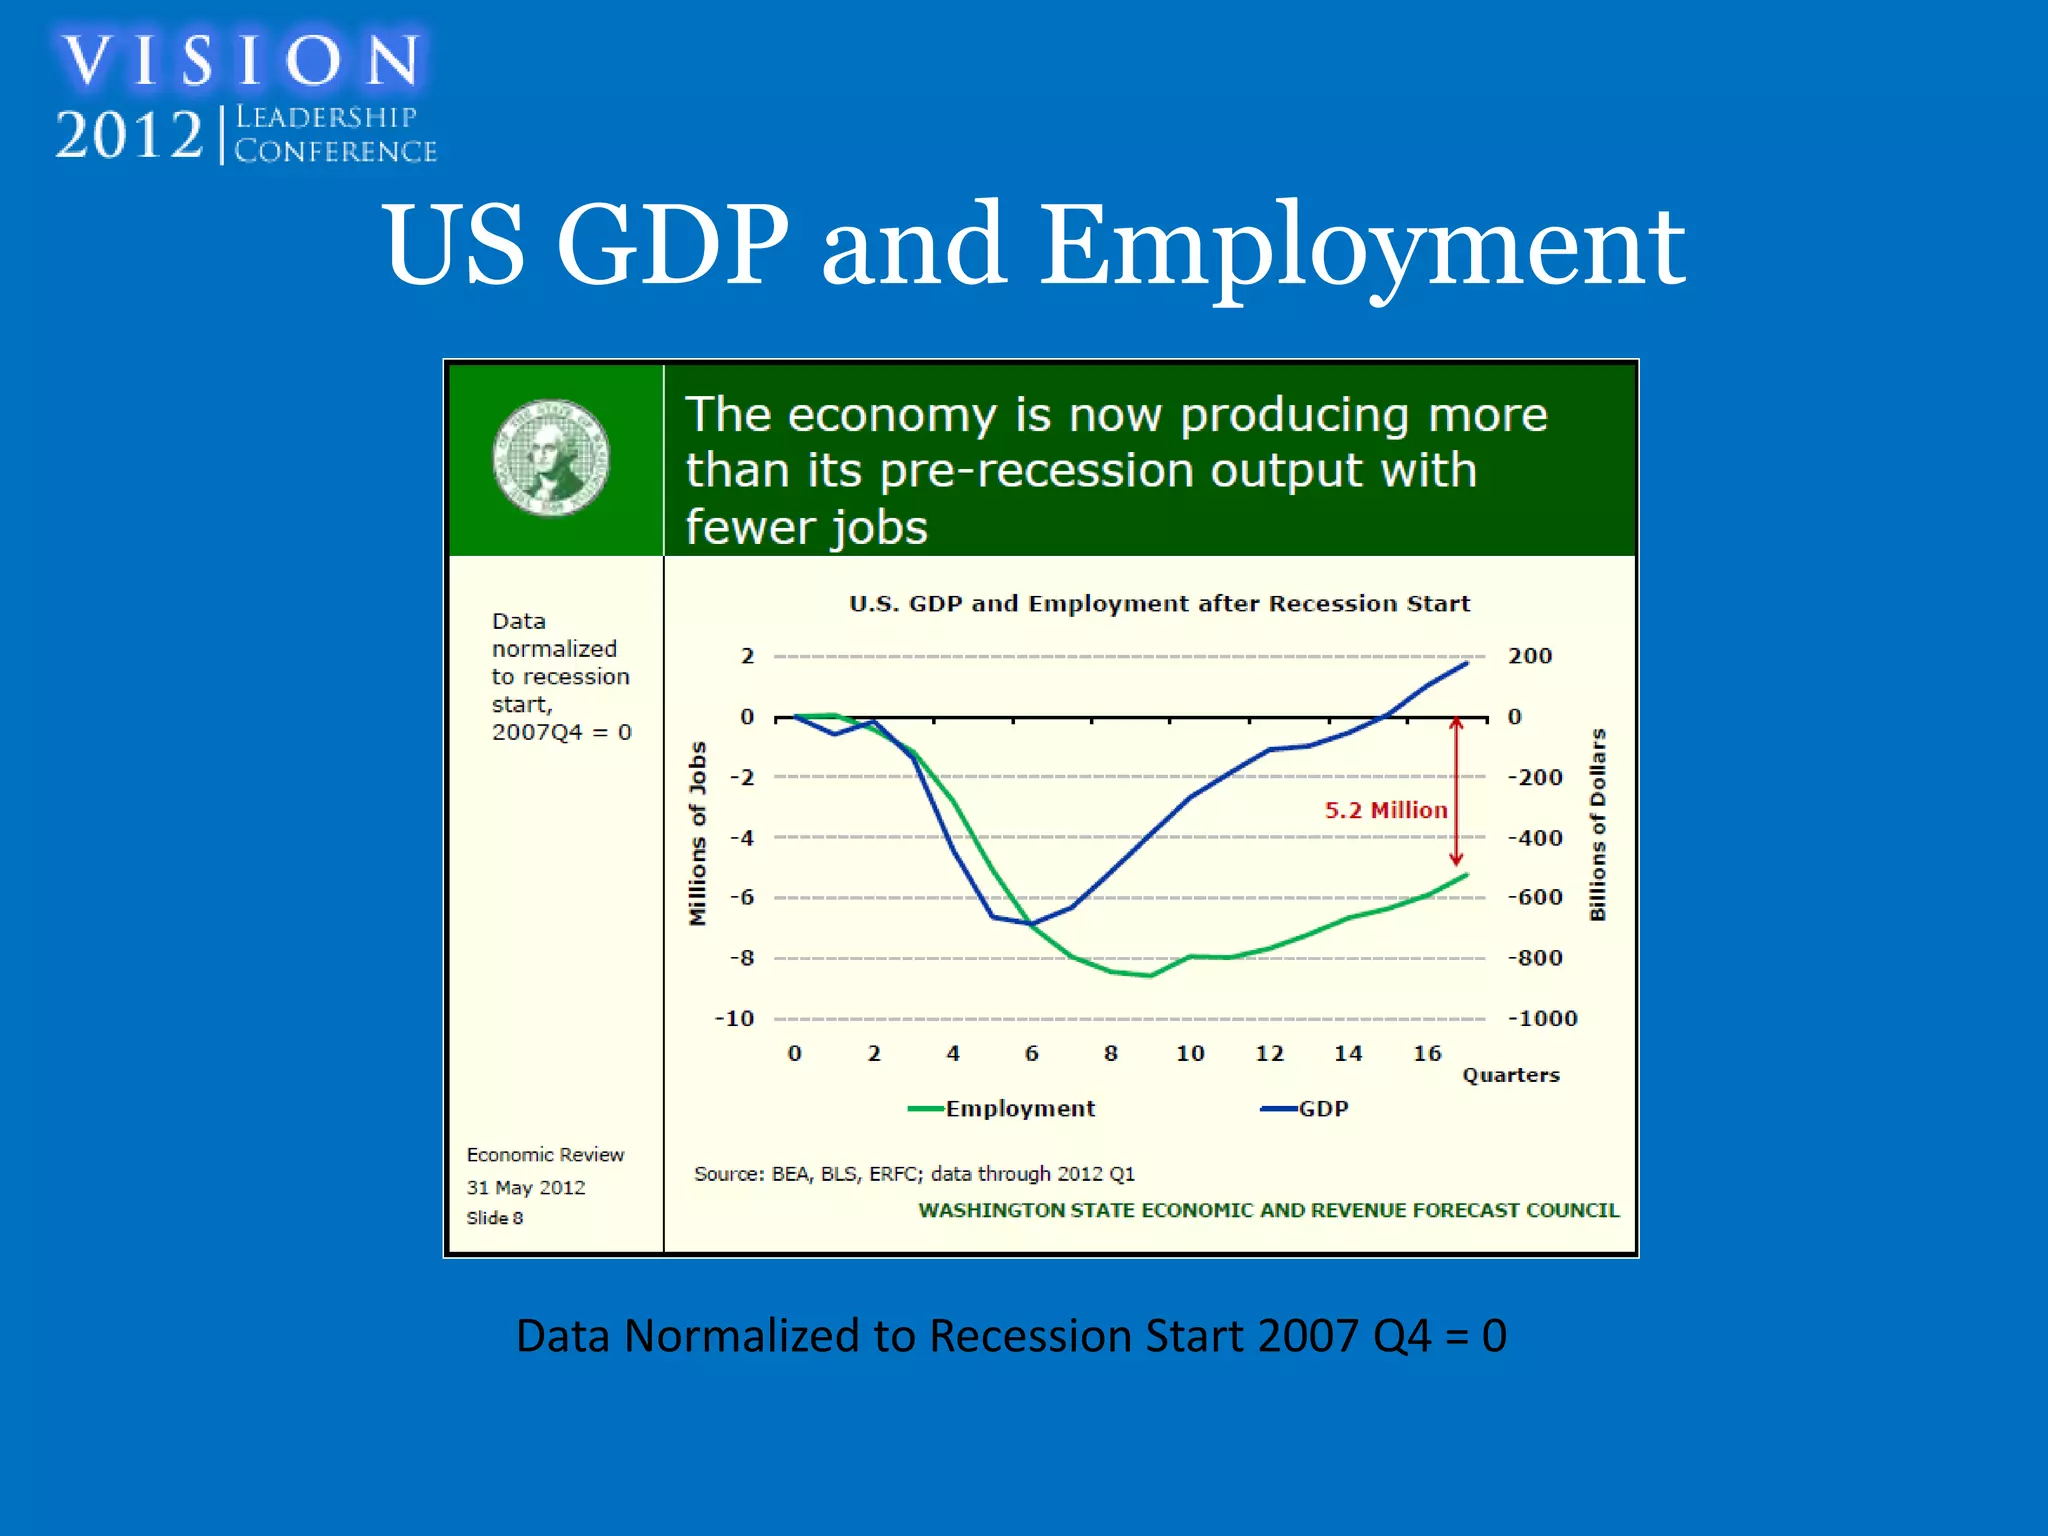
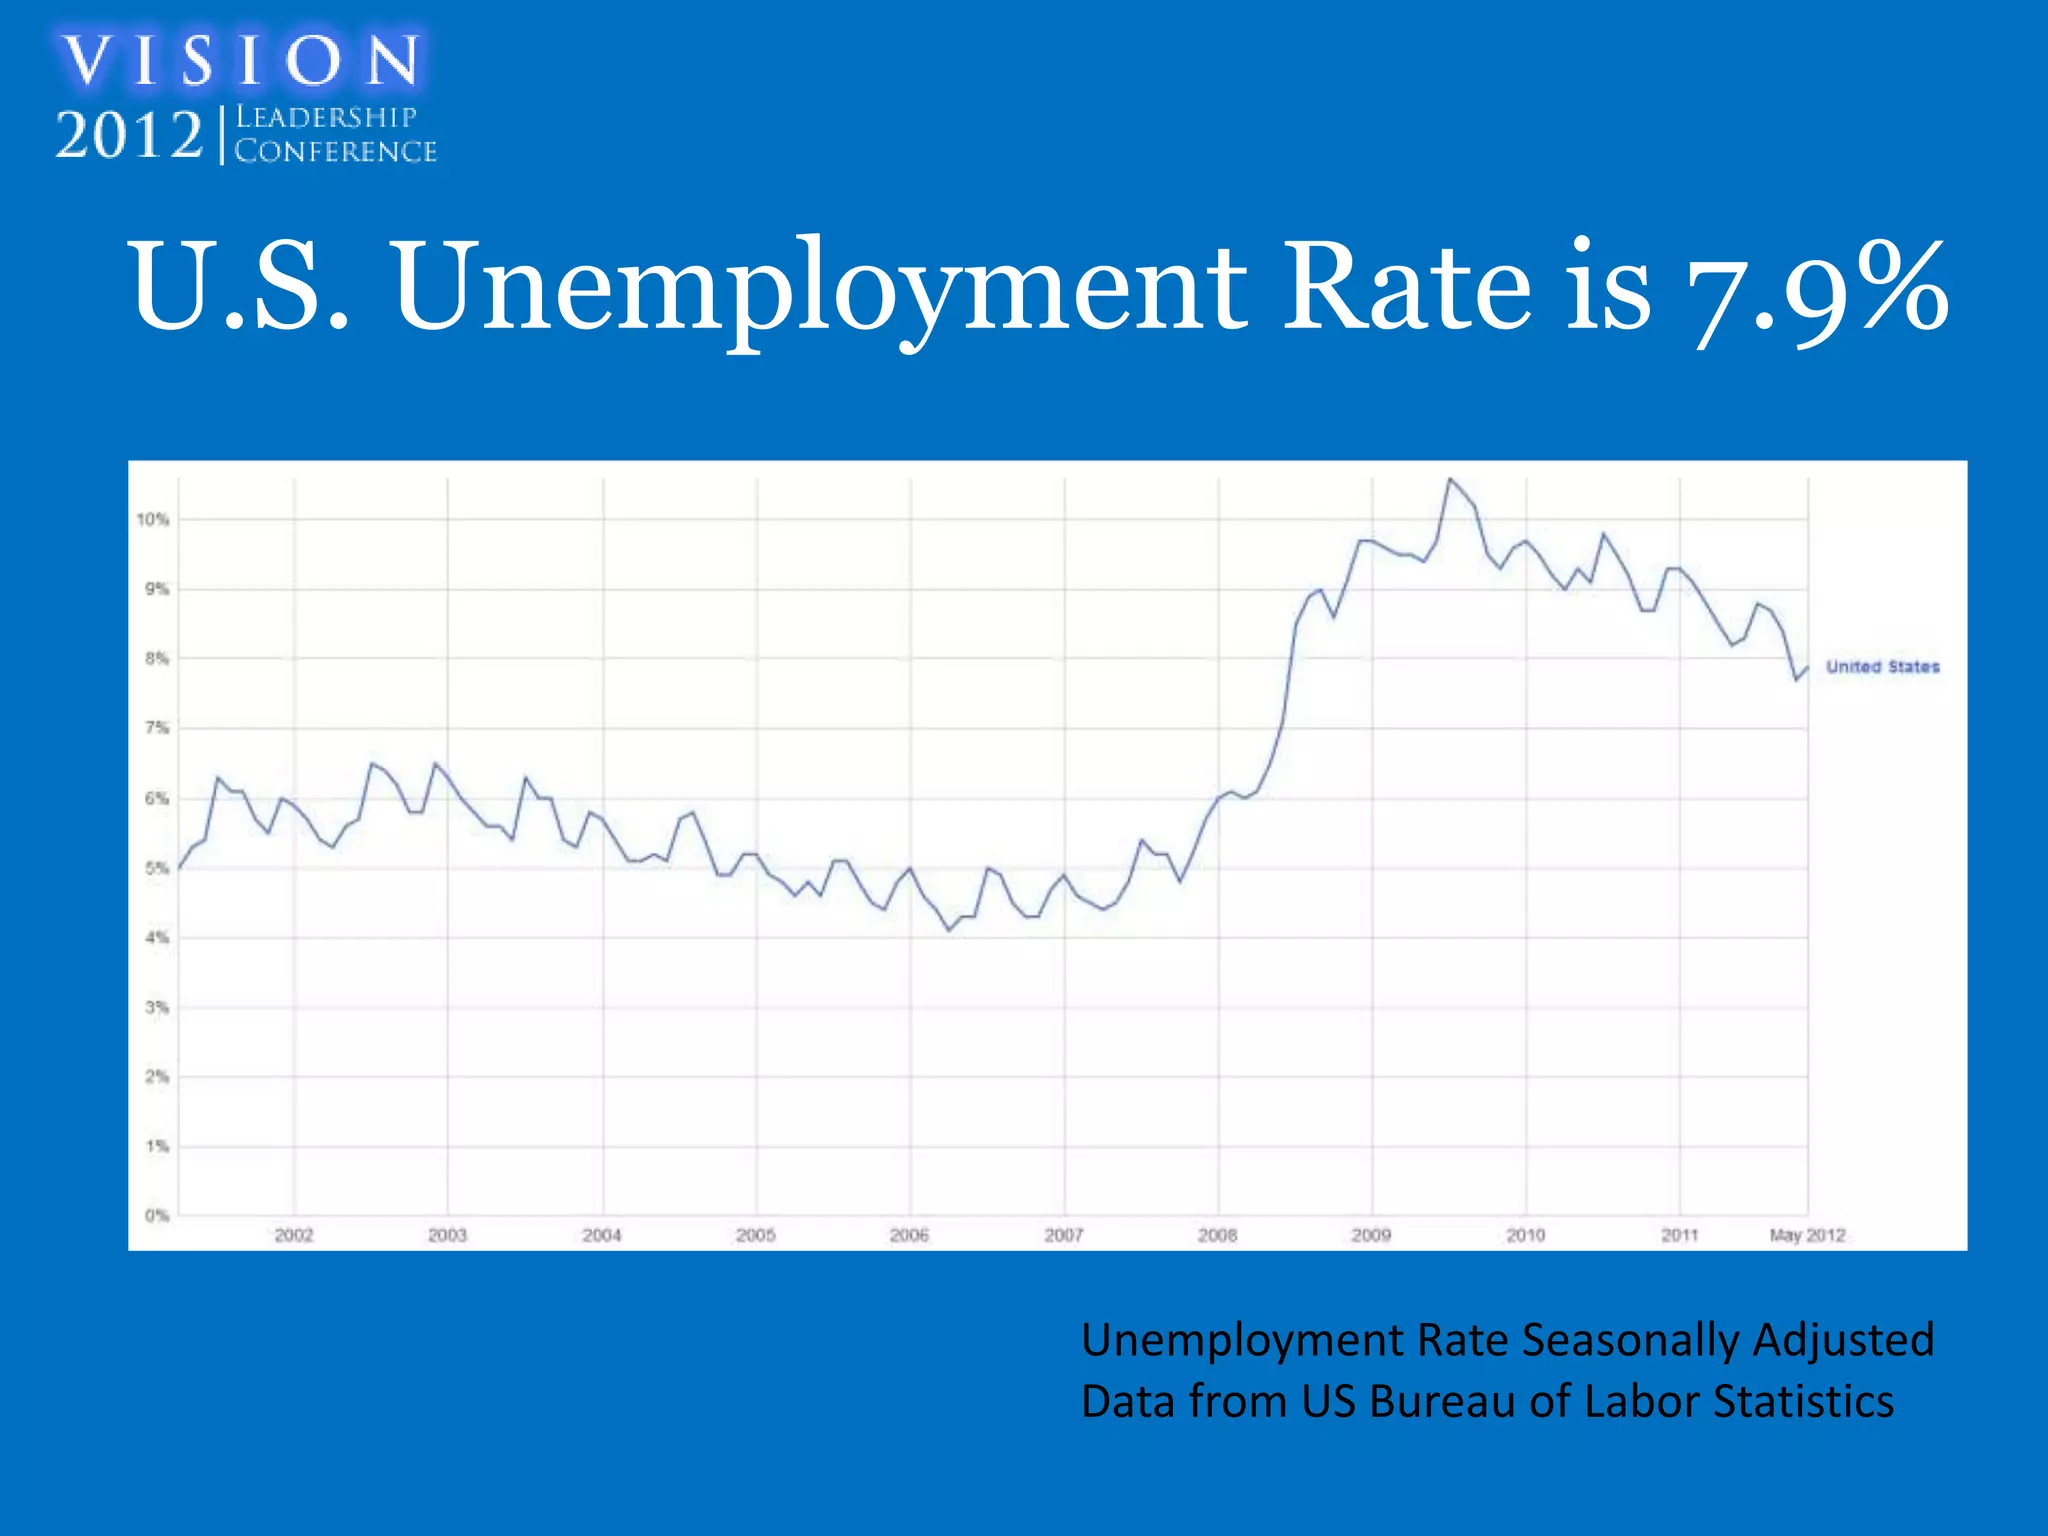
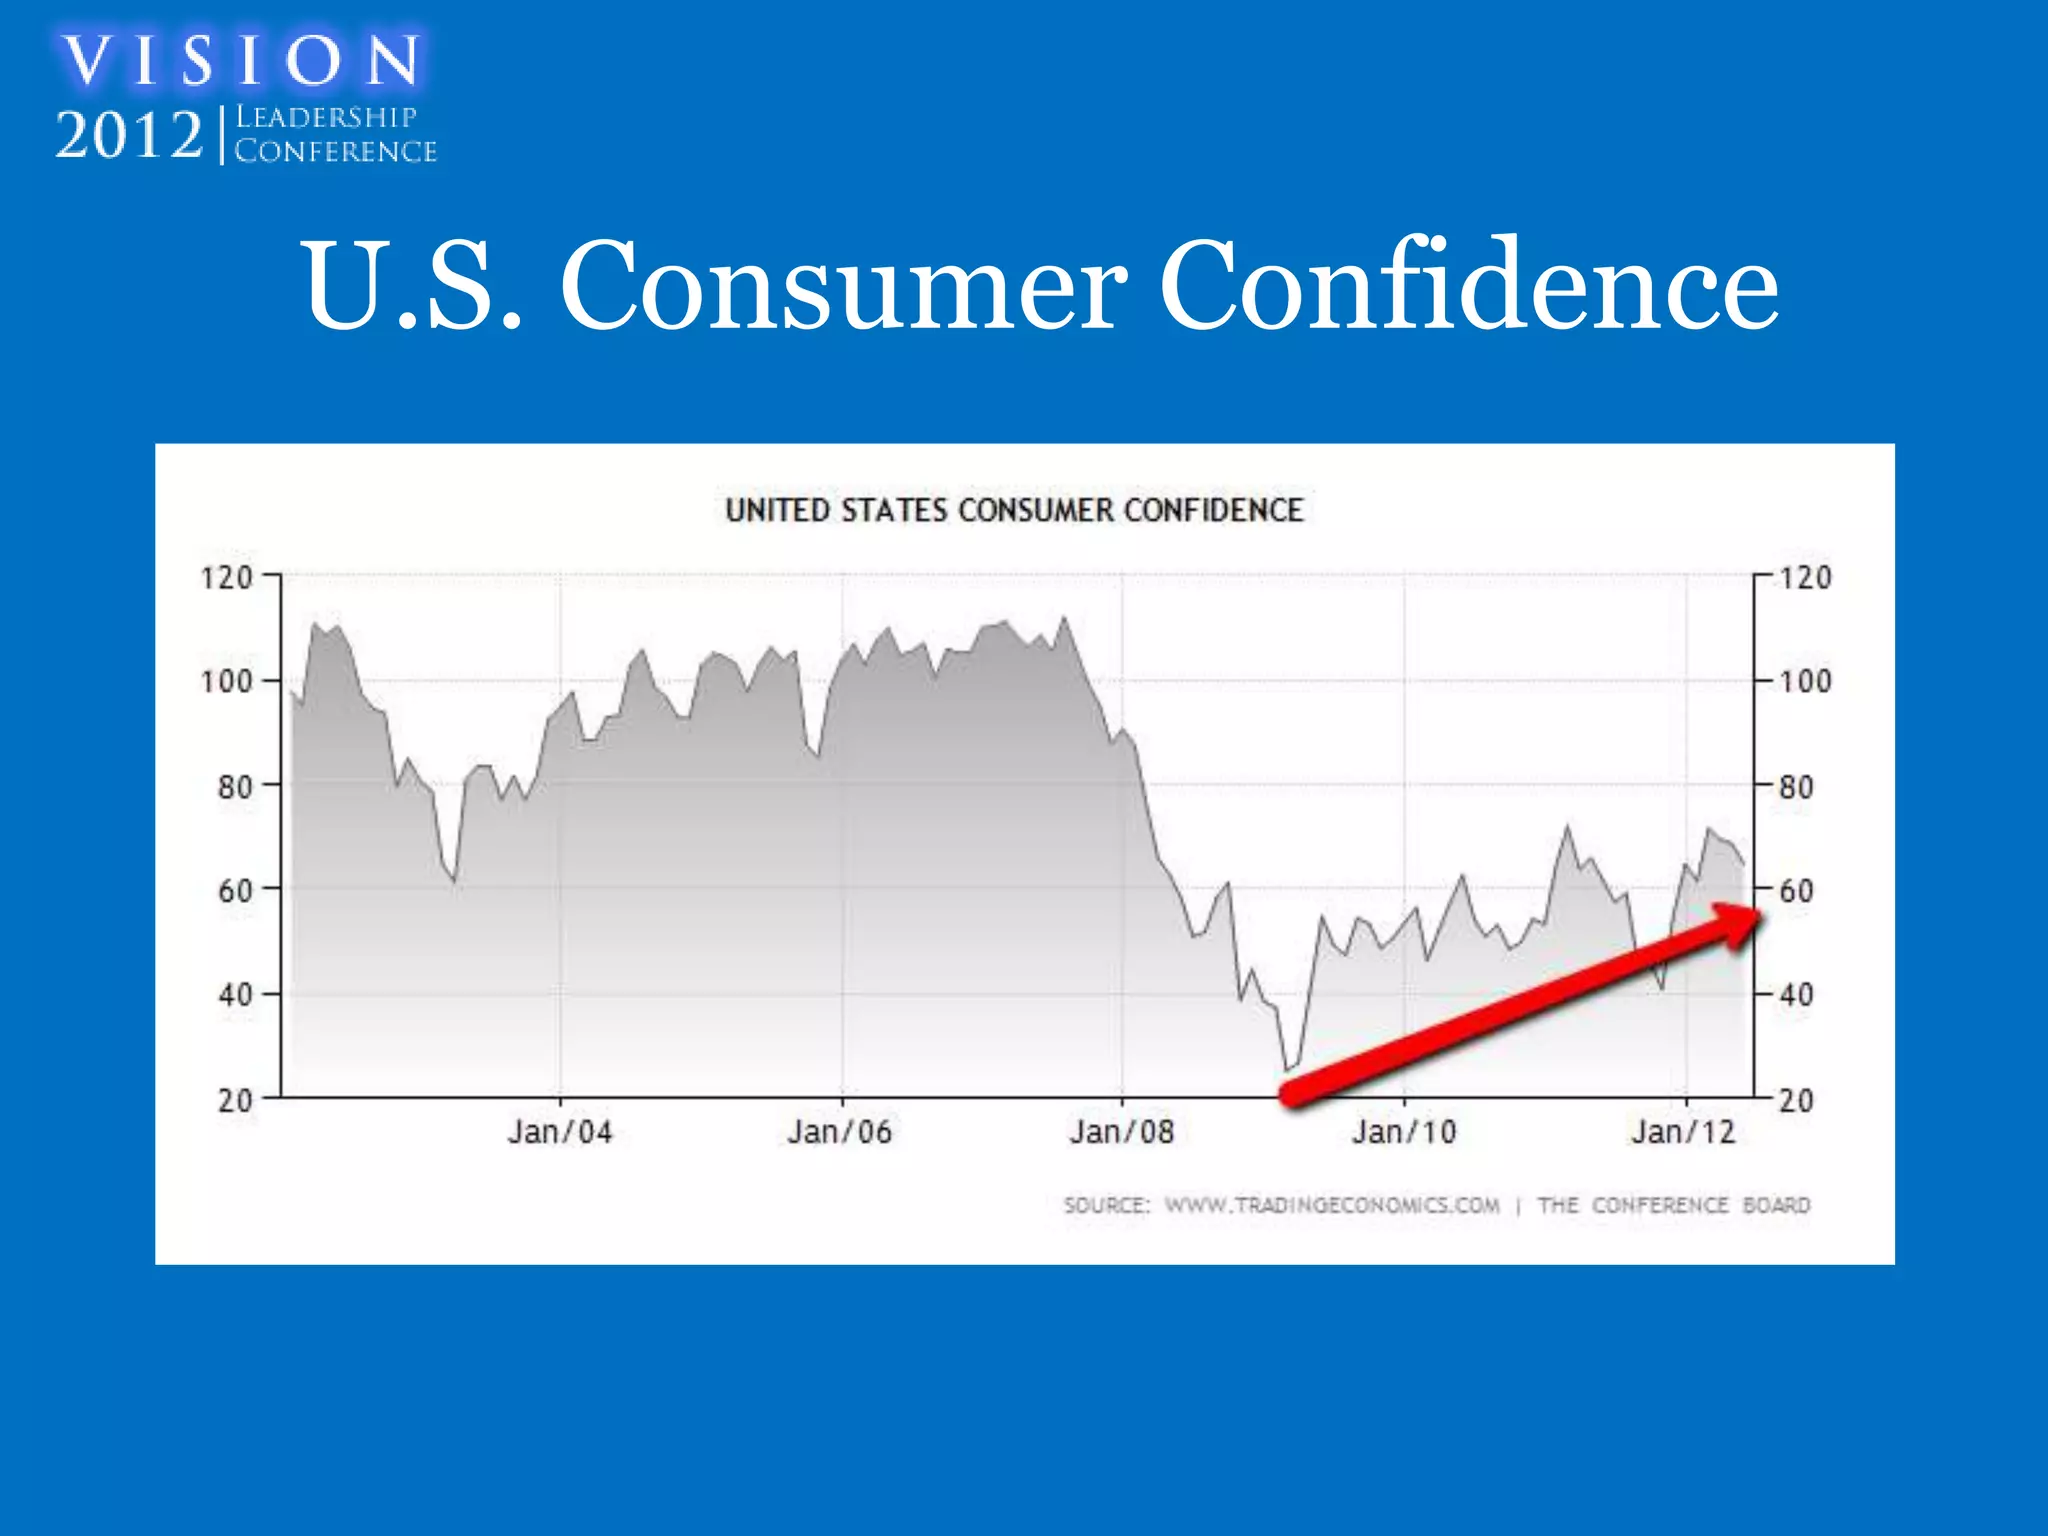
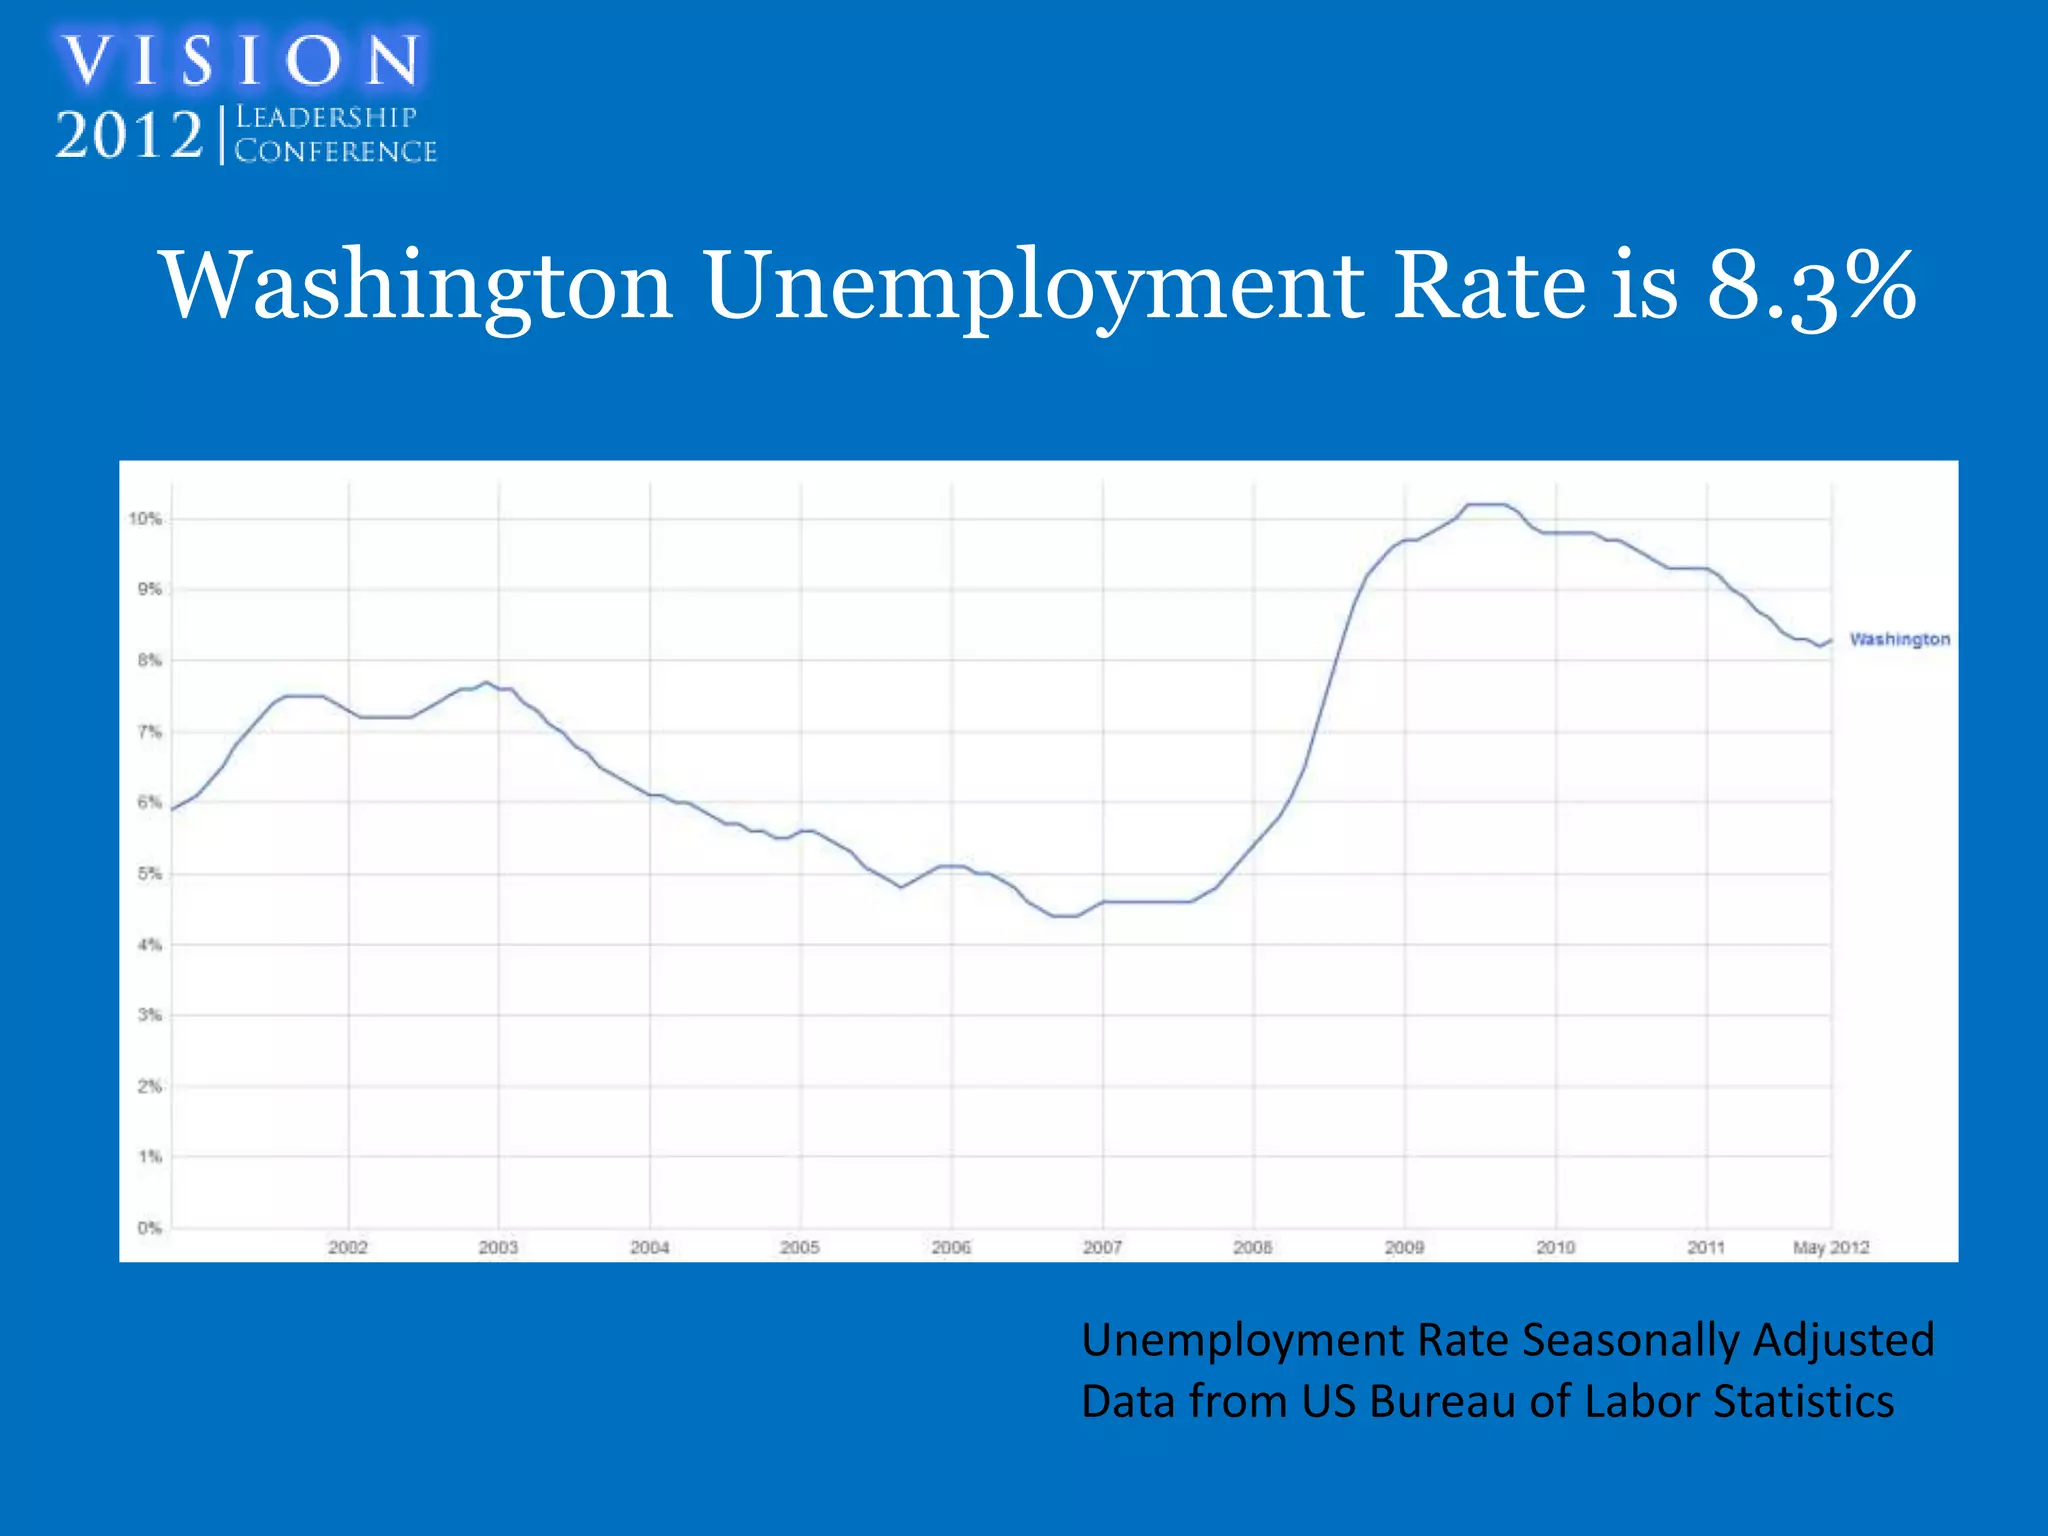
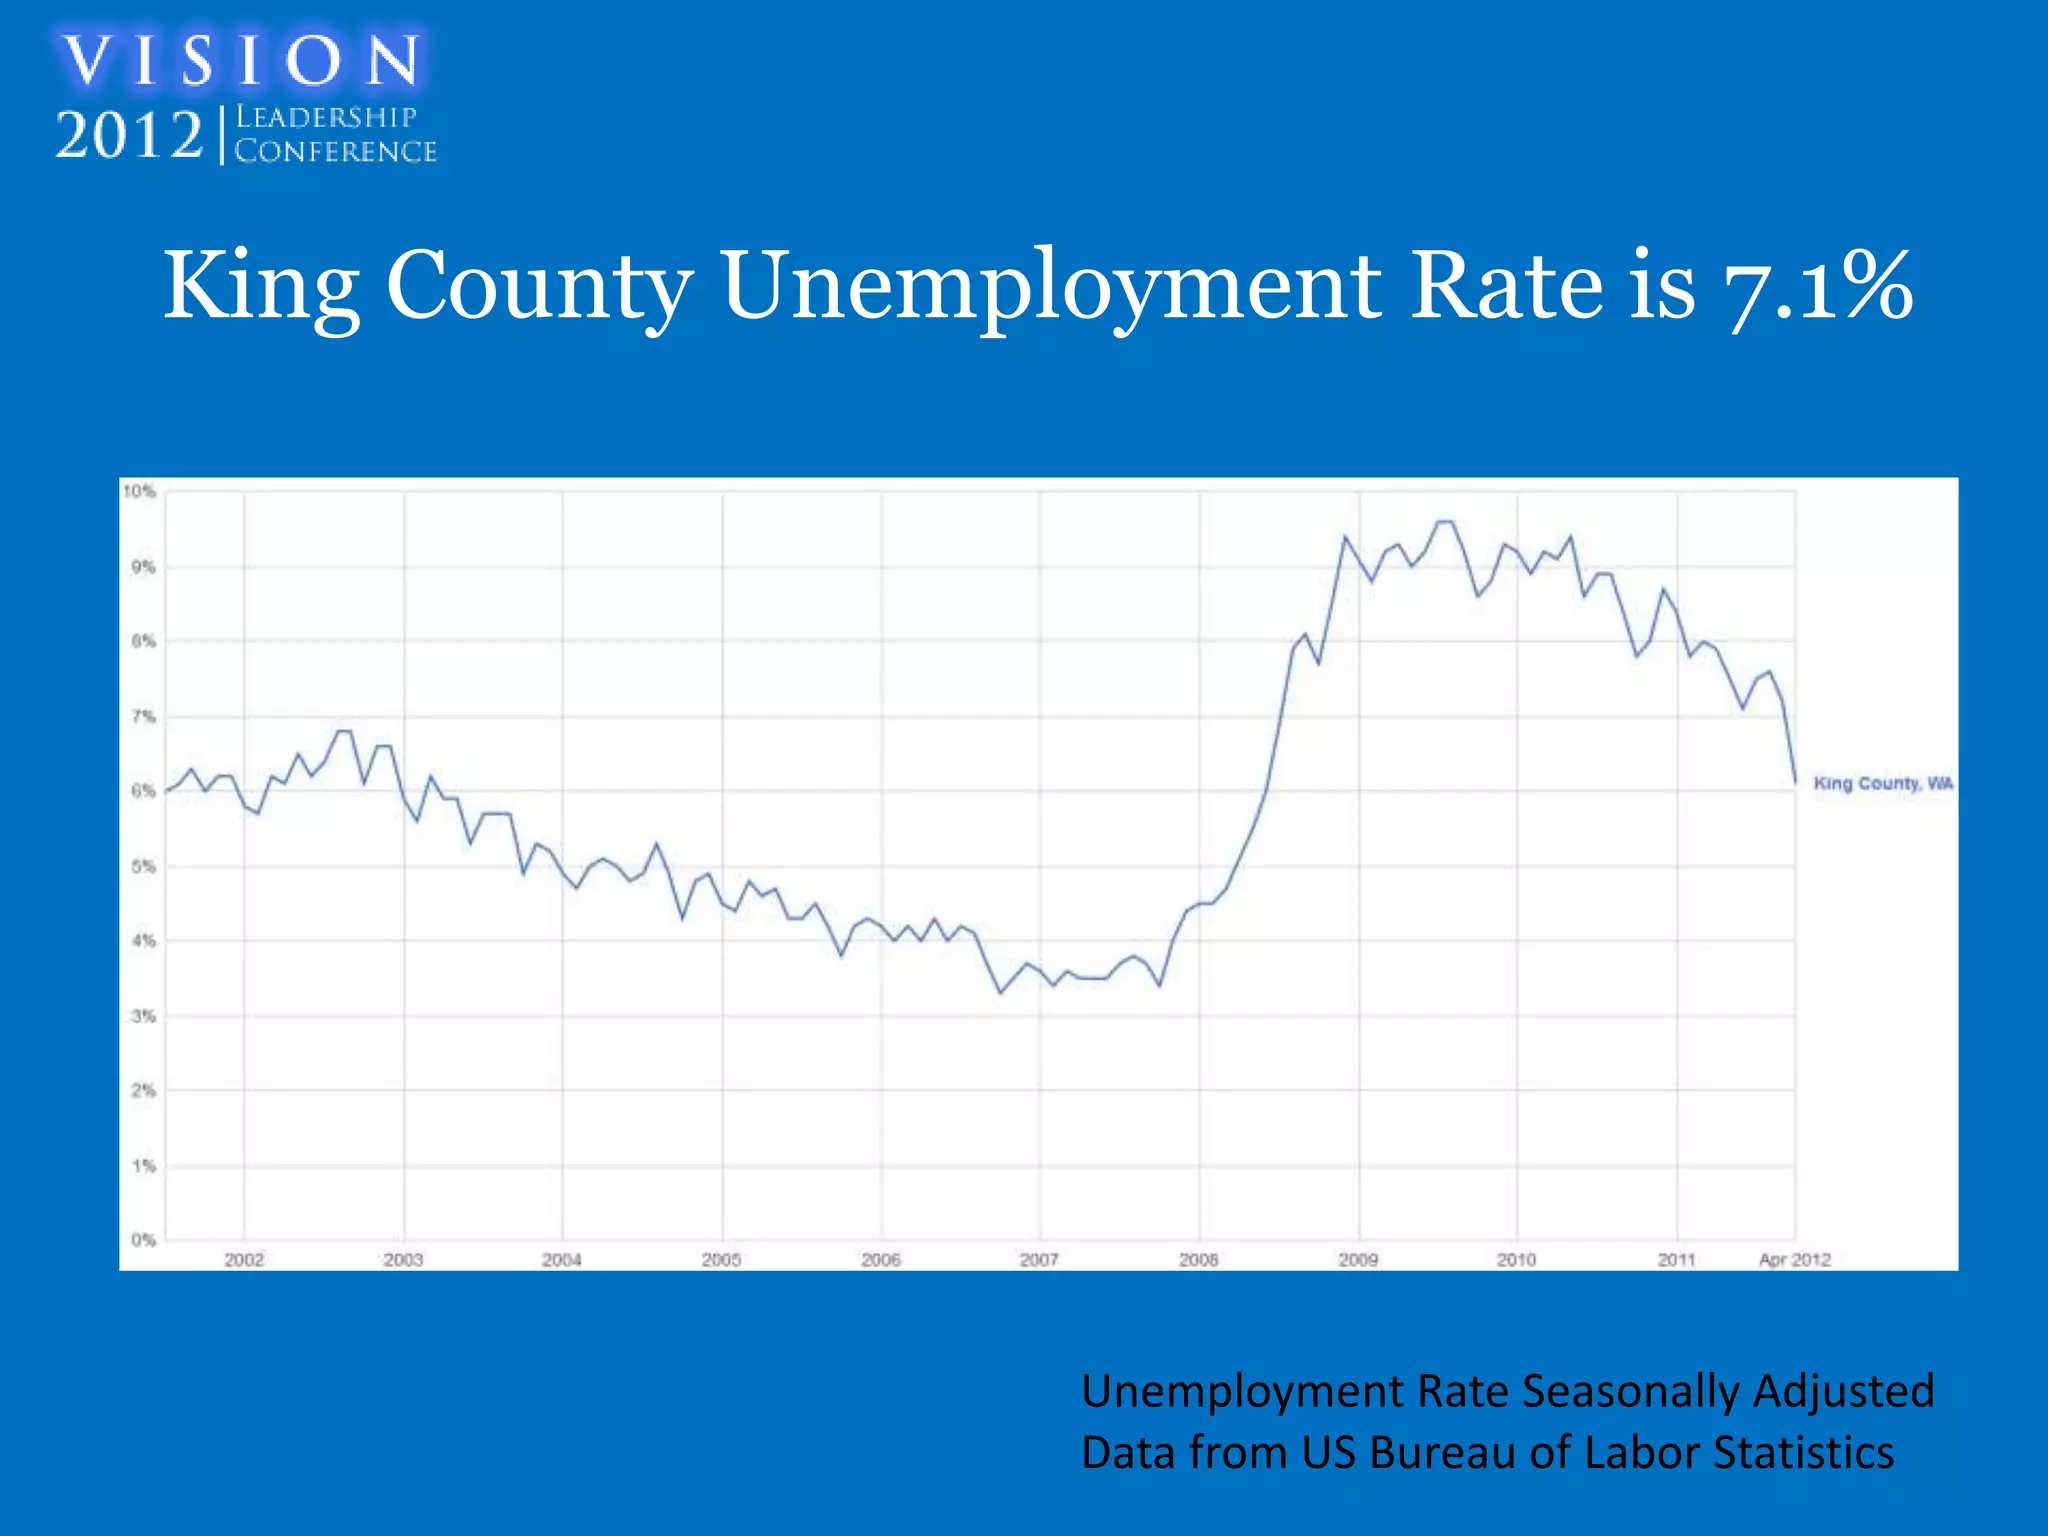
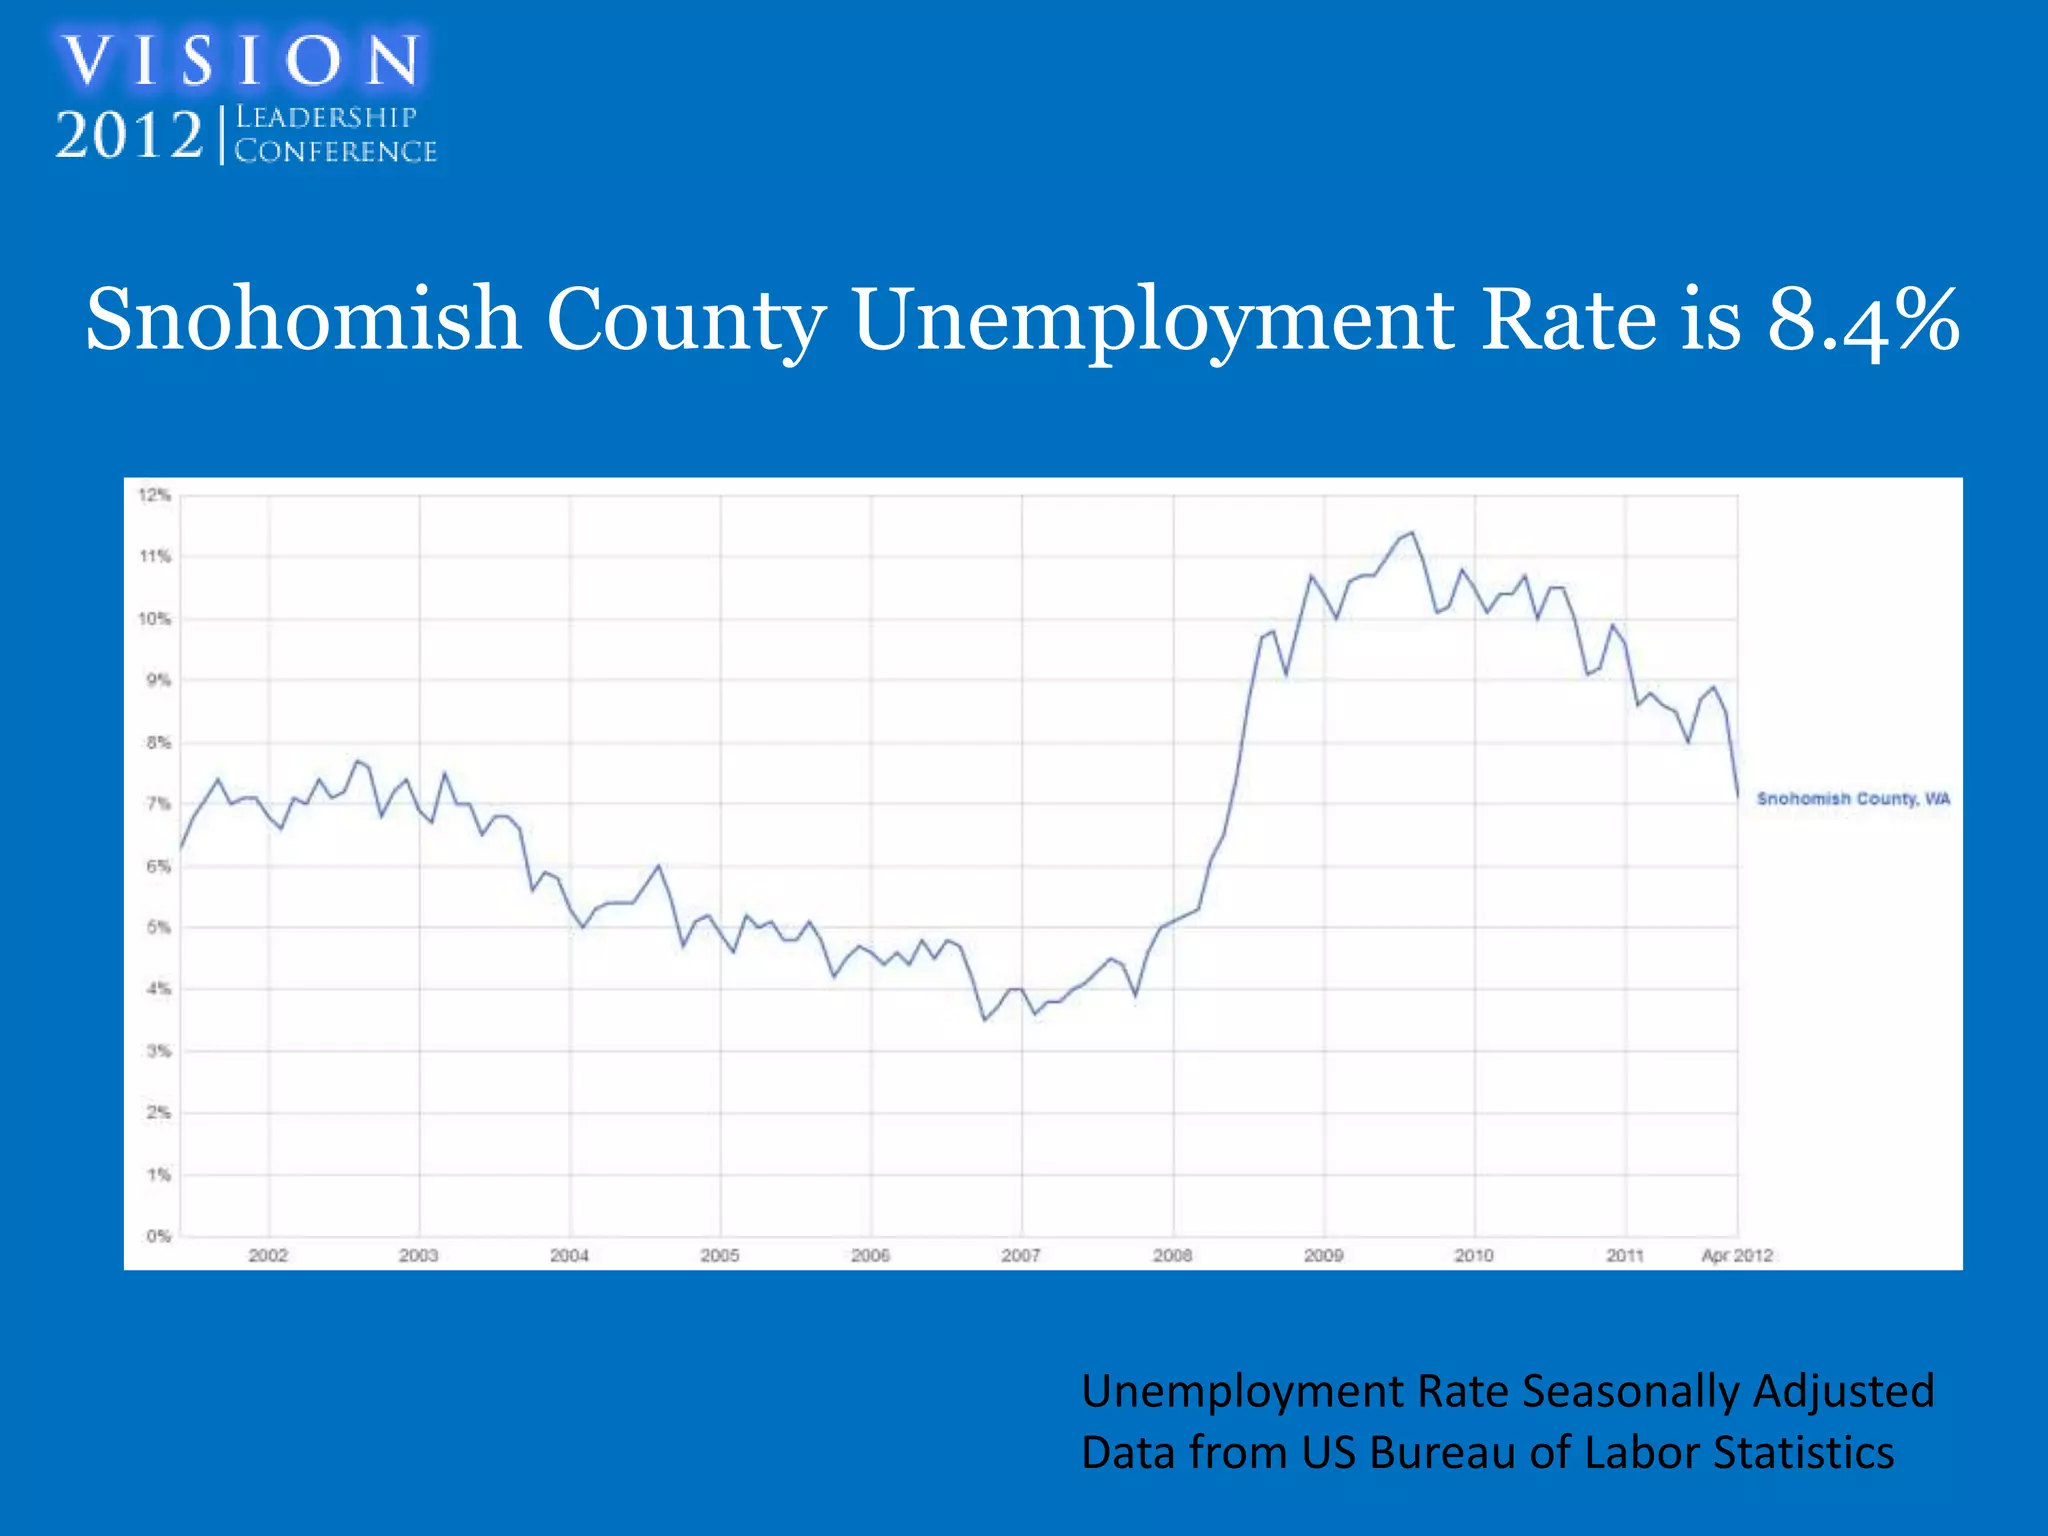
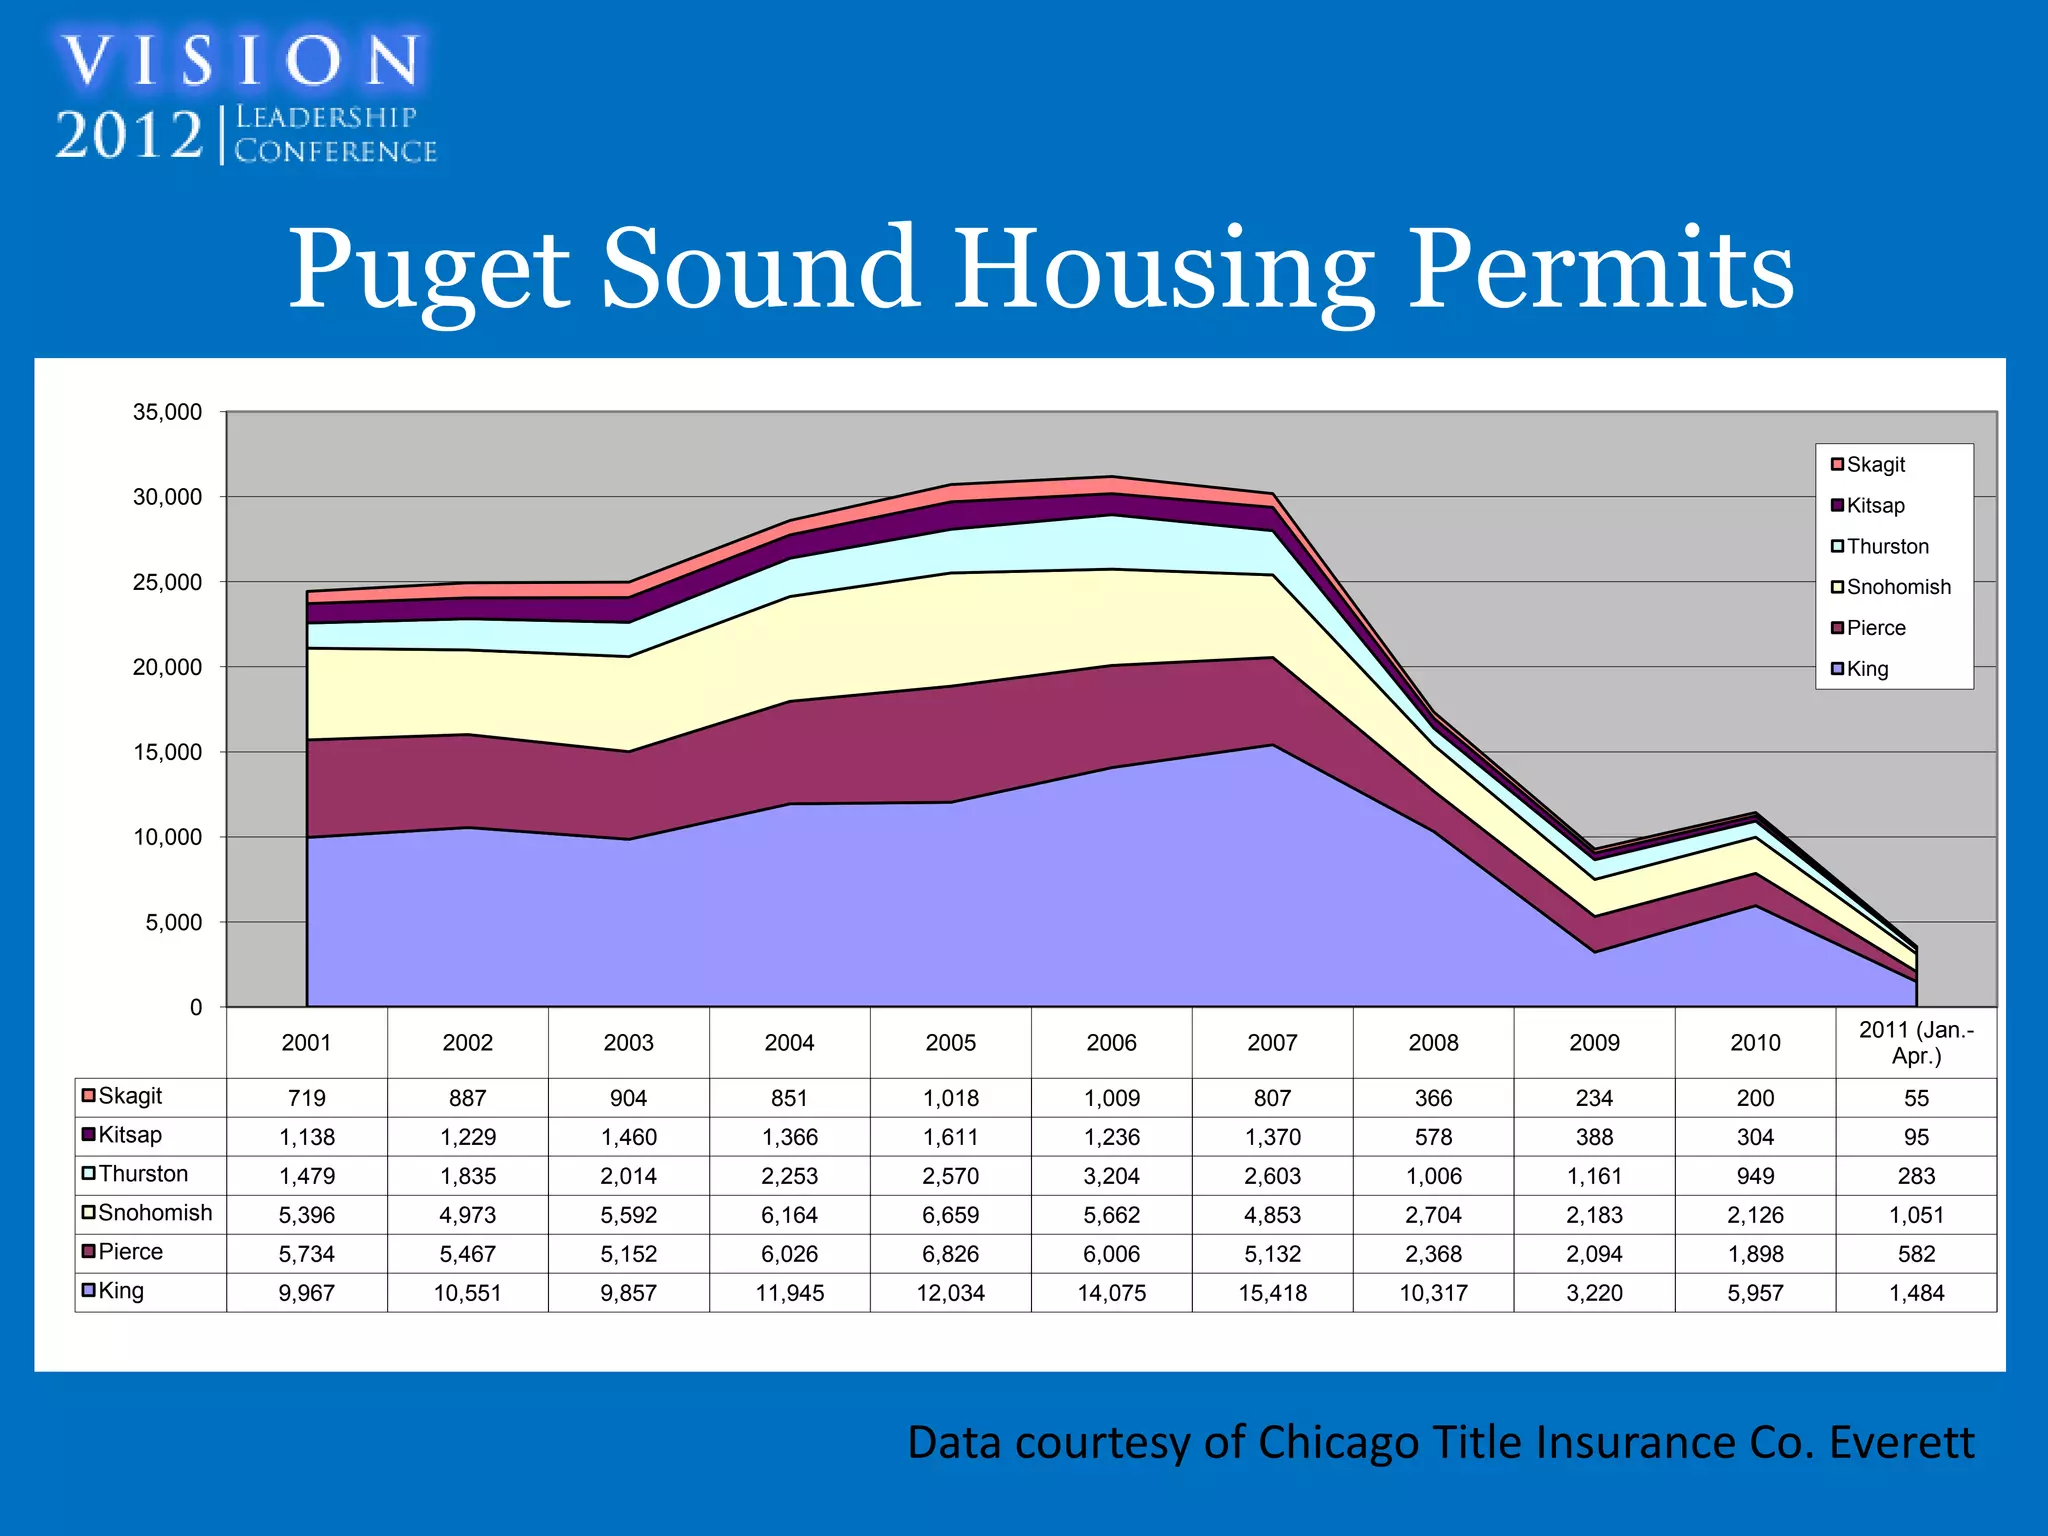
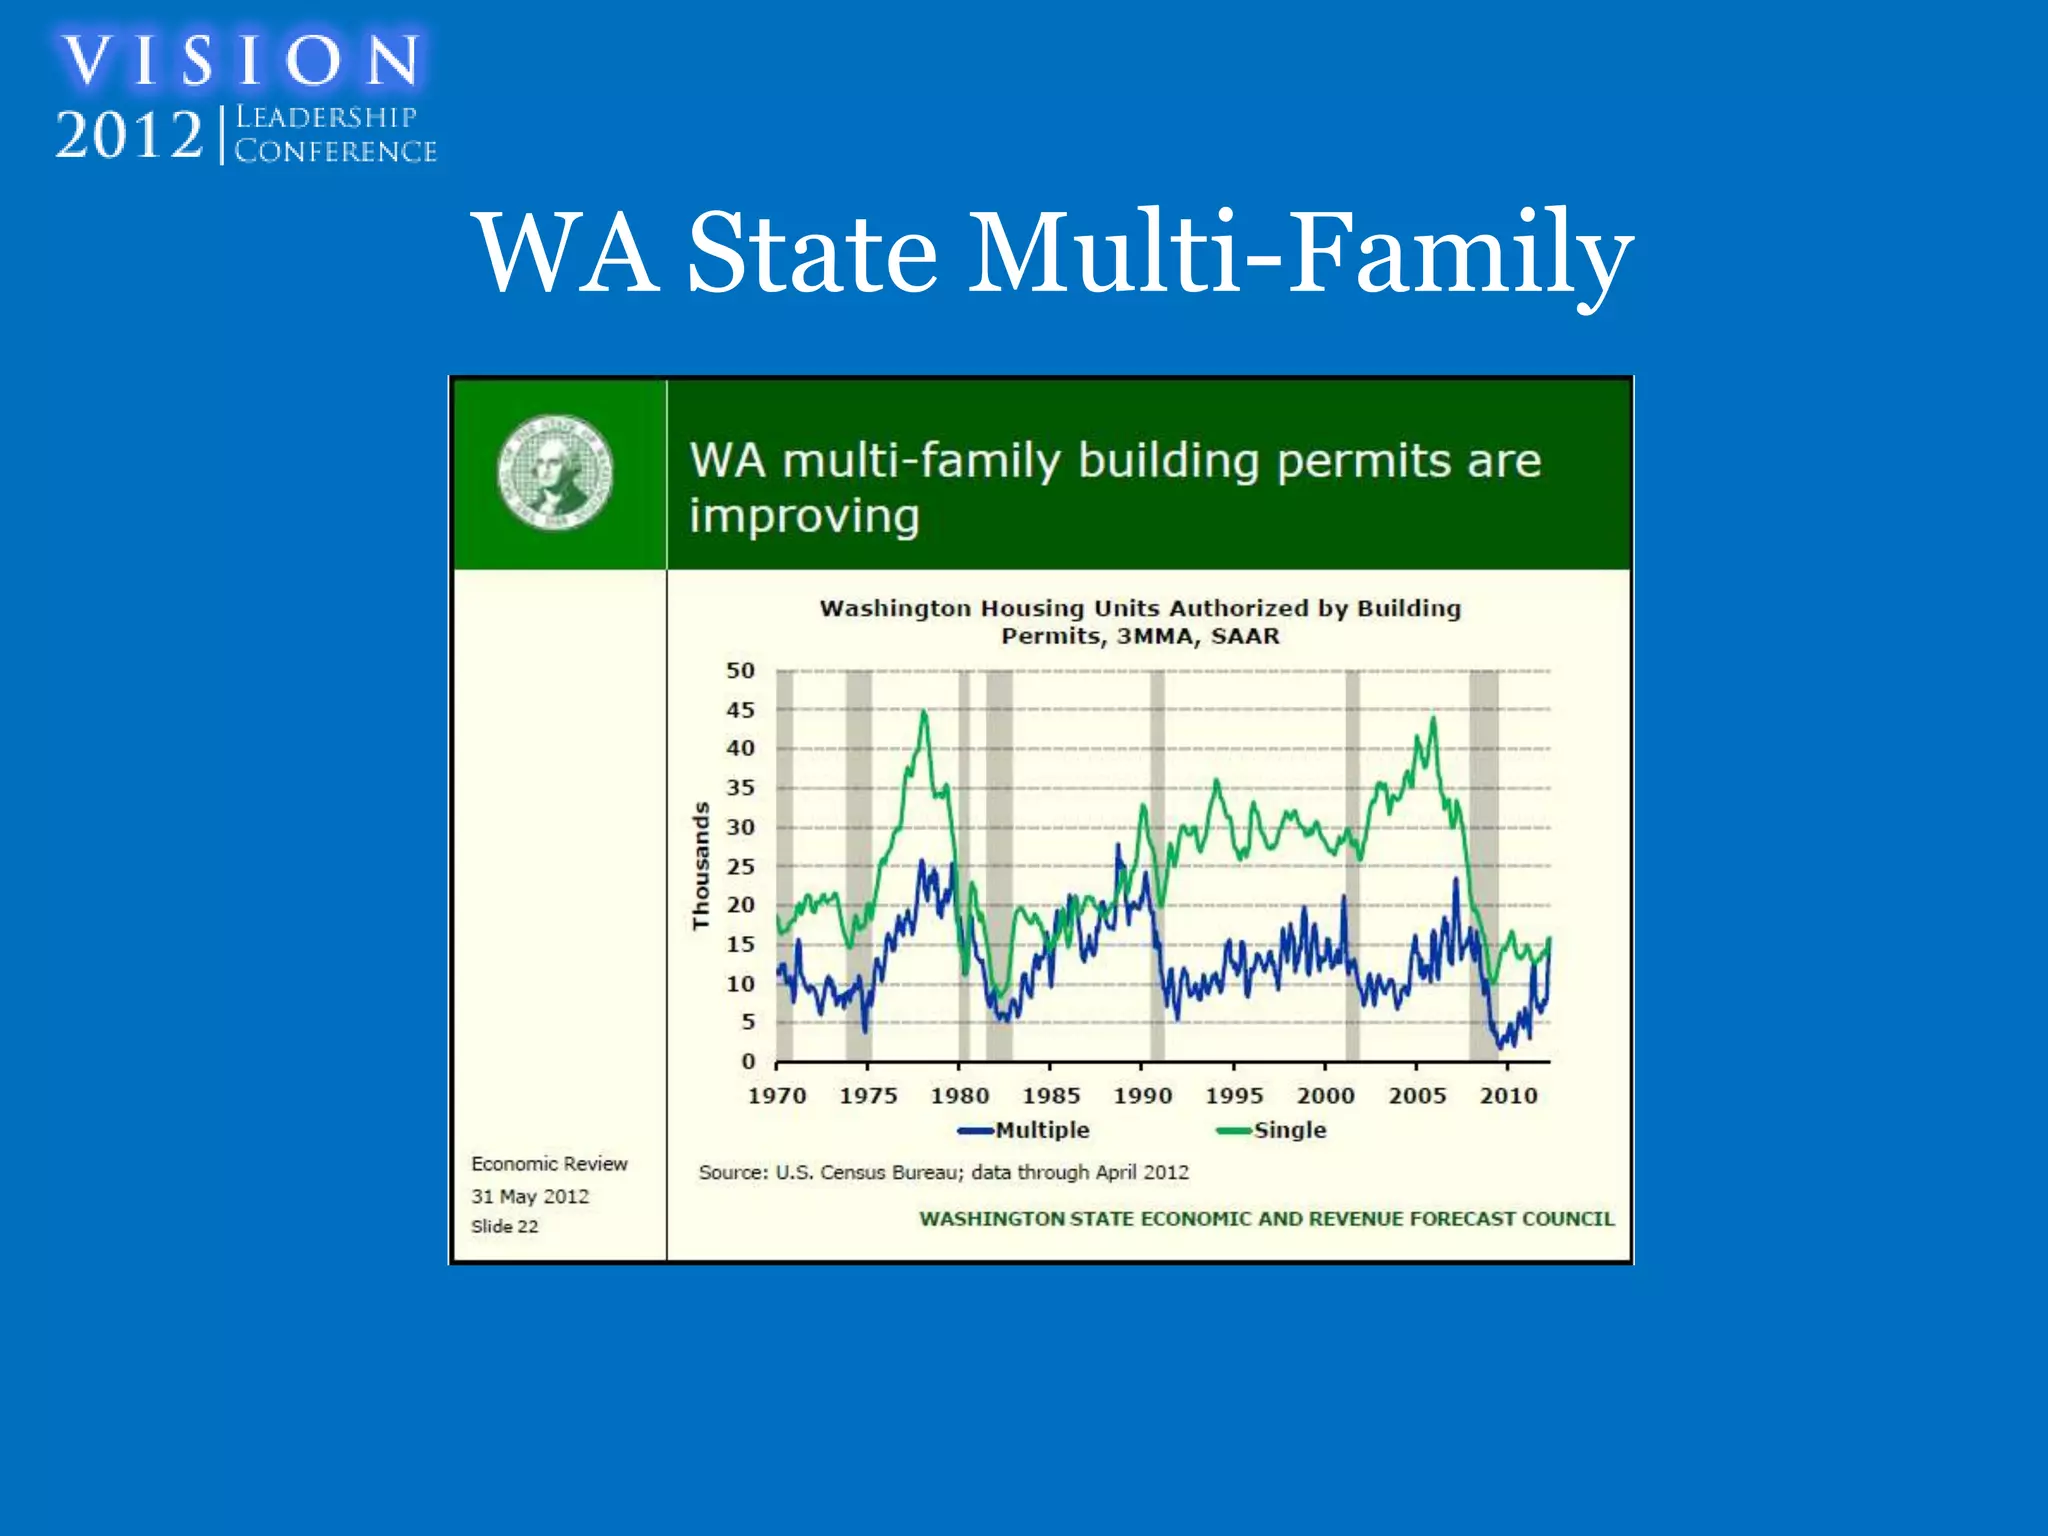
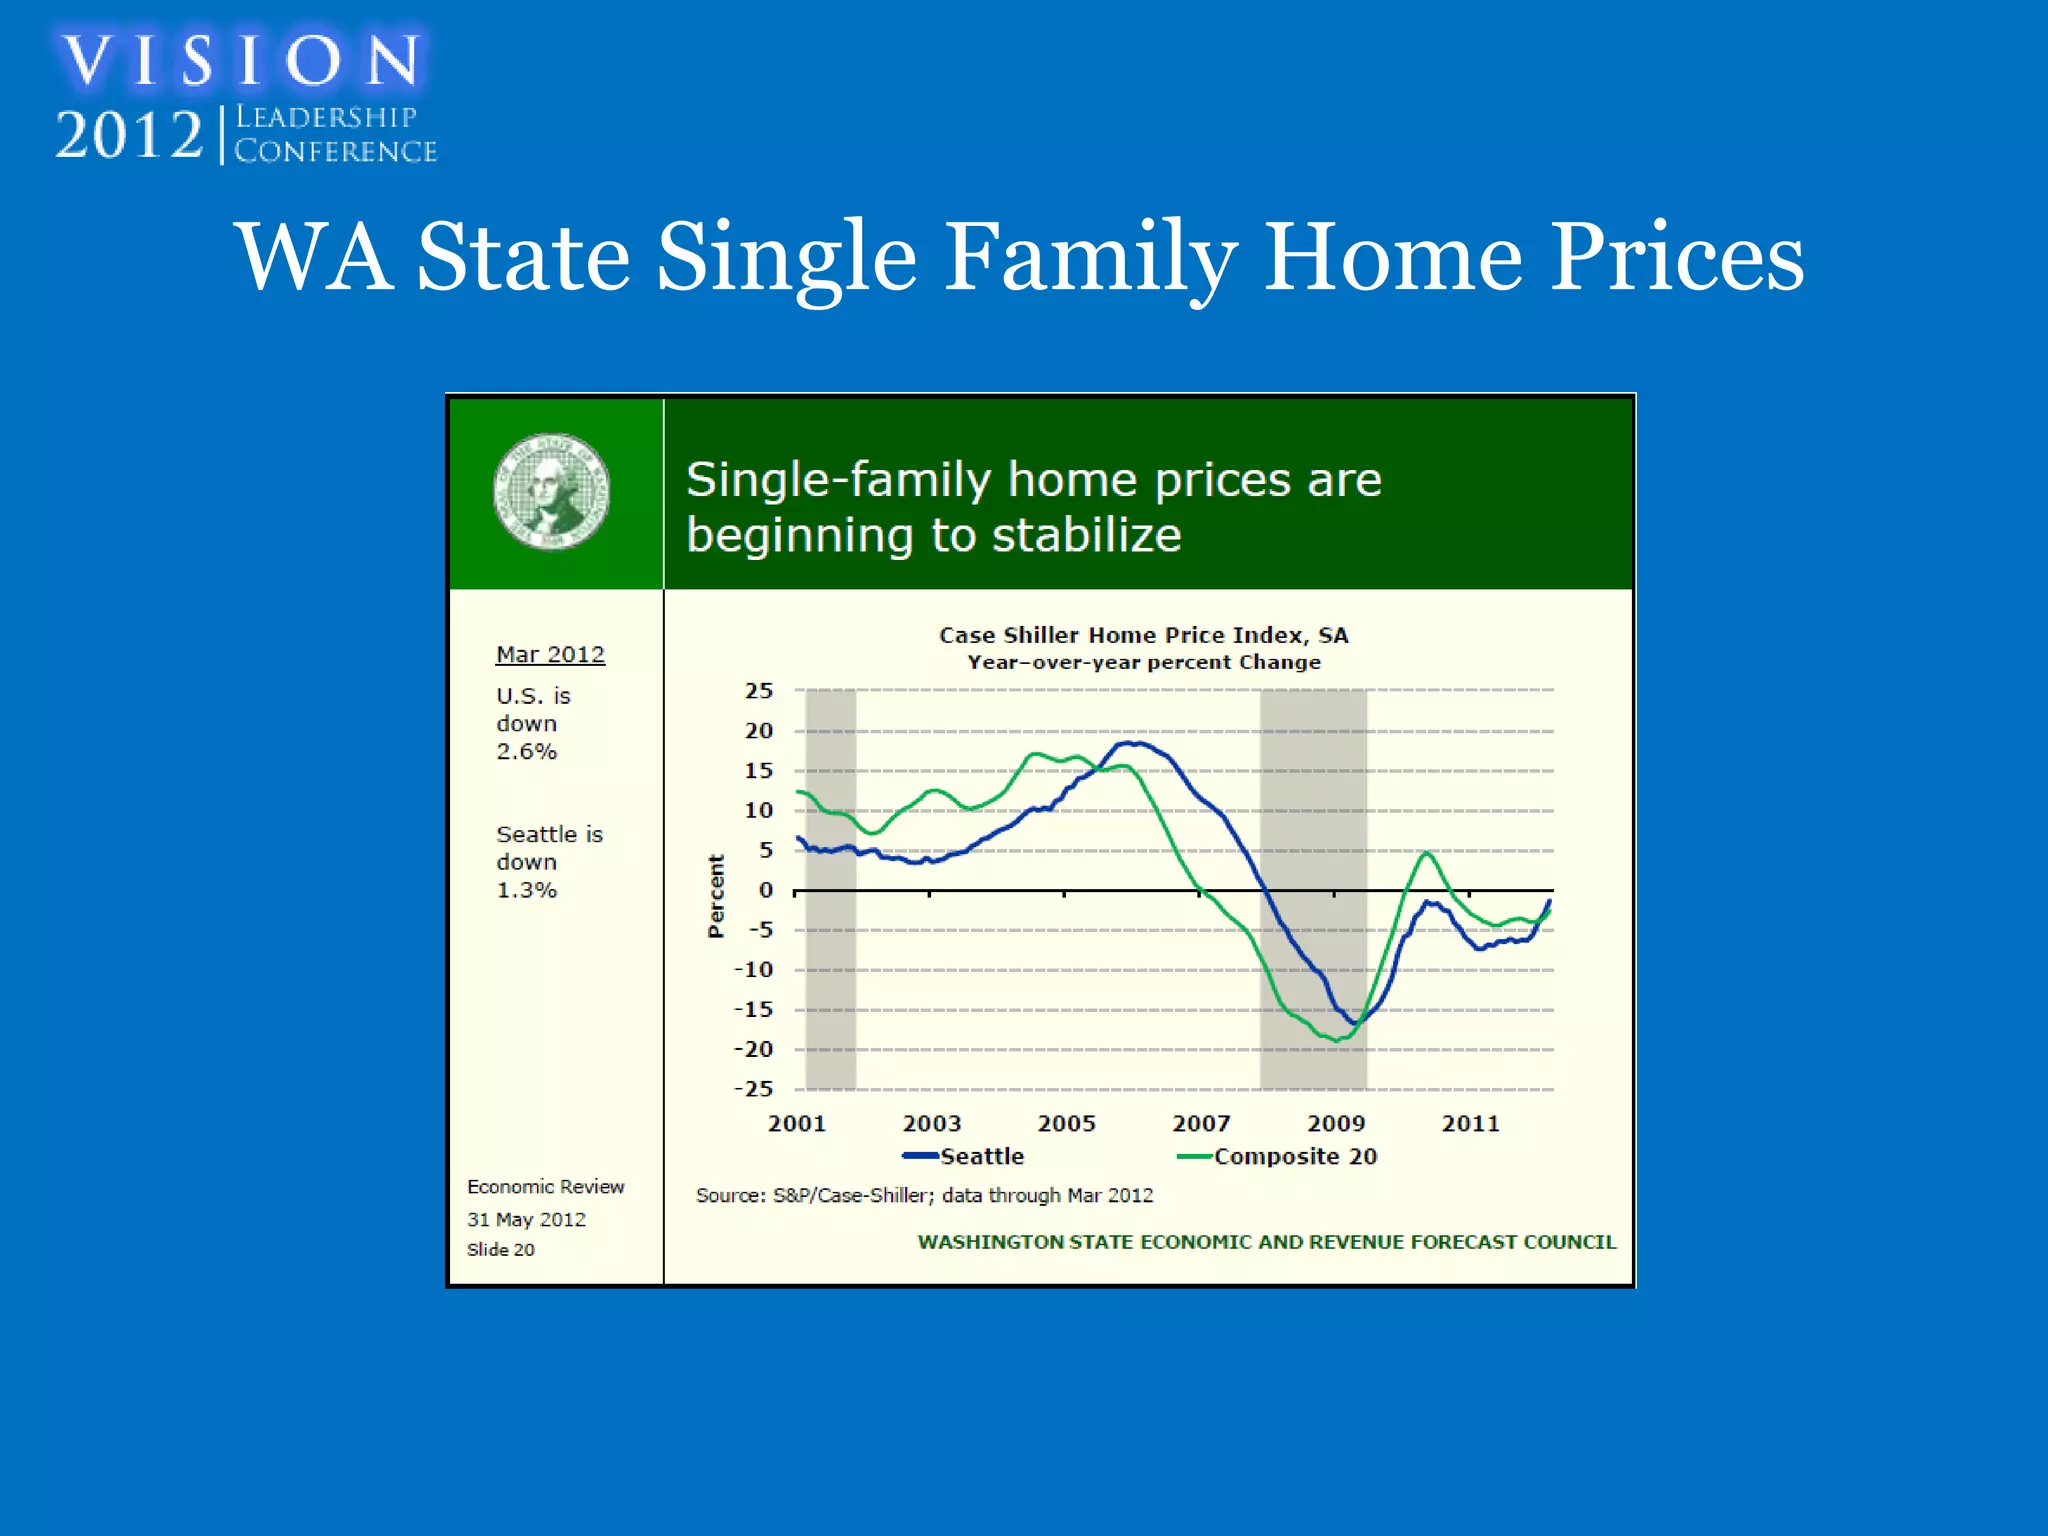
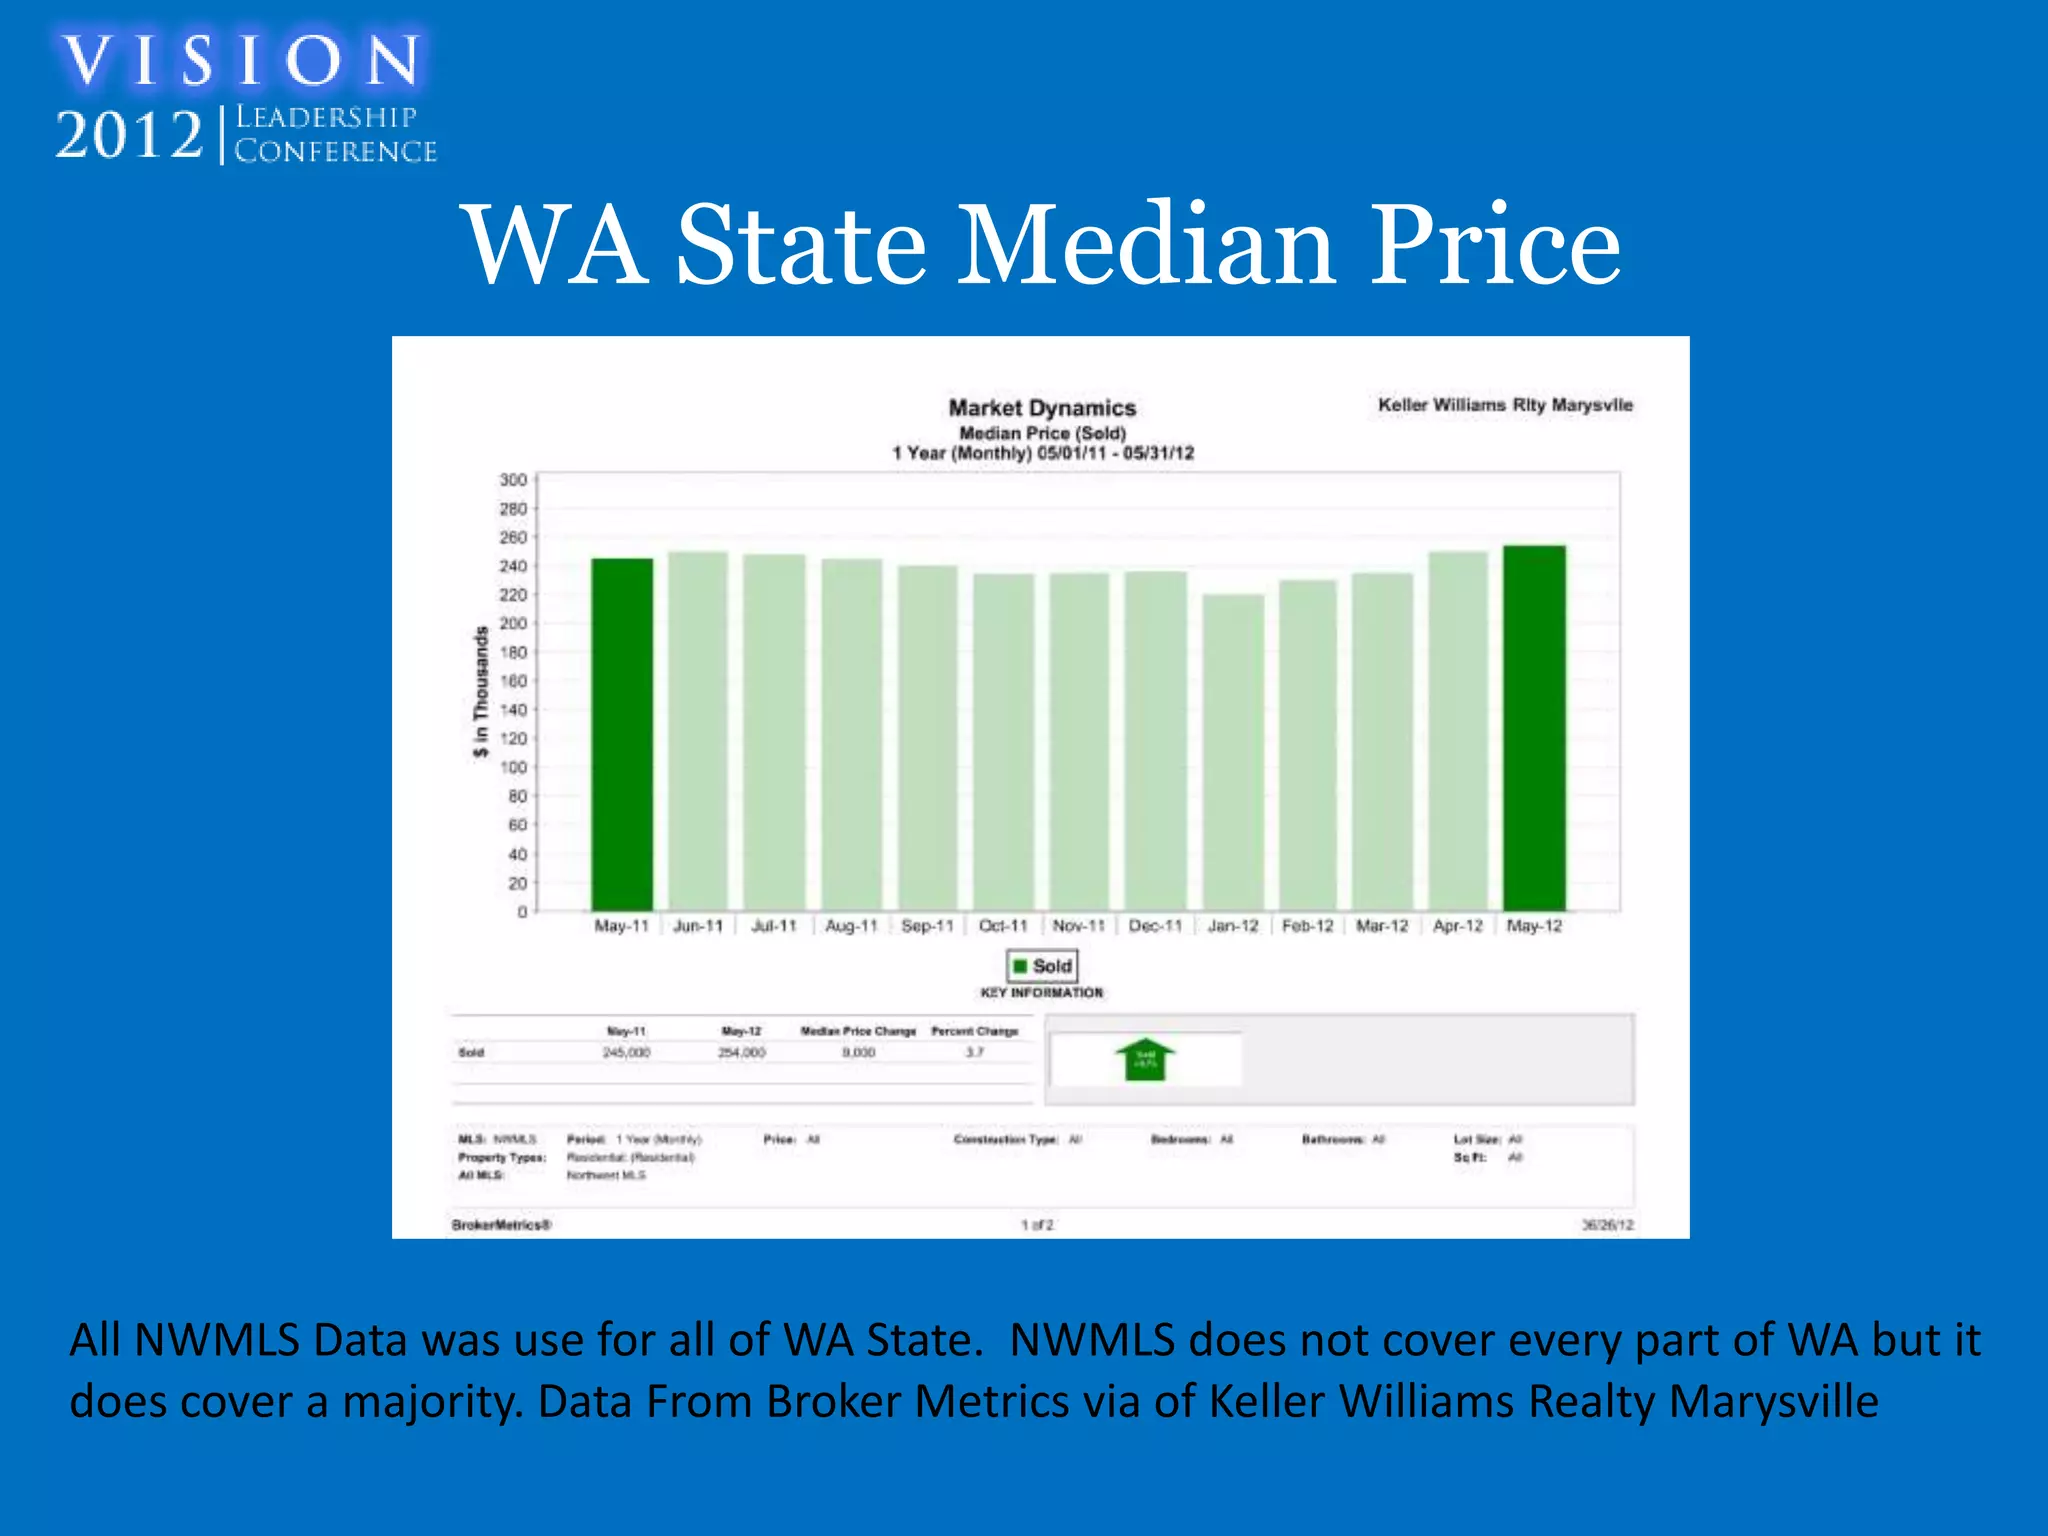
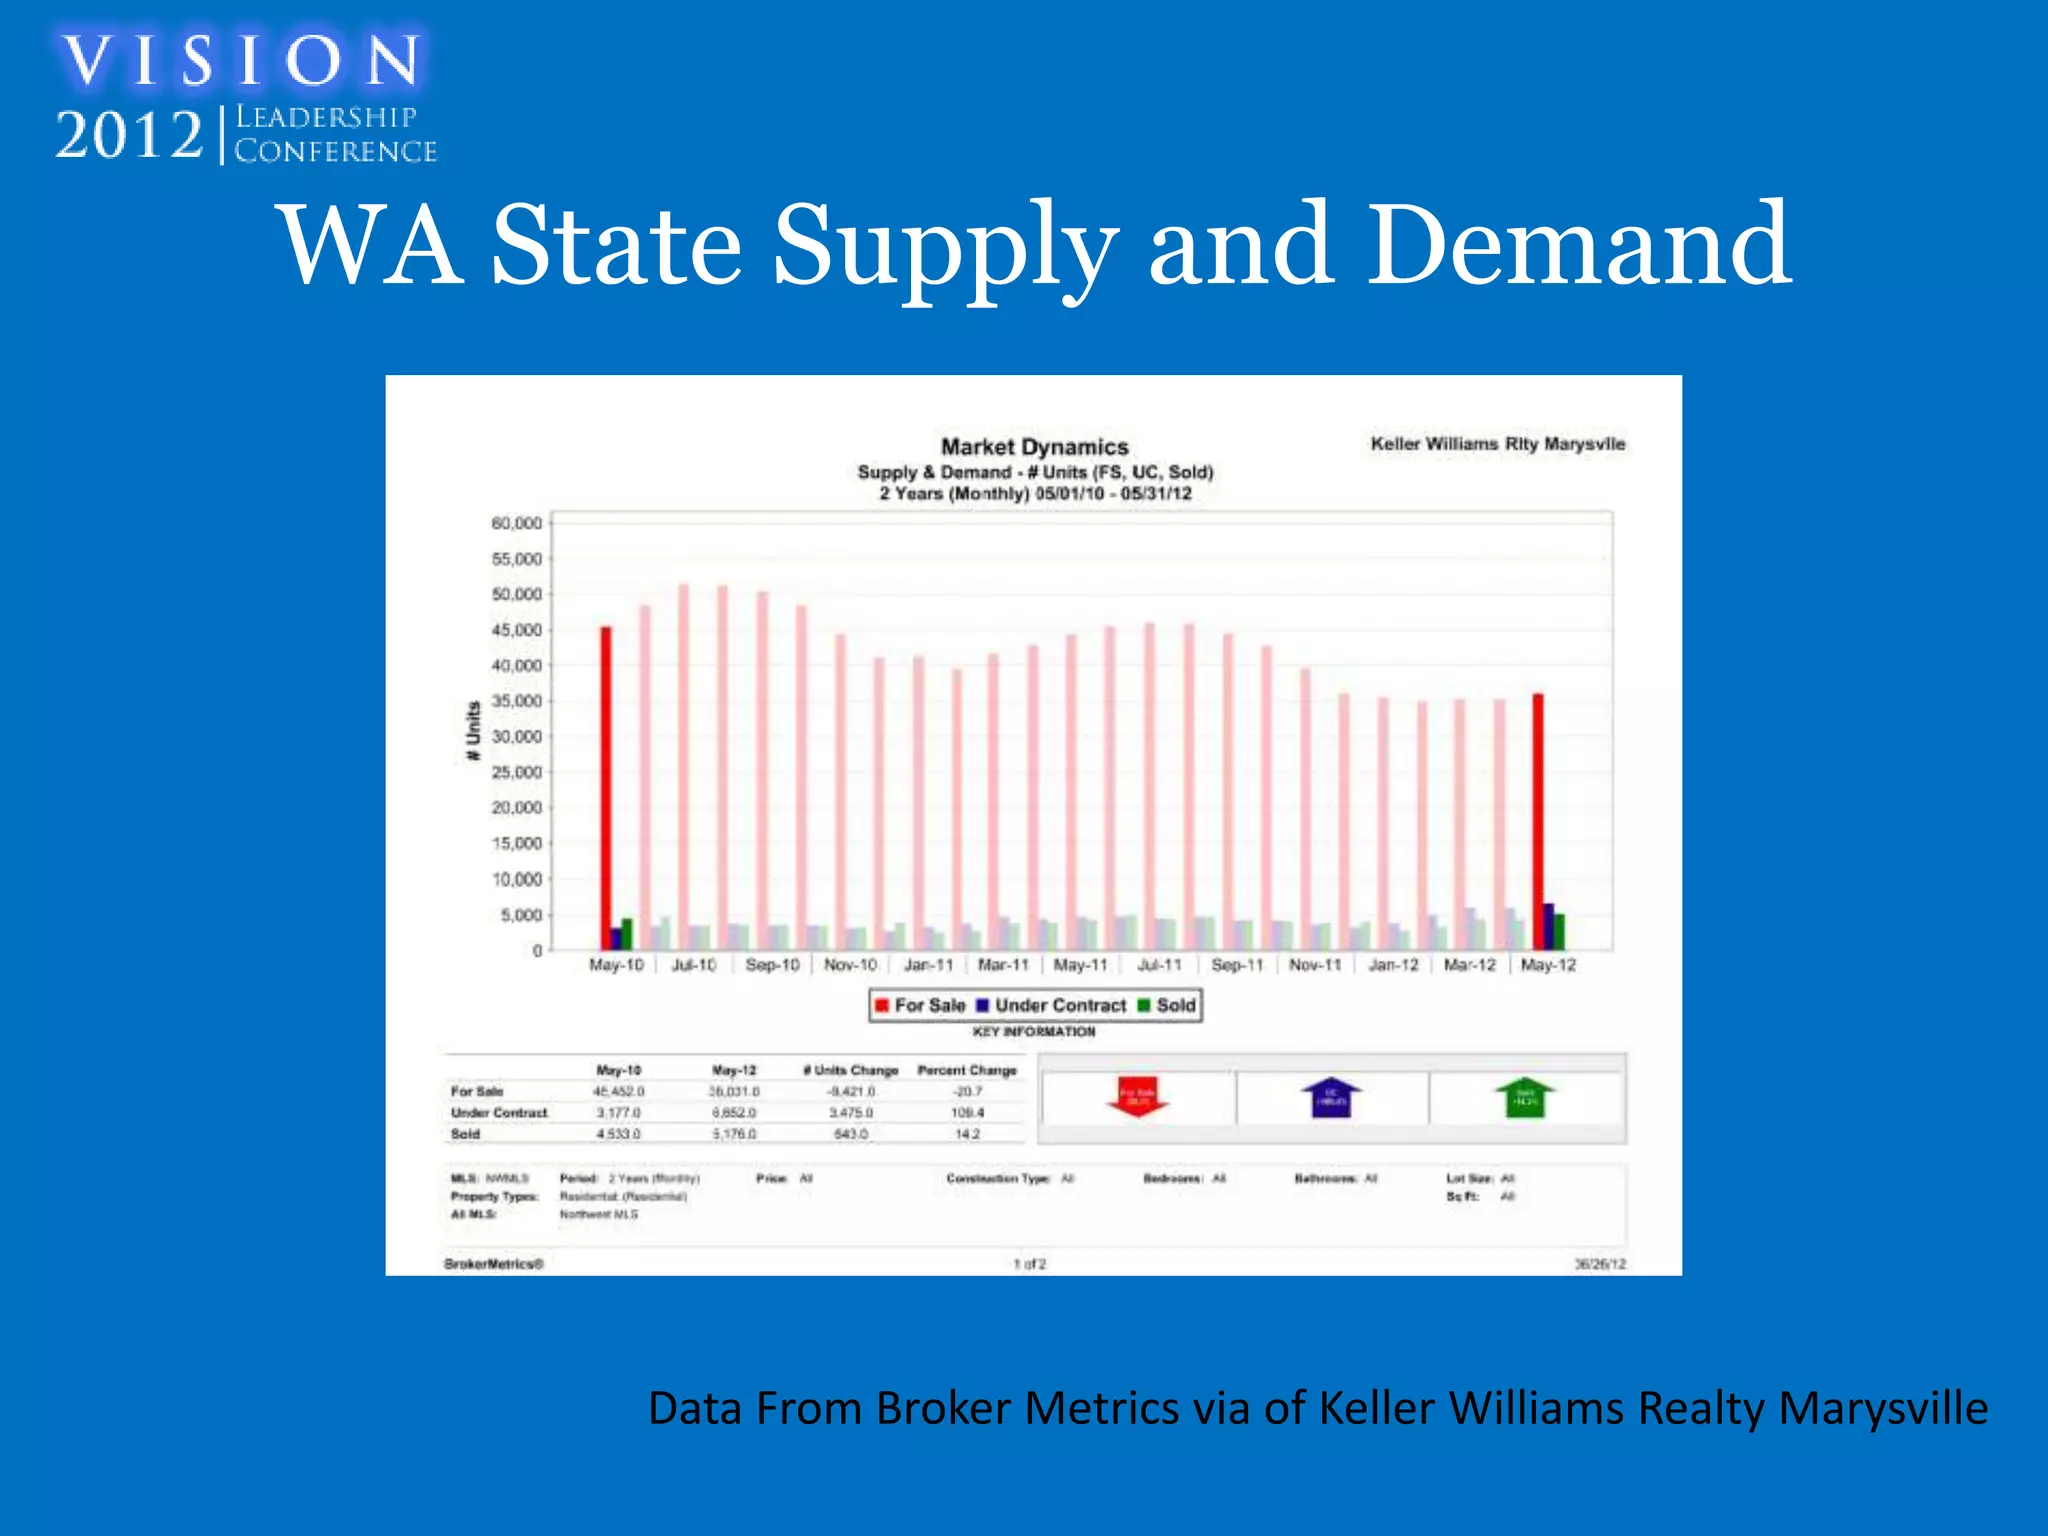
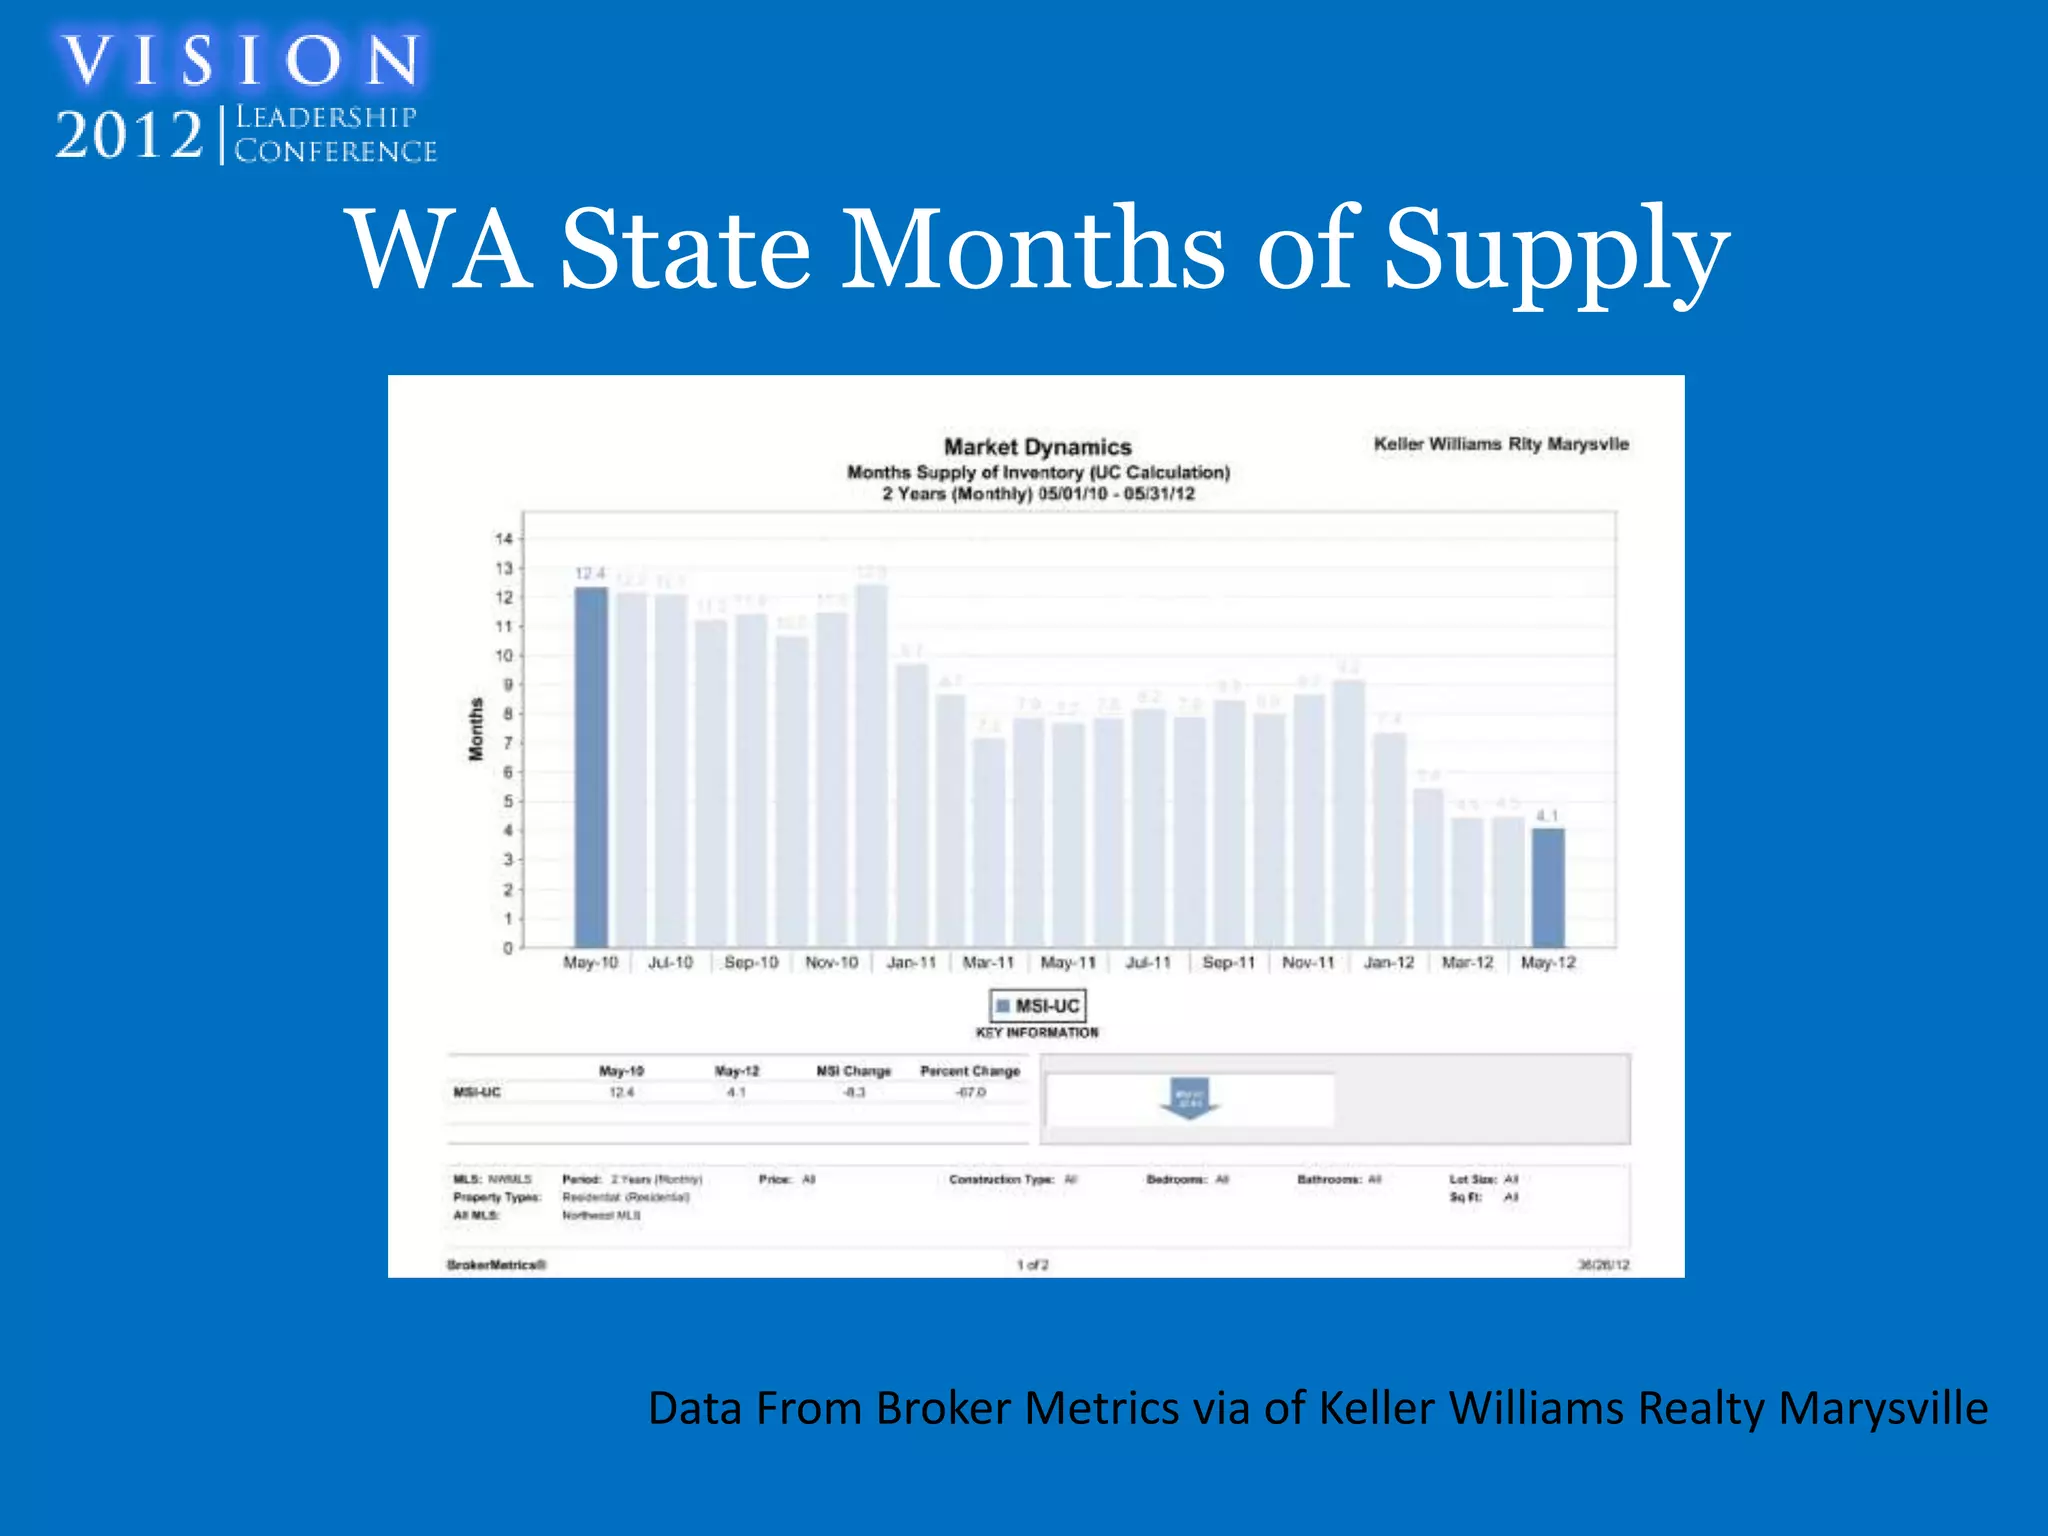
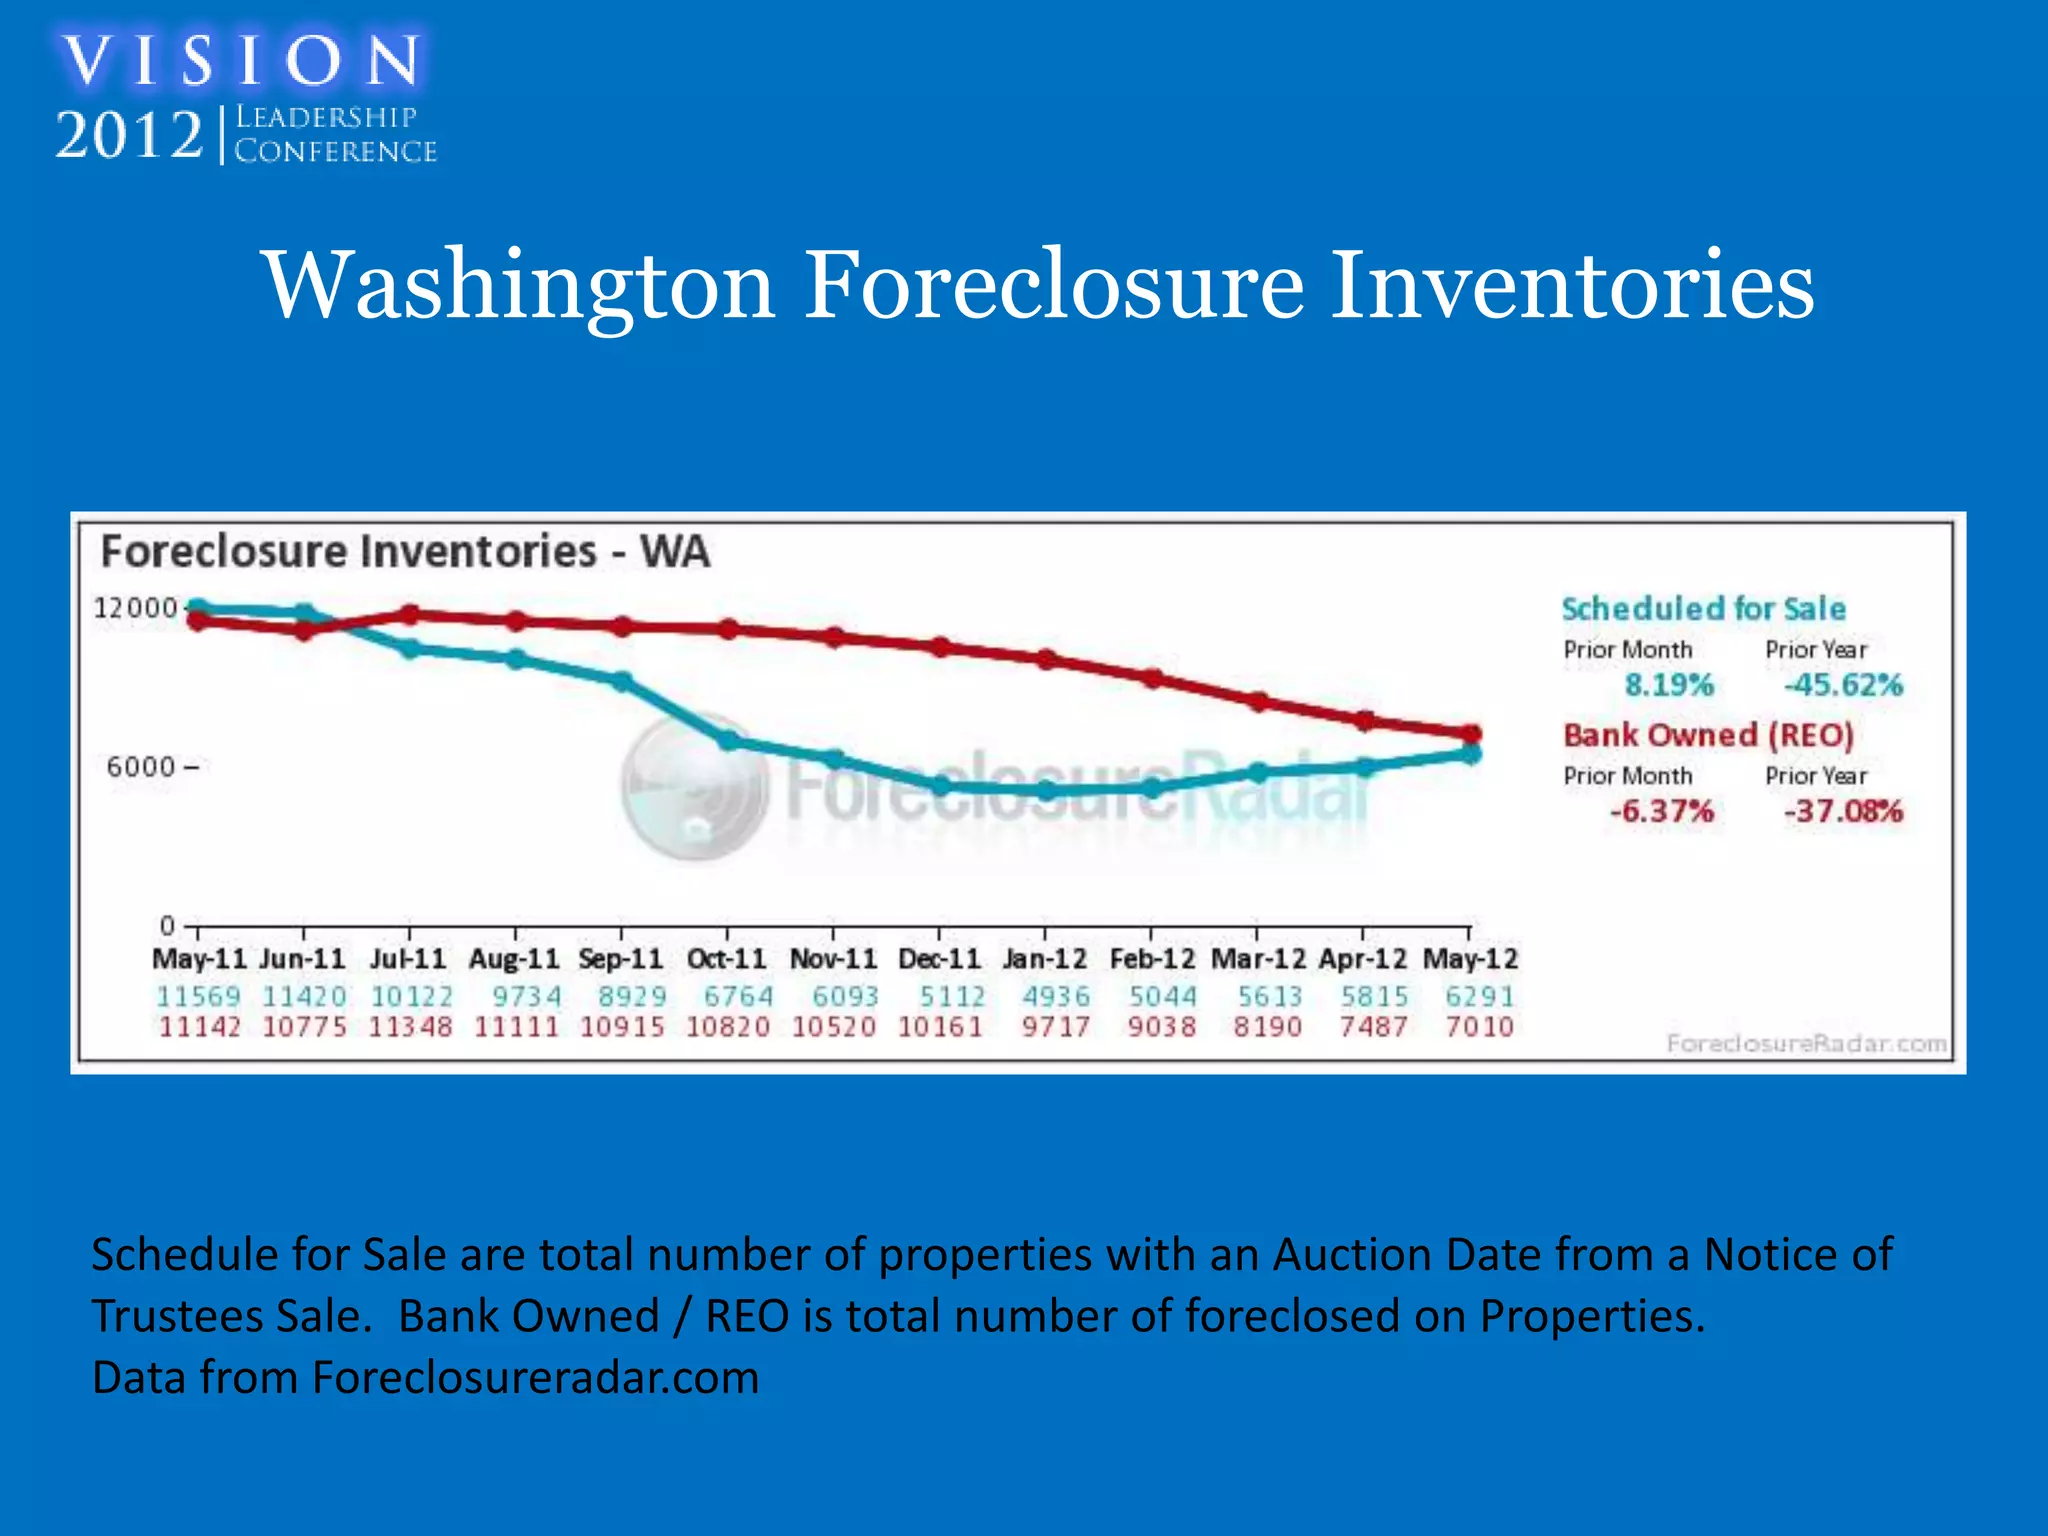
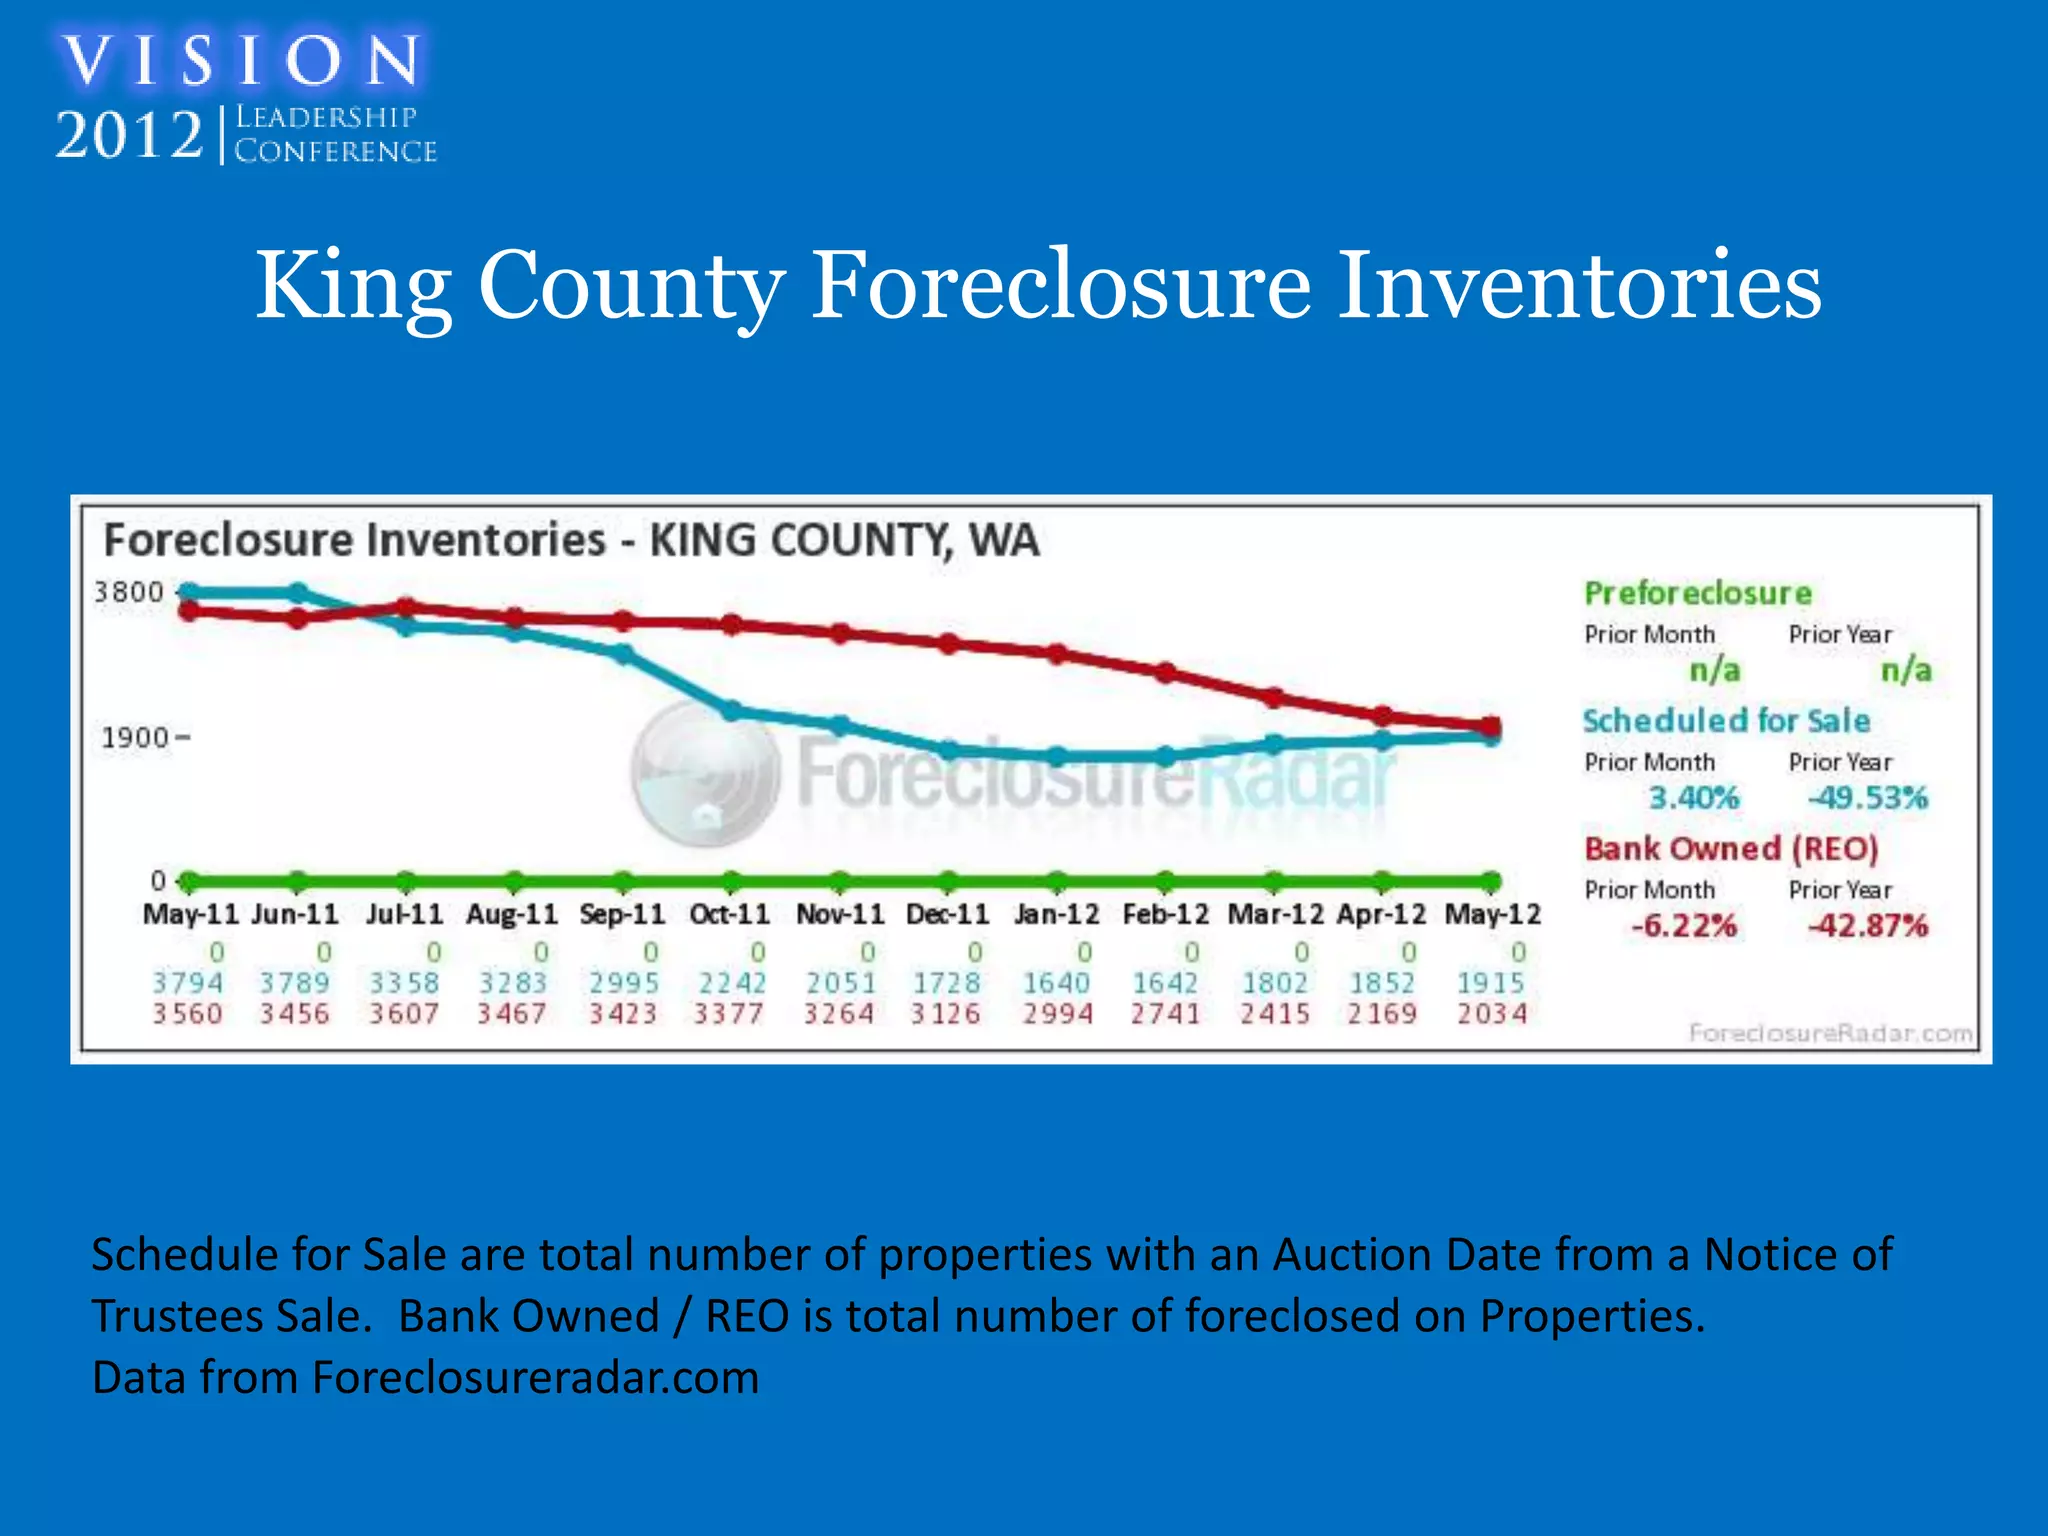
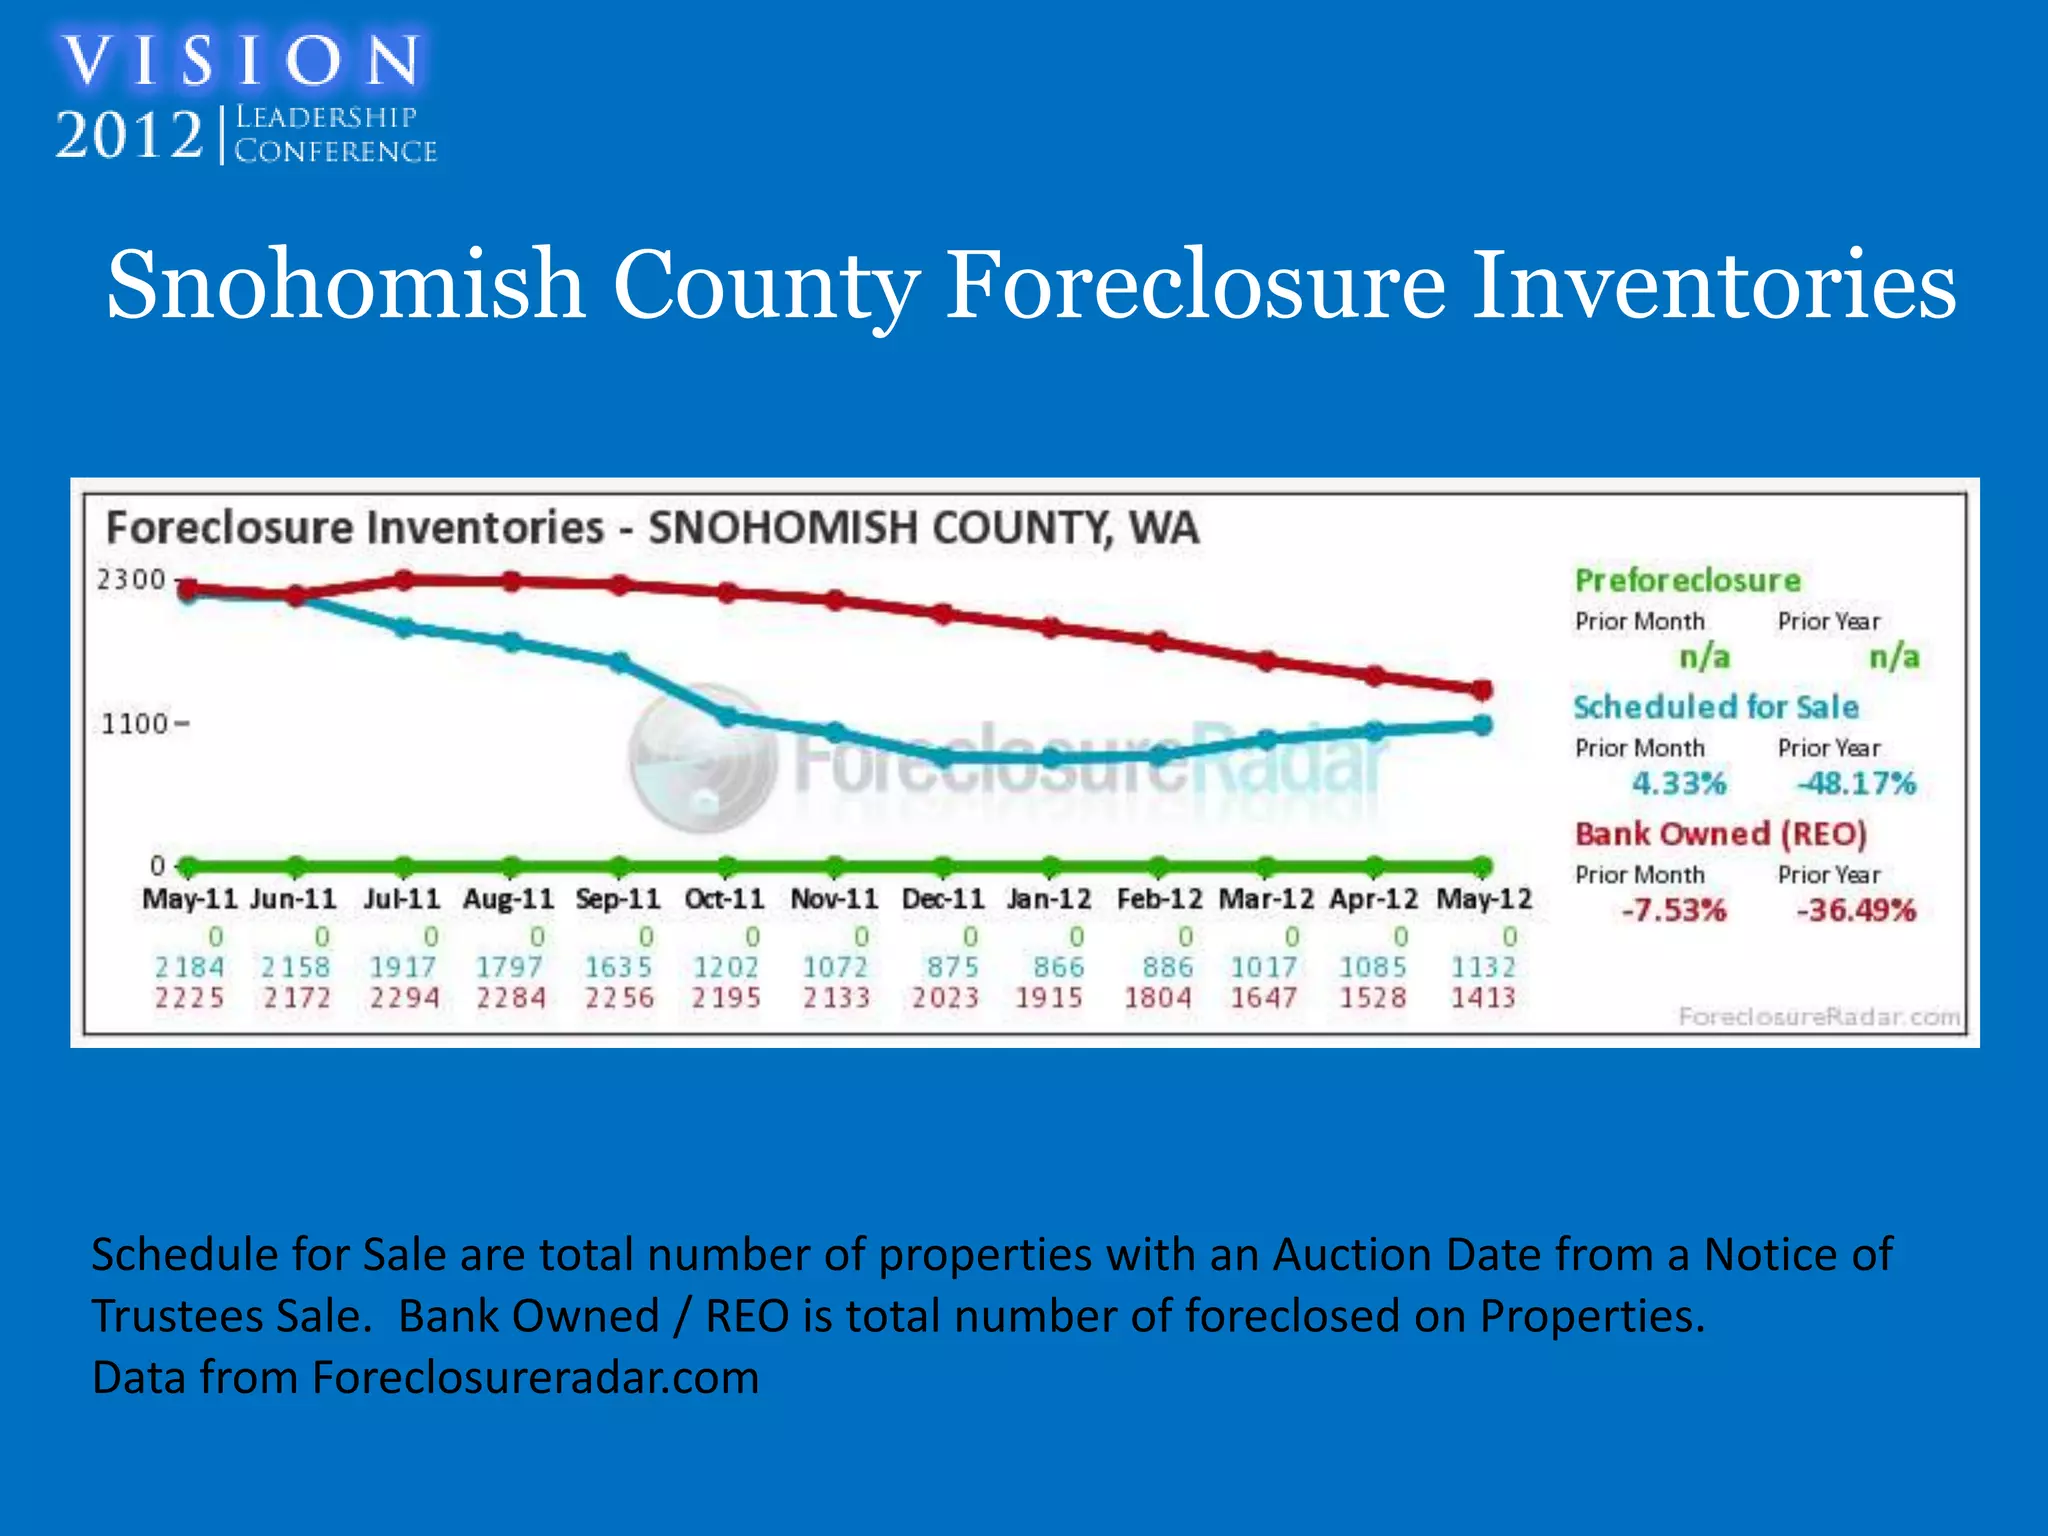
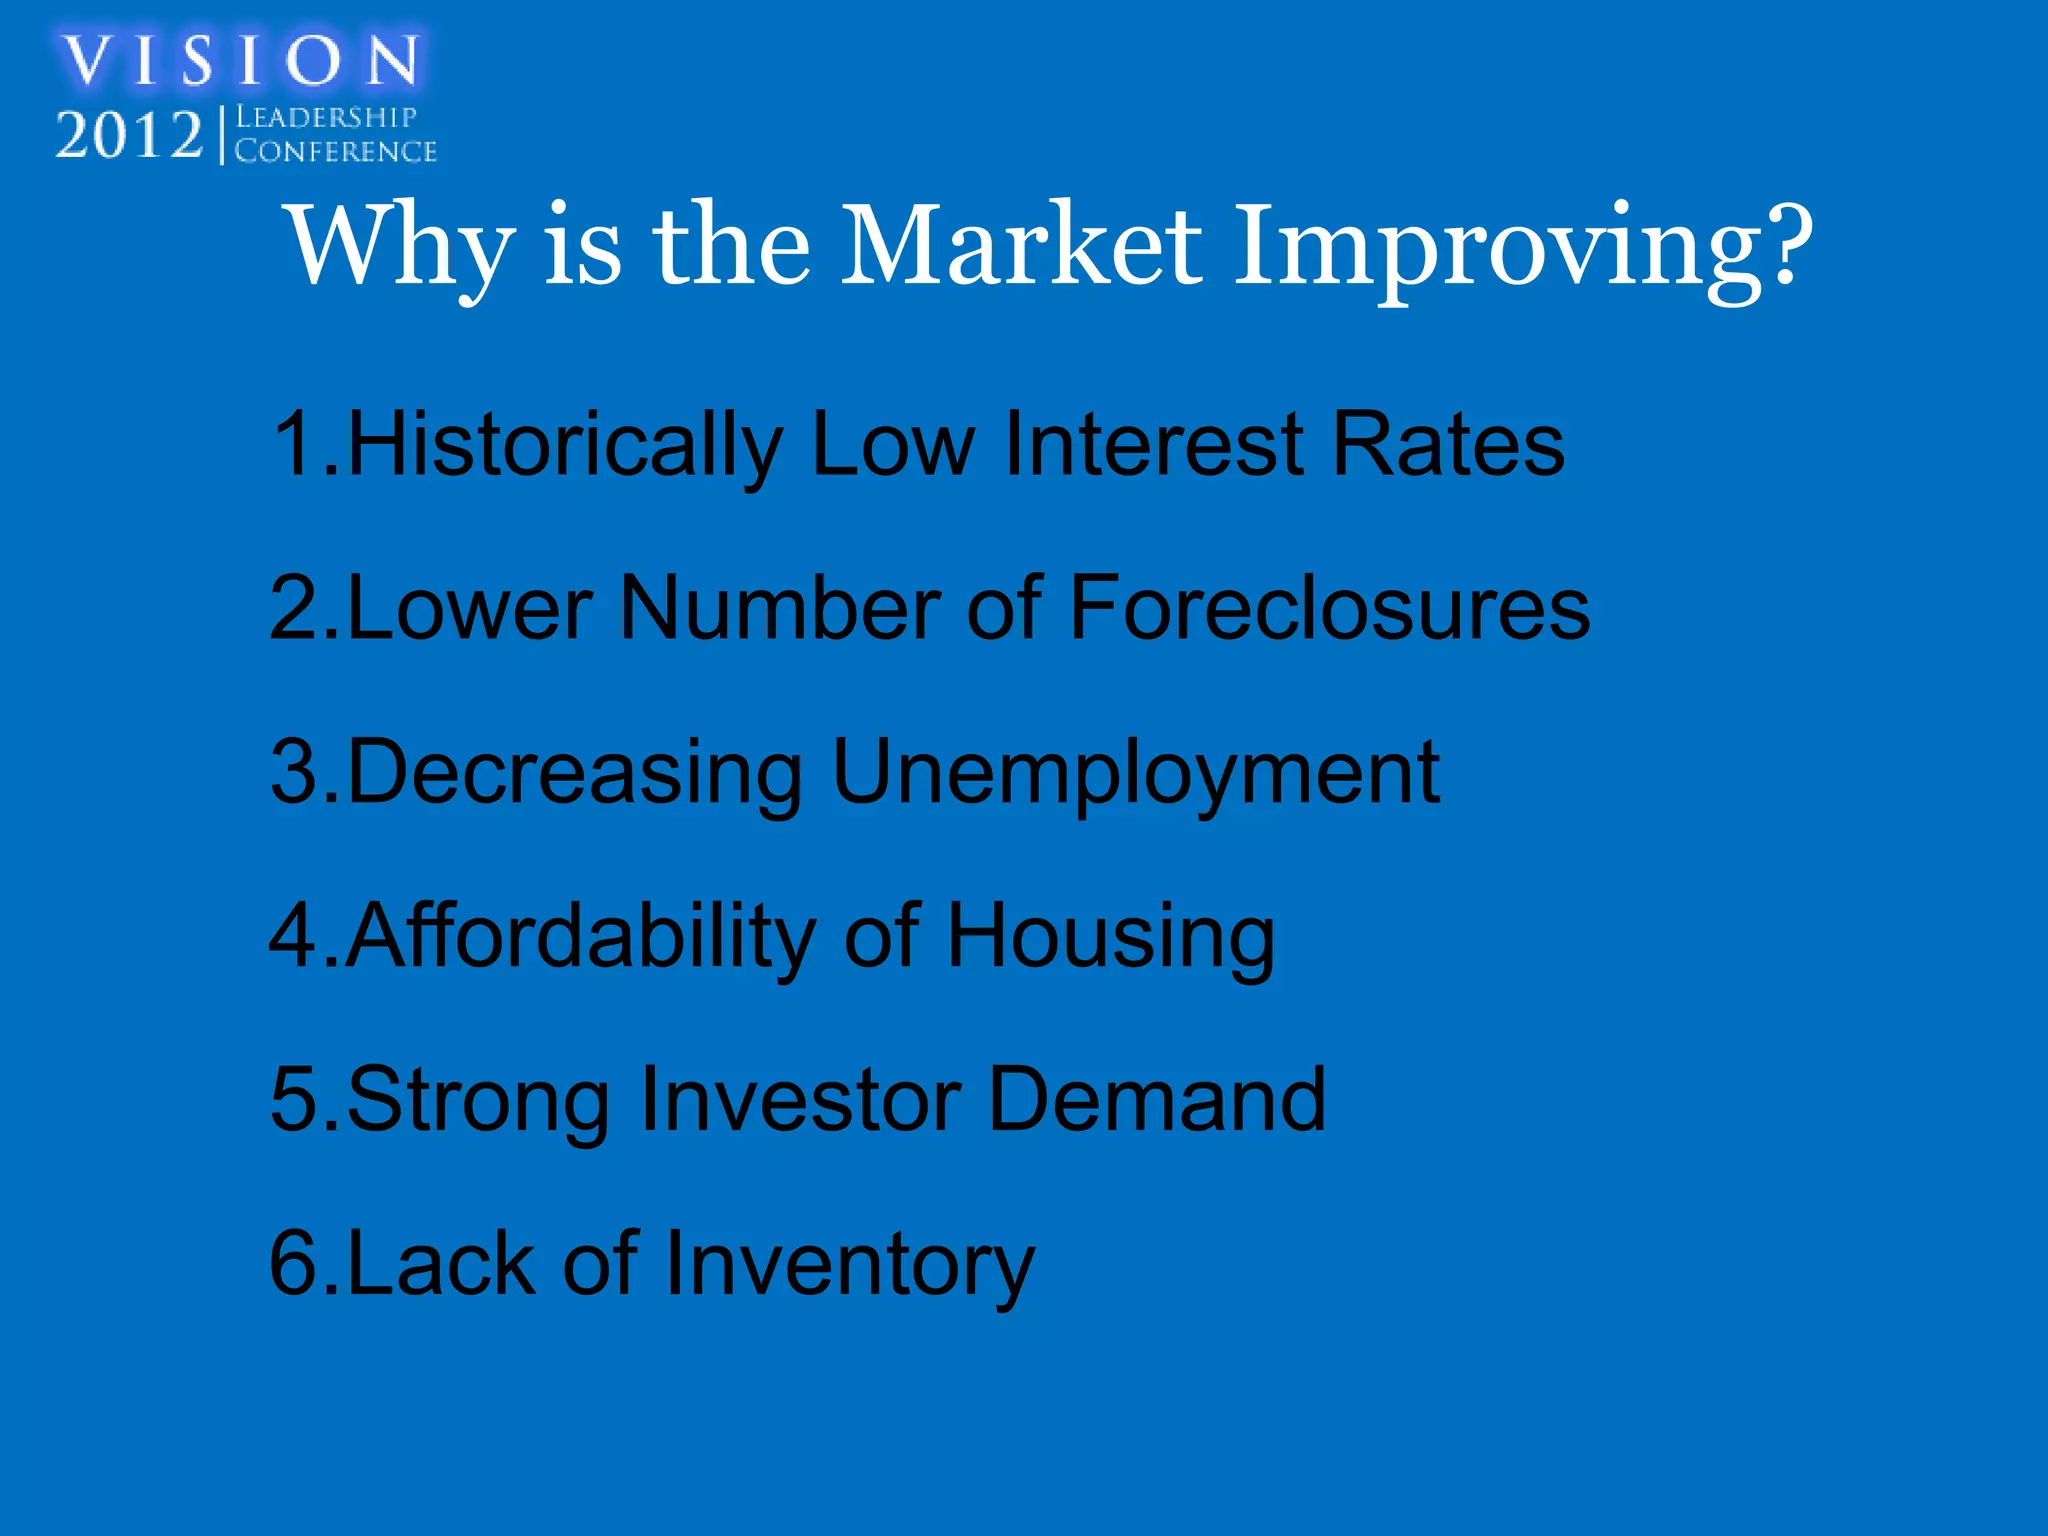


The economic update presents key data on U.S. GDP growth, unemployment rates, and housing market trends, highlighting a current U.S. unemployment rate of 7.9% and lower rates in various Washington counties. It outlines factors contributing to market improvement, such as low interest rates and declining foreclosures. Data is sourced from various real estate and statistical organizations, emphasizing changes in housing inventory and sales across Washington State.


