Download to read offline

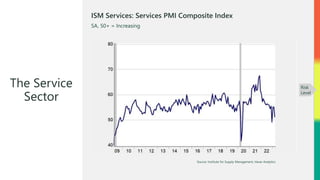
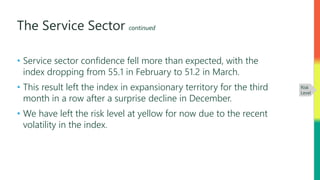
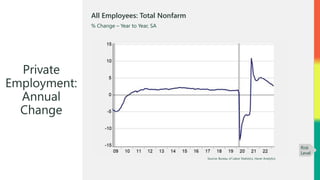
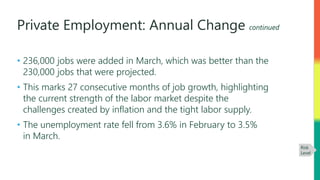
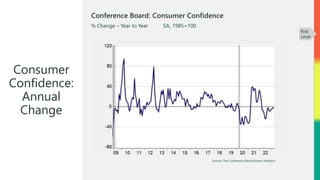
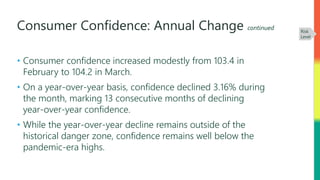
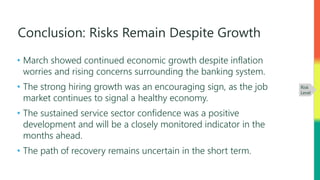

In March 2023, the service sector confidence index fell to 51.2, indicating modest expansion but recent volatility kept the risk level at yellow. Job growth continued with 236,000 jobs added, showing strength in the labor market despite inflation concerns, while the unemployment rate dropped to 3.5%. Consumer confidence saw a slight increase to 104.2, yet it marked a 13-month decline year-over-year, underlining ongoing economic risks despite signs of growth.
![Economic Risk Factor Update: May 2023 [SlideShare]](https://cdn.slidesharecdn.com/ss_thumbnails/economicriskfactorupdatemay2023-230510134611-1a672de5-thumbnail.jpg?width=640&height=640&fit=bounds)
![Economic Risk Factor Update: March 2023 [SlideShare]](https://cdn.slidesharecdn.com/ss_thumbnails/economicriskfactorupdatemarch2023-230314161429-1d4fab6a-thumbnail.jpg?width=640&height=640&fit=bounds)
![Economic Risk Factor Update: February 2023 [SlideShare]](https://cdn.slidesharecdn.com/ss_thumbnails/economicriskfactorupdatefeburary2023rlam-230208172904-cd6e86be-thumbnail.jpg?width=640&height=640&fit=bounds)
![Economic Risk Factor Update: January 2023 [SlideShare]](https://cdn.slidesharecdn.com/ss_thumbnails/economicriskfactorupdatejanuary2023-230111180647-387605c3-thumbnail.jpg?width=640&height=640&fit=bounds)
![Economic Risk Factor Update: June 2023 [SlideShare]](https://cdn.slidesharecdn.com/ss_thumbnails/economicriskfactorupdatejune2023-230607164130-edf07dd5-thumbnail.jpg?width=640&height=640&fit=bounds)
![Economic Risk Factor Update: October 2023 [SlideShare]](https://cdn.slidesharecdn.com/ss_thumbnails/economicriskfactorupdateoctober2023am-231011151056-66e85714-thumbnail.jpg?width=640&height=640&fit=bounds)
![Economic Risk Factor Update: August 2023 [SlideShare]](https://cdn.slidesharecdn.com/ss_thumbnails/economicriskfactorupdateaugust2023am-230816184852-13dbaeea-thumbnail.jpg?width=640&height=640&fit=bounds)
![Economic Risk Factor Update: December 2022 [SlideShare]](https://cdn.slidesharecdn.com/ss_thumbnails/economicriskfactorupdatedecember2022-221215184601-a4c55ce0-thumbnail.jpg?width=640&height=640&fit=bounds)
![Economic Risk Factor Update: September 2023 [SlideShare]](https://cdn.slidesharecdn.com/ss_thumbnails/economicriskfactorupdateseptember2023am-230906173934-b5fa365e-thumbnail.jpg?width=640&height=640&fit=bounds)
![Economic Risk Factor Update: April 2024 [SlideShare]](https://cdn.slidesharecdn.com/ss_thumbnails/economicriskfactorupdateapril2024am-240417130922-b8ca38a5-thumbnail.jpg?width=640&height=640&fit=bounds)
![Economic Risk Factor Update: November 2022 [SlideShare]](https://cdn.slidesharecdn.com/ss_thumbnails/economicriskfactorupdatenovember2022amkf-221115155738-ea360603-thumbnail.jpg?width=640&height=640&fit=bounds)
![Economic Risk Factor Update: March 2024 [SlideShare]](https://cdn.slidesharecdn.com/ss_thumbnails/economicriskfactorupdatemarch2024am-240313133142-2574fc7f-thumbnail.jpg?width=640&height=640&fit=bounds)
![Economic Risk Factor Update: May 2024 [SlideShare]](https://cdn.slidesharecdn.com/ss_thumbnails/economicriskfactorupdatemay2024am-240515130440-74d66100-thumbnail.jpg?width=640&height=640&fit=bounds)
![Economic Risk Factor Update: January 2024 [SlideShare]](https://cdn.slidesharecdn.com/ss_thumbnails/economicriskfactorupdatejanuary2024am-240110150920-3ad906d7-thumbnail.jpg?width=640&height=640&fit=bounds)
![Economic Risk Factor Update: October 2022 [SlideShare]](https://cdn.slidesharecdn.com/ss_thumbnails/economicriskfactorupdateoctober2022rlkfam-221012174700-98da4480-thumbnail.jpg?width=640&height=640&fit=bounds)
![Economic Risk Factor Update: September 2022 [SlideShare]](https://cdn.slidesharecdn.com/ss_thumbnails/economicriskfactorupdateseptember2022-220908190947-72948a4f-thumbnail.jpg?width=640&height=640&fit=bounds)
![Economic Risk Factor Update: July 2023 [SlideShare]](https://cdn.slidesharecdn.com/ss_thumbnails/economicriskfactorupdatejuly2023-230712140125-f973b1c9-thumbnail.jpg?width=640&height=640&fit=bounds)
![Economic Risk Factor Update: February 2024 [SlideShare]](https://cdn.slidesharecdn.com/ss_thumbnails/economicriskfactorupdatefebruary2024am-240207153630-0724fa23-thumbnail.jpg?width=640&height=640&fit=bounds)
![Economic Risk Factor Update: December 2023 [SlideShare]](https://cdn.slidesharecdn.com/ss_thumbnails/economicriskfactorupdatedecember2023am-231213134840-5e762269-thumbnail.jpg?width=640&height=640&fit=bounds)
![Economic Risk Factor Update: June 2024 [SlideShare]](https://cdn.slidesharecdn.com/ss_thumbnails/economicriskfactorupdatejune2024am-240612135955-62fda29d-thumbnail.jpg?width=640&height=640&fit=bounds)
![Economic Risk Factor Update: November 2023 [SlideShare]](https://cdn.slidesharecdn.com/ss_thumbnails/economicriskfactorupdatenovember2023am-231108133417-ef934499-thumbnail.jpg?width=640&height=640&fit=bounds)
![Economic Risk Factor Update: August 2024 [SlideShare]](https://cdn.slidesharecdn.com/ss_thumbnails/economicriskfactorupdateaugust2024am-240815171155-2612b755-thumbnail.jpg?width=640&height=640&fit=bounds)
![Economic Risk Factor Update: September 2024 [SlideShare]](https://cdn.slidesharecdn.com/ss_thumbnails/economicriskfactorupdateseptember2024am-240911134348-d9aeec3f-thumbnail.jpg?width=640&height=640&fit=bounds)
![Economic Risk Factor Update: July 2024 [SlideShare]](https://cdn.slidesharecdn.com/ss_thumbnails/economicriskfactorupdatejuly2024am-240712130225-147b17c8-thumbnail.jpg?width=640&height=640&fit=bounds)
![Economic Risk Factor Update: October 2024 [SlideShare]](https://cdn.slidesharecdn.com/ss_thumbnails/economicriskfactorupdateoctober2024am-241009015353-d2831b2a-thumbnail.jpg?width=640&height=640&fit=bounds)
![Monthly Market Risk Update: March 2023 [SlideShare]](https://cdn.slidesharecdn.com/ss_thumbnails/monthlymarketriskupdatemarch2023-230316184503-55129960-thumbnail.jpg?width=640&height=640&fit=bounds)
![Monthly Market Risk Update: May 2023 [SlideShare]](https://cdn.slidesharecdn.com/ss_thumbnails/monthlymarketriskupdatemay2023-230517141602-38346c0d-thumbnail.jpg?width=640&height=640&fit=bounds)
![Monthly Market Risk Update: June 2023 [SlideShare]](https://cdn.slidesharecdn.com/ss_thumbnails/monthlymarketriskupdatejune2023-230614154355-e99841d6-thumbnail.jpg?width=640&height=640&fit=bounds)
![Monthly Market Risk Update: October 2024 [SlideShare]](https://cdn.slidesharecdn.com/ss_thumbnails/monthlymarketriskupdateoct2024am-241016133219-d645282f-thumbnail.jpg?width=640&height=640&fit=bounds)
![Monthly Market Risk Update: September 2024 [SlideShare]](https://cdn.slidesharecdn.com/ss_thumbnails/monthlymarketriskupdatesept2024am-240918134147-6b6cc9a3-thumbnail.jpg?width=640&height=640&fit=bounds)
![Monthly Market Risk Update: August 2024 [SlideShare]](https://cdn.slidesharecdn.com/ss_thumbnails/monthlymarketriskupdateaugust2024am-240821135054-bcf05ed7-thumbnail.jpg?width=640&height=640&fit=bounds)
![Monthly Market Risk Update: July 2024 [SlideShare]](https://cdn.slidesharecdn.com/ss_thumbnails/monthlymarketriskupdatejuly2024am-240717142310-0da22cfe-thumbnail.jpg?width=640&height=640&fit=bounds)
![Monthly Market Risk Update: June 2024 [SlideShare]](https://cdn.slidesharecdn.com/ss_thumbnails/monthlymarketriskupdatejune2024am-pf2ka417-240618125718-421c825a-thumbnail.jpg?width=640&height=640&fit=bounds)
![Monthly Market Risk Update: May 2024 [SlideShare]](https://cdn.slidesharecdn.com/ss_thumbnails/monthlymarketriskupdatemay2024am-240522122148-e521348e-thumbnail.jpg?width=640&height=640&fit=bounds)
![Monthly Market Risk Update: April 2024 [SlideShare]](https://cdn.slidesharecdn.com/ss_thumbnails/monthlymarketriskupdateapril2024am-240424140359-342f2410-thumbnail.jpg?width=640&height=640&fit=bounds)
![Monthly Market Risk Update: March 2024 [SlideShare]](https://cdn.slidesharecdn.com/ss_thumbnails/monthlymarketriskupdatefebruary2024am-240320140945-833de20e-thumbnail.jpg?width=640&height=640&fit=bounds)
![Monthly Market Risk Update: February 2024 [SlideShare]](https://cdn.slidesharecdn.com/ss_thumbnails/monthlymarketriskupdatefebruary2024-240214182605-2944667c-thumbnail.jpg?width=640&height=640&fit=bounds)
![Monthly Market Risk Update: January 2024 [SlideShare]](https://cdn.slidesharecdn.com/ss_thumbnails/monthlymarketriskupdatejanuary2024-240117184430-04ccf529-thumbnail.jpg?width=640&height=640&fit=bounds)
![Monthly Market Risk Update: December 2023 [SlideShare]](https://cdn.slidesharecdn.com/ss_thumbnails/monthlymarketriskupdatedecember2023-231220143729-32260328-thumbnail.jpg?width=640&height=640&fit=bounds)
![Monthly Market Risk Update: November 2023 [SlideShare]](https://cdn.slidesharecdn.com/ss_thumbnails/monthlymarketriskupdatenovember2023-231115143226-35f33125-thumbnail.jpg?width=640&height=640&fit=bounds)
![Monthly Market Risk Update: October 2023 [SlideShare]](https://cdn.slidesharecdn.com/ss_thumbnails/monthlymarketriskupdateoctober2023-231018170735-6202cf20-thumbnail.jpg?width=640&height=640&fit=bounds)
![Monthly Market Risk Update: September 2023 [SlideShare]](https://cdn.slidesharecdn.com/ss_thumbnails/monthlymarketriskupdateseptember2023-230912213959-e48e736b-thumbnail.jpg?width=640&height=640&fit=bounds)
![Monthly Market Risk Update: August 2023 [SlideShare]](https://cdn.slidesharecdn.com/ss_thumbnails/monthlymarketriskupdateaugust2023-230823125440-082a056b-thumbnail.jpg?width=640&height=640&fit=bounds)


