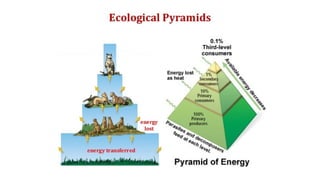
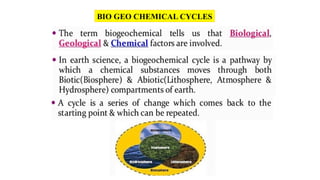
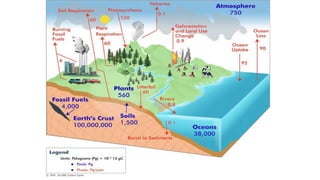
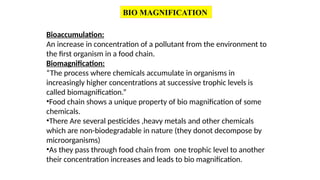
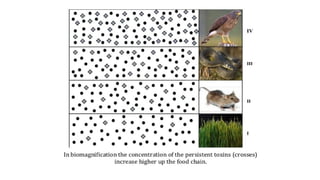
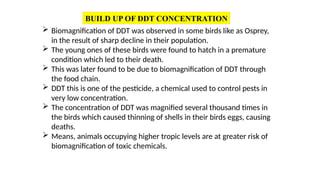
ECOLOGICAL PYRAMIDS
Features of the Ecological Pyramid
 The ecological pyramid comprises two to four layers.
 Organisms that are dependent on the same type of food sources are
placed at the same level.
 The producers are situated at the lowest level of an ecological
pyramid with a huge population.
 The apex predators exist at the topmost level of an ecological
pyramid with a relatively smaller population.
 The pointed shape of the pyramid is due to the fact that the supply
of energy or biomass becomes lesser with each passing level of the
pyramid.
 In the case of the pyramid of numbers, the topmost level will have a
lesser number of individuals but their relative body size and volume
increase
PYRAMIDS OF NUMBERS
The Pyramid of Number denotes the total number of living individuals
at various trophic levels in an ecological system. The producers are at
the base and top carnivores at the topmost level in this pyramid.
The pyramid of numbers can be both upright and inverted.
 The upright pyramid has the largest number of producers at the base and
their numbers keep on declining with each passing level like pond or
grassland ecosystem.
 In the inverted pyramid, the base pointed with a lesser number of
producers whereas the topmost level will have the largest number of
individuals as the size and food consumption of organisms in each level
will decrease i.e. in this system one individual producer can support many
primary consumers, similarly, one primary consumer can support many
secondary consumers, and so on. This type of pyramid is seen in the case
of a parasitic food chain.
PYRAMIDS OF BIO MASS
PYRAMIDS OF ENERGY
 The ecological pyramid which is formed by determining the
flow of energy from one trophic level to another is known as
the pyramid of energy.
 The producers situated at the base of the pyramid of energy
have the highest amount of energy and the topmost
consumer at the top has the least amount of energy.
 The pyramid of energy is always upright. This pyramid
addresses the complete energy content of each trophic
level in an ecological system.
 The base of this pyramid i.e. producers has the most
amount of energy acquired from the sun fixed by the help
of photosynthesis.
 The flow of energy in this pyramid proves that energy can
neither be created nor can be destroyed given by the law
of thermodynamics.
 However, as indicated by Lindeman’s 10% regulation law,
only 10% of the energy gets transferred from one level to
another as almost the 90% is lost as heat energy is used in
breathing, some are utilized in physiological cycles, and
the rest is utilized by decomposers.
Importance Ecological Pyramid
 An ecological pyramid takes into account the dietary patterns of
various living organisms.
 The ecological pyramids take into account the number of living
creatures in an ecosystem.
 It gives clarity of how much energy moved to start with one
trophic level and then onto the next level of the ecosystem.
 It gives data about the biodiversity of a region.
 The ecological pyramid is framed based on the food-consumer
relationship.
 If the food chain order is disturbed, the biological pyramid will be
disturbed and the entire environment will be seriously harmed.
 It helps in keeping up with equilibrium and helps in checking the
entire state of a biological ecosystem.
BIO GEO CHEMICAL CYCLES
TYPES OF BIO GEO CHEMICAL CYCLES
SEDIMENTARY CYCLE-Sedimentary cycle include the
leaching of minerals & salt’s from the earth’s crust, which
they settle as sediment or rock before the cycle repeats.
Sedimentary cycle includes;
a) PHOSPHORUS CYCLE
b) SULPHUR CYCLE
c) IRON CYCLE
d) CALCIUM CYCLE
• Sedimentary cycle vary from one elements to another, but each cycle
consist fundamentally of a solution phase & a sediment phase.
NITROGEN CYCLE
PROCESS OF NITROGEN CYCLE
PHOSPOROUS CYCLE
PROCESS OF PHOSPOROUS CYCLE
CARBON CYCLE
One of the most complex cycles on Earth
•Carbon just like all other nutrients cycles from
one reservoir to another through many years.
•Eg: Carbon enters plants as CO2 which is
incorporated into organic molecules by a
process called photosynthesis
•When organisms respire, a portion of this
carbon is returned to the atmosphere as CO2
CARBON CYCLES
Bioaccumulation:
An increase in concentration of a pollutant from the environment to
the first organism in a food chain.
Biomagnification:
“The process where chemicals accumulate in organisms in
increasingly higher concentrations at successive trophic levels is
called biomagnification.”
•Food chain shows a unique property of bio magnification of some
chemicals.
•There Are several pesticides ,heavy metals and other chemicals
which are non-biodegradable in nature (they donot decompose by
microorganisms)
•As they pass through food chain from one trophic level to another
their concentration increases and leads to bio magnification.
BIO MAGNIFICATION
•Biomagnification results in storage of such toxic chemicals in
organisms in higher concentrations than are normally found in the
environment.
•As you move up the food pyramid energy may go down but pesticide
accumulation goes up.
•In order for bioaccumulation to occur, the pollutant must be:
Long-lived
Mobile
Soluble in fats
Biologically active
BIO MAGNIFICATION
BUILD UP OF DDT CONCENTRATION
 Biomagnification of DDT was observed in some birds like as Osprey,
in the result of sharp decline in their population.
 The young ones of these birds were found to hatch in a premature
condition which led to their death.
 This was later found to be due to biomagnification of DDT through
the food chain.
 DDT this is one of the pesticide, a chemical used to control pests in
very low concentration.
 The concentration of DDT was magnified several thousand times in
the birds which caused thinning of shells in their birds eggs, causing
deaths.
 Means, animals occupying higher tropic levels are at greater risk of
biomagnification of toxic chemicals.
Performing of photosynthesis (in which solar energy is captured by
primary producers and converts into chemical energy)
 Maintenance of the Bio – Geo Chemical Cycles
Maintains of Hydrological Cycle or Water cycle including
purification
 Cycling of vital chemicals like Carbon, Nitrogen, Phosphorus, and
Sulphur
 Control of Climate
Absorbing of CO2 from atmosphere.
Purifying air by releasing oxygen
Treating waste water
Conserving soil , creating soil ,building up organic matter and
preventing soil erosion.
ECO –SYSTEM SERVICES & VALUES
ECO –SYSTEM SERVICES
•Waste Removal and Detoxification
•Natural pest and Disease Control
•Providing habitat
•Control of pest
•Control of population
•Proving food ,medicines ,fuel ,fertilizers ,industrial raw materials
etc
•Maintenance of food chains, food webs, ecological pyramids etc.
Values: A team of ecologists, economists and geographers have tries to
answer this question.
•The team first divided the Earth’s surface into 16 major biomes and
aquatic life zones.
•They have listed 17 goods and services provided by nature in each of
these areas and examined over 100 studies that have to put a money
value on such services
•Finally they came up with an estimate of the monetary value of eco –
system services
•Their conclusion was that the eco – system services were worth more
than US$ 36 trillion per annum.
•This is comparable to the annual Gross World Product that is estimated
to US $ 39 trillion.
•Some experts believe that this is a conservative figure and that the real
worth of nature could be much more, even a million times more.
ECOSYSTEM VALUES
ECOLOGICAL PYRAMIDS from Environmental Science

ECOLOGICAL PYRAMIDS from Environmental Science

  • 1.
  • 2.
    Features of theEcological Pyramid  The ecological pyramid comprises two to four layers.  Organisms that are dependent on the same type of food sources are placed at the same level.  The producers are situated at the lowest level of an ecological pyramid with a huge population.  The apex predators exist at the topmost level of an ecological pyramid with a relatively smaller population.  The pointed shape of the pyramid is due to the fact that the supply of energy or biomass becomes lesser with each passing level of the pyramid.  In the case of the pyramid of numbers, the topmost level will have a lesser number of individuals but their relative body size and volume increase
  • 4.
    PYRAMIDS OF NUMBERS ThePyramid of Number denotes the total number of living individuals at various trophic levels in an ecological system. The producers are at the base and top carnivores at the topmost level in this pyramid.
  • 5.
    The pyramid ofnumbers can be both upright and inverted.  The upright pyramid has the largest number of producers at the base and their numbers keep on declining with each passing level like pond or grassland ecosystem.  In the inverted pyramid, the base pointed with a lesser number of producers whereas the topmost level will have the largest number of individuals as the size and food consumption of organisms in each level will decrease i.e. in this system one individual producer can support many primary consumers, similarly, one primary consumer can support many secondary consumers, and so on. This type of pyramid is seen in the case of a parasitic food chain.
  • 7.
  • 9.
    PYRAMIDS OF ENERGY The ecological pyramid which is formed by determining the flow of energy from one trophic level to another is known as the pyramid of energy.  The producers situated at the base of the pyramid of energy have the highest amount of energy and the topmost consumer at the top has the least amount of energy.
  • 10.
     The pyramidof energy is always upright. This pyramid addresses the complete energy content of each trophic level in an ecological system.  The base of this pyramid i.e. producers has the most amount of energy acquired from the sun fixed by the help of photosynthesis.  The flow of energy in this pyramid proves that energy can neither be created nor can be destroyed given by the law of thermodynamics.  However, as indicated by Lindeman’s 10% regulation law, only 10% of the energy gets transferred from one level to another as almost the 90% is lost as heat energy is used in breathing, some are utilized in physiological cycles, and the rest is utilized by decomposers.
  • 11.
    Importance Ecological Pyramid An ecological pyramid takes into account the dietary patterns of various living organisms.  The ecological pyramids take into account the number of living creatures in an ecosystem.  It gives clarity of how much energy moved to start with one trophic level and then onto the next level of the ecosystem.  It gives data about the biodiversity of a region.  The ecological pyramid is framed based on the food-consumer relationship.  If the food chain order is disturbed, the biological pyramid will be disturbed and the entire environment will be seriously harmed.  It helps in keeping up with equilibrium and helps in checking the entire state of a biological ecosystem.
  • 14.
  • 17.
    TYPES OF BIOGEO CHEMICAL CYCLES
  • 18.
    SEDIMENTARY CYCLE-Sedimentary cycleinclude the leaching of minerals & salt’s from the earth’s crust, which they settle as sediment or rock before the cycle repeats. Sedimentary cycle includes; a) PHOSPHORUS CYCLE b) SULPHUR CYCLE c) IRON CYCLE d) CALCIUM CYCLE • Sedimentary cycle vary from one elements to another, but each cycle consist fundamentally of a solution phase & a sediment phase.
  • 19.
  • 20.
  • 23.
  • 24.
  • 27.
    CARBON CYCLE One ofthe most complex cycles on Earth
  • 28.
    •Carbon just likeall other nutrients cycles from one reservoir to another through many years. •Eg: Carbon enters plants as CO2 which is incorporated into organic molecules by a process called photosynthesis •When organisms respire, a portion of this carbon is returned to the atmosphere as CO2 CARBON CYCLES
  • 30.
    Bioaccumulation: An increase inconcentration of a pollutant from the environment to the first organism in a food chain. Biomagnification: “The process where chemicals accumulate in organisms in increasingly higher concentrations at successive trophic levels is called biomagnification.” •Food chain shows a unique property of bio magnification of some chemicals. •There Are several pesticides ,heavy metals and other chemicals which are non-biodegradable in nature (they donot decompose by microorganisms) •As they pass through food chain from one trophic level to another their concentration increases and leads to bio magnification. BIO MAGNIFICATION
  • 31.
    •Biomagnification results instorage of such toxic chemicals in organisms in higher concentrations than are normally found in the environment. •As you move up the food pyramid energy may go down but pesticide accumulation goes up. •In order for bioaccumulation to occur, the pollutant must be: Long-lived Mobile Soluble in fats Biologically active BIO MAGNIFICATION
  • 33.
    BUILD UP OFDDT CONCENTRATION  Biomagnification of DDT was observed in some birds like as Osprey, in the result of sharp decline in their population.  The young ones of these birds were found to hatch in a premature condition which led to their death.  This was later found to be due to biomagnification of DDT through the food chain.  DDT this is one of the pesticide, a chemical used to control pests in very low concentration.  The concentration of DDT was magnified several thousand times in the birds which caused thinning of shells in their birds eggs, causing deaths.  Means, animals occupying higher tropic levels are at greater risk of biomagnification of toxic chemicals.
  • 34.
    Performing of photosynthesis(in which solar energy is captured by primary producers and converts into chemical energy)  Maintenance of the Bio – Geo Chemical Cycles Maintains of Hydrological Cycle or Water cycle including purification  Cycling of vital chemicals like Carbon, Nitrogen, Phosphorus, and Sulphur  Control of Climate Absorbing of CO2 from atmosphere. Purifying air by releasing oxygen Treating waste water Conserving soil , creating soil ,building up organic matter and preventing soil erosion. ECO –SYSTEM SERVICES & VALUES
  • 35.
    ECO –SYSTEM SERVICES •WasteRemoval and Detoxification •Natural pest and Disease Control •Providing habitat •Control of pest •Control of population •Proving food ,medicines ,fuel ,fertilizers ,industrial raw materials etc •Maintenance of food chains, food webs, ecological pyramids etc.
  • 36.
    Values: A teamof ecologists, economists and geographers have tries to answer this question. •The team first divided the Earth’s surface into 16 major biomes and aquatic life zones. •They have listed 17 goods and services provided by nature in each of these areas and examined over 100 studies that have to put a money value on such services •Finally they came up with an estimate of the monetary value of eco – system services •Their conclusion was that the eco – system services were worth more than US$ 36 trillion per annum. •This is comparable to the annual Gross World Product that is estimated to US $ 39 trillion. •Some experts believe that this is a conservative figure and that the real worth of nature could be much more, even a million times more. ECOSYSTEM VALUES