Ecolab achieved record sales, earnings, gross profit, and return on equity in 1997. Key accomplishments included launching over 135 new products and services, completing seven acquisitions, and expanding services into the $700 million vehicle wash market in the US. Net income increased 18% to $134 million and earnings per share grew 18% to $1.00. The stock price increased 47% for the year, well above the S&P 500 index.
Ecolab achieved record financial performance in 1998, with sales increasing 15% to $1.9 billion and income from continuing operations rising 15% to $155 million. They strengthened their business through strategic acquisitions that expanded their product offerings and geographic coverage. Ecolab's stock price increased 31% in 1998, outperforming the S&P 500 for the fourth consecutive year, reflecting the company's strong financial results and dedicated employee efforts.
Ecolab had a successful year in 2004, achieving record financial performance and introducing innovative new products. Doug Baker became the new CEO on July 1, replacing Al Schuman who remained chairman of the board. Ecolab acquired several companies to expand its service offerings and focused on growing its global sales force. Looking ahead, Ecolab aims to continue driving growth through new products and services, global expansion, and outstanding customer service.
Amcor is a global packaging company committed to sustainability. It focuses on continuously improving environmental performance across its sites through programs like EnviroAction. Amcor also works with suppliers and customers to reduce impacts across the value chain, such as increasing recycling and reducing litter. Amcor conducts life cycle assessments using its proprietary software to evaluate packaging options and minimize environmental impacts over a product's full life cycle from raw materials to disposal.
The document outlines Affordable Bio Feedstock's business expansion plan from 2011-2013. It details their proprietary grease trap waste recycling process and plans to open 6 new plants in Florida to increase processing capacity. Their goal is to become a national leader in recycling grease trap waste into profitable brown grease, organic solids, and reclaimed water products. Financial projections estimate strong growth through new plant openings and contracts with major haulers and refineries. The company is raising $10 million to fund continued expansion plans.
The document outlines Affordable Bio Feedstock's business expansion plan from 2011-2013. It details their proprietary grease trap waste recycling process and plans to open 6 new plants across Florida to increase processing capacity to over 300,000 gallons per day. It also discusses revenue streams from tipping fees, brown grease and organic solids sales, and seeks $10 million in funding to support commercialization and expansion efforts.
The 2002 Annual Report of Ball Corporation summarizes the company's performance and strategic initiatives that year. Key points include:
1) Ball completed its largest international expansion by acquiring Schmalbach-Lubeca AG, the second largest beverage can manufacturer in Europe, for $925 million.
2) Other growth initiatives included expanding plastic container and food can production in North America. The aerospace segment was awarded its largest contract ever of over $200 million for the James Webb Space Telescope.
3) Financially, Ball generated over $290 million in free cash flow and its stock returned 46% to shareholders in price appreciation and dividends, growing its market capitalization to over $2.9
The document summarizes M. Stephen Enders' presentation to the Latin American Mining Congress on May 1, 2008 about Newmont Mining Corporation's growth in Latin America. It discusses Newmont's major projects including the Yanacocha gold mill commissioning in Peru, the Boddington project in Australia, and advanced projects at Conga in Peru and Akyem in Ghana. It also outlines Newmont's exploration activities in Latin America, with a $28.5 million budget for greenfields exploration, and Newmont's technical services capabilities.
This document provides an overview and discussion of GO Financial's operating results for 2004. Some key points:
- Net sales reached a record $4.2 billion in 2004, an increase of 11% over 2003, driven by both acquisitions and organic growth.
- Operating income grew 11% in 2004 compared to 2003, while net income per share grew 12% to $1.19.
- The company expects continued growth in 2005 through strategic acquisitions, leveraging investments in sales and service, and seeking new growth avenues. However, rising costs may pose challenges.
- Critical accounting policies requiring estimates include revenue recognition, allowances, actuarially determined liabilities, and income taxes
This document is a notice for the annual meeting of shareholders of Western Digital Corporation. It informs shareholders that the meeting will be held on November 29, 2001 at 10:00am at the DoubleTree Hotel in Irvine, California. The purposes of the meeting are to elect seven directors, approve an amendment to increase the number of authorized shares of common stock, and ratify the selection of KPMG LLP as the company's independent accountants. Shareholders are urged to vote for each proposal.
This document provides an overview of Barrick Gold's North American operations for 2007 and an outlook for 2008. In 2007, two mills produced 60% of Nevada sales. Sales were highest from the Twin Creeks Sage Autoclave (28%) and Phoenix Mill (32%). Safety rates improved year-over-year. Mill throughput also increased over time through continuous improvement efforts. For 2008, equity gold sales are expected to be between 2,275,000 - 2,400,000 ounces at a cost of $400-430 per ounce. Phoenix mill throughput is up 15% and its crusher will be replaced in mid-2008. Beyond 2008, Barrick aims to maintain its reserve base through exploration and leverage its infrastructure, scope
Russell Ball, CFO of Newmont Mining Corporation, presented an overview of the company's financial performance in 2007 and outlook for 2008. In 2007, equity gold sales were 5.3 million ounces, within the guidance range of 5.2-5.6 million ounces. Costs applicable to sales were $406 per ounce and capital expenditures totaled $1.7 billion, as expected. For 2008, the company forecasts equity gold sales of 5.1-5.4 million ounces and costs applicable to sales of $425-450 per ounce, with capital expenditures of $1.8-2 billion. Newmont also provided updates on the planned divestment of its interest in the Batu H
Ecolab Inc. reported strong financial results for 1998, exceeding goals for sales, earnings, and earnings per share. Net sales increased 15% to a record $1.888 billion, income from continuing operations rose 15% to $154.5 million, and diluted earnings per share increased 15% to $1.15. Ecolab strengthened its global leadership position through strategic acquisitions, investments in its global sales force, and introducing new innovative products, systems and services.
The document provides an overview of Newmont Ghana's African operations for 2008:
1) In 2007, Newmont Ghana completed initial mining ramp-up, self-performed drilling, optimized ore control, and implemented a mine dispatch system at its Ahafo mine.
2) For 2008, Newmont Ghana expects equity gold sales of 495,000-530,000 ounces at a cost of $485-$520 per ounce and $150-$155 million in capital expenditures.
3) Beyond 2008, Newmont Ghana plans to expand its Ahafo mine, optimally develop its Akyem mine, and focus on long-term power solutions and localization efforts to build a Ghanaian region.
Ecolab is a global leader in cleaning, sanitizing, food safety and infection control products and services. It was founded in 1923 and serves customers in over 160 countries across multiple industries. In 2006, Ecolab employed over 23,000 people worldwide and achieved $4.9 billion in net sales, a 15% increase in net income from 2005. Ecolab is committed to assisting customers with unique needs through comprehensive solutions and professional service.
This letter summarizes Ecolab's financial and operational achievements in 1996. Key points include achieving record sales and earnings growth, expanding market share, developing new products, acquiring companies, and increasing dividend payouts and stock price. The company also strengthened its field organization, entered new partnerships, and expanded manufacturing facilities globally. Looking ahead, Ecolab is confident it can continue its tradition of sales and earnings growth in 1997 through its customer-focused strategy and the dedication of its employees.
The document discusses Ecolab's financial performance and new products/services in 2008. Despite challenges from rising costs and economic slowdown, Ecolab achieved strong financial results through sales growth, cost efficiencies, and new solutions. It launched sustainable products in food safety, solid detergents, and pest control to help customers operate efficiently.
Ecolab achieved record financial results in 1996, with sales increasing 11% to $1.5 billion and net income growing 14% to $113 million. Earnings per share rose 17% to $1.75. These gains were driven by aggressive sales efforts, new product development, cost-saving initiatives, and strategic acquisitions. Ecolab's global sales coverage reached $2.4 billion for 1996 through wholly owned operations and a European joint venture. The company's strong performance led to a 25% increase in its stock price over the course of the year.
Kimberly-Clark is an American corporation founded in 1872. It is a leading global manufacturer of tissue, personal care, and health care products. K-C has major brands like Kleenex and Scott and generates over $19 billion in annual revenue. The company has four global business units focused on personal care, consumer tissue, professional products, and health care. K-C's mission is to enhance health, hygiene, and well-being worldwide through innovative products and brands. Major competitors include Procter & Gamble, Georgia-Pacific, and Johnson & Johnson.
The document provides an overview of Ecolab's Institutional division and its performance in 1996. Some key points:
- Institutional achieved record sales and earnings in 1996, growing faster than its markets.
- It launched 28 new products and expanded existing product lines like SIMPLEX.
- Major programs like Vanguard warewashing and Oasis dispensing contributed to growth.
- Institutional is well-positioned for continued growth in 1997 by expanding relationships and introducing new products/systems.
The 2009 sustainability report summarizes Ecolab's sustainability efforts and progress. It discusses how sustainability is core to Ecolab's mission of helping create a cleaner, safer, healthier world. In 2009, Ecolab made progress toward goals in economic performance, environmental stewardship, and social responsibility. It established teams to systematically drive sustainability initiatives throughout the company. Ecolab also pledged new goals to reduce its global water consumption, disposed waste, and effluent water by 18% per metric tonne of shipped product by 2015. The report highlights how Ecolab helps customers reduce environmental impacts and costs through products, programs, and on-site support.
The document summarizes Canon Oceania's 2008 sustainability report. It discusses Canon's philosophy of "kyosei" or living and working together for the common good. It highlights priorities like remaining profitable, reducing environmental impacts, and fulfilling social obligations. It also details new initiatives like conducting a greenhouse gas audit and measuring sustainability performance in the company's Balanced Scorecard to promote the kyosei philosophy throughout the business.
Coca Cola produces many carbonated and non-carbonated beverage products around the world. In Nepal, Coca Cola products are produced under license by Bottlers Nepal Limited (BNL) at two bottling plants. BNL focuses its marketing and advertising on point-of-sale locations, radio, TV, and other outlets. It also emphasizes price compliance. Additionally, BNL supports various community health programs in remote areas to improve access to medical care.
In this assignment the objective of the assignment have mentioned. in which the introduction of the company is there, its mission statement, Achievements and past successes, customer awareness towards this company and many more.
The E P&L is a pioneering tool to help businesses manage their relationship with the natural environment. All businesses rely on natural capital to deliver their products and services. However, as a result of their activities, businesses also impact the environment through their use of land and natural resources and their emissions to air, discharges to water and waste.
Kering developed the E P&L to help measure and understand its impact on natural capital across its supply chain, from raw materials to the delivery of products to customers.
Cargill is developing a sustainable supply chain for its Truvia sweetener made from stevia. It is working directly with a farmer cooperative in Argentina to develop better strains of stevia plants, ensuring supply for Truvia and maximizing income for producers. Cargill is also supporting local schools and facilities. This supply chain model offers environmental, economic, and social benefits while delivering a natural zero-calorie sweetener to consumers.
Ecolab's CEO discusses how the company "turned it up" in 2002 through strong financial performance, new product offerings and service capabilities, strategic acquisitions, and leadership development. Looking ahead, the CEO expresses confidence that Ecolab will continue growing its market share and opportunities through its core businesses and new offerings, leveraging its sales force, and expanding globally.
This document summarizes the annual meeting of shareholders for Whole Foods Market. It includes a safe harbor statement, information about the company's mission and core values, growth and financial performance, goals for the future including expanding to $12 billion in sales by 2010, and commitment to stakeholders, local communities, and the environment. It discusses the company's leadership structure with separate roles for the chairman and lead director to ensure protection of shareholders.
Axéréal's Corporate Social Responsibility strategy presents their commitment to sustainable development from customer to seed across their business units. Their CSR strategy formalizes their desire to make positive impacts through activities like improving economic, social, and environmental performance. It also allows Axéréal to differentiate itself, retain customer loyalty, and remain competitive in a changing global market.
The document provides an executive summary of The Coca-Cola Company's 2021 Business & ESG Report. It highlights the company's priorities around water leadership, offering beverages with less added sugar, packaging sustainability through the World Without Waste initiative, and reducing its carbon footprint and climate impacts. It summarizes progress made in 2021, including returning 167% of water used to nature, providing access to water and sanitation to over 18.5 million people, earning recognition for its water stewardship, and growing its portfolio of low- and no-calorie beverages which now make up 28% of volume.
Bioceuticals Research Labs is developing a line of skin care and wellness products using patented technology to deliver the amino acid L-Arginine transdermally. This $40B market is growing due to favorable demographics and increased interest in alternative medicine. BRI's products are aimed at improving skin quality and health based on scientific evidence from the 1998 Nobel Prize in Medicine about the benefits of nitric oxide production from L-Arginine. BRI seeks $2-3M in financing to further develop its IP portfolio, launch marketing initiatives, and expand its product line and distribution channels to achieve $3M in sales in year 1 and $15M by year 3.
This document summarizes Owens-Illinois' 2014 sustainability report. Some key points:
- Owens-Illinois established ambitious sustainability goals in 2009 focusing on energy reduction, increasing recycled glass (cullet) usage, reducing carbon emissions, and improving workplace safety.
- They have made progress towards these goals, reducing energy usage by 12%, increasing cullet usage to 38%, and reducing carbon emissions by 14% and workplace injuries by 33%.
- Sustainability is a core part of Owens-Illinois' strategy and glass is positioned as the most sustainable packaging material due to its recyclability and reuse potential. Innovation is highlighted as key to further improving sustainability.
2011 ANNUAL REPORTInnovating for Everyday Life$82..docxeugeniadean34240
2011 ANNUAL REPORT
Innovating for Everyday Life
$82.6
$78.9
$76.7
$79.3
$72.4
11
09
08
07
10
Net Sales ($ billions)
30%
4%
19%
9%
14%
24%
By business segment
Beauty
Grooming
Health Care
Snacks & Pet Care
Fabric Care & Home Care
Baby Care & Family Care
2011 Net Sales
9%
14%
16%
41%
20%
By geographic region
North America
Western Europe
Central & Eastern Europe,
Middle East & Africa
Latin America
Asia
35% 65%
By market maturity
Developed
Developing
$13.2
$16.1
$14.9
$15.0
$13.4
11
09
08
07
10
Operating Cash Flow ($ billions)
$3.93
$4.11
$4.26
$3.64
$3.04
11
09
08
07
10
Diluted Net Earnings (per common share)
Contents
Letter to Shareholders................................. 1
Leadership Brands.......................................9
Innovating for Everyday Life...................... 14
Gillette Guard ........................................ 16
Brazil...................................................... 18
Crest 3D White ......................................20
Gain Dishwashing Liquid ........................22
Head & Shoulders ..................................24
Old Spice ...............................................26
Disaster Relief ...........................................28
Financial Contents ....................................29
Global Leadership Council......................... 75
Board of Directors..................................... 75
Financial Summary.................................... 76
Company and Shareholder Information..... 78
Financial Highlights (unaudited)
Amounts in millions, except per share amounts 2011 2010 2009 2008 2007
Net Sales $82,559 $78,938 $76,694 $79,257 $72,441
Operating Income 15,818 16,021 15,374 15,979 14,485
Net Earnings 11,797 12,736 13,436 12,075 10,340
Net Earnings Margin from Continuing Operations 14.3% 13.9% 13.9% 14.2% 13.3%
Diluted Net Earnings per Common Share from Continuing Operations $3.93 $3.53 $3.39 $3.40 $2.84
Diluted Net Earnings Per Common Share 3.93 4.11 4.26 3.64 3.04
Dividends Per Common Share 1.97 1.80 1.64 1.45 1.28
Dear Shareholders,
Last year, I described P&G’s Purpose-inspired Growth Strategy, which is to
touch and improve more consumers’ lives in more parts of the world more
completely. I told you that we intend to deliver total shareholder return
that consistently ranks P&G among the top third of our peers — the best-
performing consumer products companies in the world. To do this, we
must deliver the Company’s long-term annual growth goals, which are to:
Grow organic sales 1% to 2% faster than
market growth in the categories and countries
where we compete
Deliver core earnings per share (core EPS) growth
of high single to low double digits
Generate free cash flow productivity of
90% or greater
Robert A. McDonald
Chairman of the Board, President and
Chief Executive Officer
We made meaningful progress toward these long-term goals
for fiscal 2011, despite significant external chal.
IHP 420 Ethical Theories Worksheet Guidelines and Rubric .docxalanrgibson41217
IHP 420 Ethical Theories Worksheet Guidelines and Rubric
Overview: When you are considering responses to healthcare situations, it is important to be able to quickly identify the underlying ethical and bioethical
theories driving a proposed solution. While completing the worksheet, consider the core elements of the theory that must be addressed in the solution.
Prompt: In this activity, you will utilize the main ethical and bioethical theories in solutions to a proposed scenario.
Part One: Propose a solution to the following scenario using each of the five ethical theories presented in this module. Explain how your solution aligns
with the major ideas within each theory.
Scenario: There is a pandemic of a contagious disease. In the United States, there is only enough of a vaccine to cover 70% of the population. How do you
determine who gets the vaccine?
Part Two: Consider the same scenarios, but explain what process you would need to add to your solution to protect the bioethics principles.
Rubric
Guidelines for Submission: Complete the Ethical Theories Worksheet using complete sentences. If you use resources, cite them according to APA formatting.
Critical Elements Exemplary (100%) Proficient (85%) Needs Improvement (55%) Not Evident (0%) Value
Part One Meets “Proficient” criteria, and
explanation demonstrates
complex grasp of the theories
Explains a solution to the
scenario and applies the ethical
theories from the worksheet
Explains solutions to the
scenario but applies the
theories incorrectly or
incompletely
Does not provide explanation of
how ethical theories apply to
the provided scenario
50
Part Two Meets “Proficient” criteria, and
explanation demonstrates
complex grasp of the bioethics
principles
Explains a solution to the
scenario and applies the ethical
theories from the worksheet
Explains solutions to the
scenario but applies the
theories incorrectly or
incompletely
Does not provide explanation of
how ethical theories apply to
the provided scenario
45
Articulation of
Response
Submission is free of errors
related to citations, grammar,
spelling, syntax, and
organization and is presented in
a professional and easy-to-read
format
Submission has no major errors
related to citations, grammar,
spelling, syntax, or organization
Submission has major errors
related to citations, grammar,
spelling, syntax, or organization
that negatively impact
readability and articulation of
main ideas
Submission has critical errors
related to citations, grammar,
spelling, syntax, or organization
that prevent understanding of
ideas
5
Total 100%
http://snhu-media.snhu.edu/files/course_repository/undergraduate/ihp/ihp420/ihp420_ethical_theories_worksheet.docx
one vulcan, locally led
201 7 ANNUAL REPORT
from
our chairman
Dear Shareholders & Friends
The past year was one of solid performance
by our employees, as they worked together
to levera.
Presentation Rob van Leen SIS London 1 October 2013DSM
Presentation given by DSM Chief Innovation Officer Rob van Leen on innovation within DSM during the Sustainability Innovation Summit, 1 October 2013 in London.
Western Digital's revenue in Q1 FY2005 was $824 million. 59% of revenue came from OEM customers, 35% from distributors, and 6% from retailers. Geographically, 40% of revenue was from the Americas, 30% from Europe, and 30% from Asia. Worldwide headcount increased to 20,760 employees. Total inventory was $144 million with inventory turns of 20 times.
Western Digital reported revenue of $955 million for Q2 FY2005, up 16% from Q2 FY2004. 58% of revenue came from OEM customers and 35% from distributors. Geographically, 38% of revenue was from the Americas, 32% from Europe, and 30% from Asia. Hard drive unit shipments increased by 16% to 16.2 million units while worldwide headcount grew slightly to 21,565. Total inventory fell to $118 million while inventory turns improved to 27 times.
Western Digital reported Q3 FY2005 revenue of $920 million, with 56% from OEM customers, 37% from distributors, and 7% from retail. Revenue was highest in Asia at 34% of the total, followed by Americas at 36% and Europe at 30%. The number of hard drive units shipped was 15.3 million, with worldwide headcount growing to 22,426. Inventory levels increased to $136 million, with inventory turns at 22.
Western Digital reported Q4 FY2005 revenue of $940 million. 57% of revenue came from OEM customers, 38% from distributors, and 5% from retail. 37% of revenue was from the Americas, 25% from Europe, and 37% from Asia. 48% of revenue came from the top 10 largest customers. Hard drive unit shipments reached 15.8 million for the quarter. Worldwide headcount increased to 23,161 employees. Inventory levels increased to $153 million with inventory turns at 20 times.
Western Digital's revenue in Q1 FY2006 was $1.01 billion, up from $824 million in Q1 FY2005. 55% of revenue came from OEM customers, 39% from distributors, and 6% from retail. Geographically, 36% of revenue was from the Americas, 29% from Europe, and 35% from Asia. Worldwide headcount increased to 24,211 from 20,760 in Q1 FY2005. Total inventory, net increased to $173 million from $144 million in Q1 FY2005.
Western Digital reported revenue of $1.117 billion for Q2 FY2006, up 11% from the same period last year. Approximately 56% of revenue came from OEM customers and 39% from distributors. Geographically, revenue declined in the Americas to 32% while rising in Europe to 34% and remaining flat in Asia at 34%. Inventory levels increased to $168 million but inventory turns improved to 21 turns.
Western Digital Corporation's Q3 FY2006 financial results show that hard drive unit shipments increased to 18.8 million, revenue was $1.129 billion with an average selling price of $60 per unit, and gross margin was 19.3%. Revenue was split 53% from OEMs, 40% from distributors, and 7% from retail, with the largest geographic regions being the Americas at 39%, Europe at 27%, and Asia at 34%. Cash flow from operations was $119 million.
Western Digital Corporation reported its financial results for the fourth quarter of fiscal year 2006, with total revenue of $1.086 billion. The average selling price of hard drives declined to $56 per unit from $60 in the previous quarter. Gross margin was 18.8% and cash flow from operations was $126 million. Worldwide headcount increased to 24,750 employees. Total inventory increased to $205 million while inventory turns declined to 17 turns.
Western Digital reported higher unit shipments and revenue in Q1 FY2007 compared to the same quarter last year. Revenue increased by $254 million to $1.264 billion due to a 22% increase in hard drive unit shipments. Gross margin declined slightly to 17.3% and revenue from OEM customers decreased to 52% of total revenue. Cash flow from operations was $128 million and inventory levels increased by $11 million from the previous quarter to $216 million.
Western Digital reported increased revenue and unit shipments in Q2 FY2007 compared to the same period last year. Revenue grew 28% to $1.428 billion while unit shipments increased 36% to 24.5 million units. Gross margin improved slightly to 17.9% and worldwide headcount grew 9% to over 27,000 employees. Inventories also increased due to higher finished goods and work in process levels.
Western Digital reported its Q3 FY2007 financial results. While unit shipments remained steady at 24.5 million, revenue declined slightly to $1.41 billion. Gross margins decreased to 15.8% due to pricing pressures. Cash flow from operations was $164 million. Inventory levels increased but inventory turns improved to 20 times.
Western Digital Corporation's Q4 FY2007 investor information summary shows that the company's hard drive unit shipments increased slightly compared to Q3 FY2007, but revenue and average selling price declined. Gross margin also decreased from the prior quarter. The company's largest customers - representing 48% of revenue - continued to be OEMs, distributors, and retailers. Cash flow from operations and inventory levels increased from Q3 FY2007.
Western Digital reported higher revenue and unit shipments in Q1 FY2008 compared to the same period last year. Revenue increased 40% to $1.77 billion driven by a 7% increase in average selling price and 29% more hard drive units shipped. Gross margin improved to 18.3% from 17.3% a year ago. Total inventory increased significantly to support future demand, leading to lower inventory turns. Capital expenditures also increased substantially to $163 million to expand production capacity.
Western Digital reported revenue of $2.2 billion for Q2 FY2008, a 25% increase from the previous quarter. Gross margins improved to 23.3% as average selling prices increased to $61 per hard drive unit. Inventory levels remained steady at $459 million while inventory turns improved to 15 times. Worldwide headcount grew modestly to 42,534 employees.
Western Digital Corporation provides a quarterly investor information summary including key metrics such as hard drive unit shipments, revenue, average selling prices, gross margins, revenue by channel and geography, cash flow from operations, inventory levels, and number of employees. For the third quarter of fiscal year 2008, the company shipped 34.5 million hard drive units, generated $2.11 billion in revenue, and had a gross margin of 22.6%.
Western Digital reported revenue of $1.993 billion in Q4 FY2008, down from $2.111 billion in the previous quarter. Their average hard drive selling price was $56 and gross margin was 21.3%. Over half of revenue came from OEM customers, while Asia accounted for 46% of geographic revenue. Total inventory was $456 million with inventory turns of 14 times.
Western Digital reported revenue of $2.1 billion for Q1 FY2009, up slightly from the previous year. Average selling prices for hard drives declined to $53 per unit from $56 in the previous quarter. Gross margins decreased to 20.1% as production costs increased. Revenue from Asia grew and now makes up 48% of total revenue, while the Americas saw a decline to 23% of revenue. The company's workforce grew to 51,409 employees worldwide.
Western Digital reported Q2 FY2009 revenue of $1.823 billion, down 15% from the previous year. Revenue from OEM customers was 57% of total, down from 48% the previous year. The Asia region accounted for 48% of revenue, up from 36% the previous year. Gross margin declined to 15.9% from 23.3% the previous year. Cash flow from operations was $300 million and days sales outstanding was 46 days.
Western Digital Corporation is a leading manufacturer of hard disk drives. In fiscal year 1995, the company achieved record revenues and earnings despite intense competition. It gained market share in hard drives, improved its financial position, and received an ISO 9001 quality certification. Looking forward, Western Digital is expanding its hard drive production capacity and entering new high-performance, high-capacity hard drive markets. It aims to take advantage of growth opportunities through investment in research and development.
Western Digital Corporation is a leading manufacturer of hard drives. In 1996, the company reported record revenues and unit shipments, gained market share, and introduced new enterprise hard drives. Despite significant investments, Western Digital remains debt-free with strong cash flow and financial position. The company expects continued growth in the hard drive market and is well-positioned with efficient operations and quality products to capitalize on opportunities.
Madhya Pradesh, the "Heart of India," boasts a rich tapestry of culture and heritage, from ancient dynasties to modern developments. Explore its land records, historical landmarks, and vibrant traditions. From agricultural expanses to urban growth, Madhya Pradesh offers a unique blend of the ancient and modern.
The Rise and Fall of Ponzi Schemes in America.pptxDiana Rose
Ponzi schemes, a notorious form of financial fraud, have plagued America’s investment landscape for decades. Named after Charles Ponzi, who orchestrated one of the most infamous schemes in the early 20th century, these fraudulent operations promise high returns with little or no risk, only to collapse and leave investors with significant losses. This article explores the nature of Ponzi schemes, notable cases in American history, their impact on victims, and measures to prevent falling prey to such scams.
Understanding Ponzi Schemes
A Ponzi scheme is an investment scam where returns are paid to earlier investors using the capital from newer investors, rather than from legitimate profit earned. The scheme relies on a constant influx of new investments to continue paying the promised returns. Eventually, when the flow of new money slows down or stops, the scheme collapses, leaving the majority of investors with substantial financial losses.
Historical Context: Charles Ponzi and His Legacy
Charles Ponzi is the namesake of this deceptive practice. In the 1920s, Ponzi promised investors in Boston a 50% return within 45 days or 100% return in 90 days through arbitrage of international reply coupons. Initially, he paid returns as promised, not from profits, but from the investments of new participants. When his scheme unraveled, it resulted in losses exceeding $20 million (equivalent to about $270 million today).
Notable American Ponzi Schemes
1. Bernie Madoff: Perhaps the most notorious Ponzi scheme in recent history, Bernie Madoff’s fraud involved $65 billion. Madoff, a well-respected figure in the financial industry, promised steady, high returns through a secretive investment strategy. His scheme lasted for decades before collapsing in 2008, devastating thousands of investors, including individuals, charities, and institutional clients.
2. Allen Stanford: Through his company, Stanford Financial Group, Allen Stanford orchestrated a $7 billion Ponzi scheme, luring investors with fraudulent certificates of deposit issued by his offshore bank. Stanford promised high returns and lavish lifestyle benefits to his investors, which ultimately led to a 110-year prison sentence for the financier in 2012.
3. Tom Petters: In a scheme that lasted more than a decade, Tom Petters ran a $3.65 billion Ponzi scheme, using his company, Petters Group Worldwide. He claimed to buy and sell consumer electronics, but in reality, he used new investments to pay off old debts and fund his extravagant lifestyle. Petters was convicted in 2009 and sentenced to 50 years in prison.
4. Eric Dalius and Saivian: Eric Dalius, a prominent figure behind Saivian, a cashback program promising high returns, is under scrutiny for allegedly orchestrating a Ponzi scheme. Saivian enticed investors with promises of up to 20% cash back on everyday purchases. However, investigations suggest that the returns were paid using new investments rather than legitimate profits. The collapse of Saivian l
KYC Compliance: A Cornerstone of Global Crypto Regulatory FrameworksAny kyc Account
This presentation explores the pivotal role of KYC compliance in shaping and enforcing global regulations within the dynamic landscape of cryptocurrencies. Dive into the intricate connection between KYC practices and the evolving legal frameworks governing the crypto industry.
Monthly Market Risk Update: June 2024 [SlideShare]Commonwealth
Markets rallied in May, with all three major U.S. equity indices up for the month, said Sam Millette, director of fixed income, in his latest Market Risk Update.
For more market updates, subscribe to The Independent Market Observer at https://blog.commonwealth.com/independent-market-observer.
How to Identify the Best Crypto to Buy Now in 2024.pdfKezex (KZX)
To identify the best crypto to buy in 2024, analyze market trends, assess the project's fundamentals, review the development team and community, monitor adoption rates, and evaluate risk tolerance. Stay updated with news, regulatory changes, and expert opinions to make informed decisions.
Fabular Frames and the Four Ratio ProblemMajid Iqbal
Digital, interactive art showing the struggle of a society in providing for its present population while also saving planetary resources for future generations. Spread across several frames, the art is actually the rendering of real and speculative data. The stereographic projections change shape in response to prompts and provocations. Visitors interact with the model through speculative statements about how to increase savings across communities, regions, ecosystems and environments. Their fabulations combined with random noise, i.e. factors beyond control, have a dramatic effect on the societal transition. Things get better. Things get worse. The aim is to give visitors a new grasp and feel of the ongoing struggles in democracies around the world.
Stunning art in the small multiples format brings out the spatiotemporal nature of societal transitions, against backdrop issues such as energy, housing, waste, farmland and forest. In each frame we see hopeful and frightful interplays between spending and saving. Problems emerge when one of the two parts of the existential anaglyph rapidly shrinks like Arctic ice, as factors cross thresholds. Ecological wealth and intergenerational equity areFour at stake. Not enough spending could mean economic stress, social unrest and political conflict. Not enough saving and there will be climate breakdown and ‘bankruptcy’. So where does speculative design start and the gambling and betting end? Behind each fabular frame is a four ratio problem. Each ratio reflects the level of sacrifice and self-restraint a society is willing to accept, against promises of prosperity and freedom. Some values seem to stabilise a frame while others cause collapse. Get the ratios right and we can have it all. Get them wrong and things get more desperate.
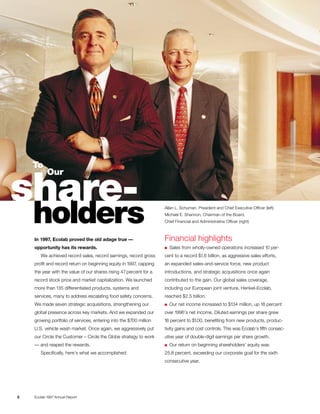
1. To
Our
share-
holders Allan L. Schuman, President and Chief Executive Officer (left)
Michael E. Shannon, Chairman of the Board,
Chief Financial and Administrative Officer (right)
Financial highlights
In 1997, Ecolab proved the old adage true —
opportunity has its rewards. Sales from wholly-owned operations increased 10 per-
s
We achieved record sales, record earnings, record gross cent to a record $1.6 billion, as aggressive sales efforts,
profit and record return on beginning equity in 1997, capping an expanded sales-and-service force, new product
the year with the value of our shares rising 47 percent for a introductions, and strategic acquisitions once again
record stock price and market capitalization. We launched contributed to the gain. Our global sales coverage,
more than 135 differentiated products, systems and including our European joint venture, Henkel-Ecolab,
services, many to address escalating food safety concerns. reached $2.5 billion.
We made seven strategic acquisitions, strengthening our Our net income increased to $134 million, up 18 percent
s
global presence across key markets. And we expanded our over 1996’s net income. Diluted earnings per share grew
growing portfolio of services, entering into the $700 million 18 percent to $1.00, benefiting from new products, produc-
U.S. vehicle wash market. Once again, we aggressively put tivity gains and cost controls. This was Ecolab’s fifth consec-
our Circle the Customer – Circle the Globe strategy to work utive year of double-digit earnings per share growth.
— and reaped the rewards. Our return on beginning shareholders’ equity was
s
Specifically, here’s what we accomplished: 25.8 percent, exceeding our corporate goal for the sixth
consecutive year.
2 Ecolab 1997 Annual Report
2. Our stock price soared. We began the year at $18.81 and
s
ended at $27.72, an increase of 47 percent — well in excess
of the 31 percent growth of the Standard & Poor’s 500.
This represents the third consecutive year in which we
surpassed the S&P 500, and the sixth year of the last
seven. Since 1990, Ecolab shares have risen 422 percent,
compared to the S&P 500’s 194 percent increase.
Our Board of Directors approved a two-for-one stock
s
split in the form of a 100 percent stock dividend, paid on
January 15, 1998. This was our second such stock split
in four years.
We maintained our “A” category balance sheet rating from
s
the major credit rating agencies, despite our aggressive
acquisition activity.
Food safety is our business
In December, we increased our quarterly cash dividend
s
19 percent to $0.095 per share from $0.08. This resulted
in an indicated annual rate of $0.38 per share and is in
Allan L. Schuman
keeping with our policy of paying out between 30 and
President and Chief Executive Officer
40 percent of our earnings as dividends.
Opportunities for growth The food safety issue is heating up. Last year it was almost
We continued to differentiate ourselves from competitors
s impossible to turn on the TV or open up the newspaper
with aggressive new product platforms, many which offer
without hearing about foodborne illness, a public threat that
opportunities across markets. They include GeoSystem,
will undoubtedly receive even more attention in 1998. The bad
a new solids innovation that offers improved performance,
news is that bacteria and diseases are making more frequent
increases user safety and reduces plastic packaging by
appearances in our food, and they are becoming even tougher
90 percent, and Tsunami, a flume water treatment that
to control and eliminate. The good news is that Ecolab has the
more effectively controls bacterial contamination in fruit
and vegetable plants. Thirty-five percent of Ecolab’s total people, products and processes in place to play a vital role in
U.S. sales come from products and systems introduced
keeping our food safe.
or modified within the last five years.
To enhance service coverage, we added 385 associates Sanitation makes the difference. While it may seem like an
s
to our sales-and-service force, which is now nearly 6,000 elementary solution to an increasingly dangerous problem —
members strong. It maintains its reputation as the largest
one that puts lives at risk — the safe production, delivery,
and best-trained organization in the industry. When including
storage and preparation of food is paramount. And whether it
our Henkel-Ecolab joint venture, our sales-and-service force
be by sanitizing systems in food processing plants, providing
totals 8,625 associates worldwide, which represents an
handwash products to grocery store delis, or sanitizing the
8 percent increase over last year.
In 1997, we acquired Henkel KGaA’s African businesses plates upon which meals are placed, Ecolab offers the products,
s
in Kenya, Tanzania and Morocco. These wholly-owned equipment, training and support to help our customers keep
subsidiaries, coupled with our existing South Africa
their operations safe.
operations, provide a strong launching pad for further
expansion within the continent. It is said the best defense against the threat of foodborne illness
In March, we acquired the institutional, food and beverage
s
is eternal vigilance — and lots of soap. And Ecolab, with its total
and commercial laundry businesses of the Savolite Group of
systems approach to cleaning and sanitation, is in the perfect
Vancouver, British Columbia, Canada, enhancing Ecolab’s
position to continue to grow its business by providing both.
presence in both Canada and the U.S. Pacific Northwest.
3. Outlook for the future
In August, we acquired the Chemidyne Marketing Division
s
of Chemidyne Corp., Macedonia, Ohio, a provider of cleaning The accomplishments listed above represent some of the
and sanitizing products and equipment to the U.S. meat, poul- strongest enhancements to Ecolab’s enterprise and most
try and processed food markets. We successfully integrated promising growth prospects in our history. And we’ve only
the business into our Food & Beverage Division, strengthen- just begun.
ing its ability to meet the market’s rapidly growing needs. In 1998, we expect the sales environment to remain
In December, we acquired certain assets of Grace-Lee competitive as industry consolidations, pricing pressures
s
and economic struggles abroad present their challenges.
Products Inc., a Minneapolis, Minn.-based manufacturer
and marketer of cleaning products for the U.S. vehicle wash However, we have successfully overcome these obstacles
market. This acquisition will serve our existing customers’ in the past. With our associates’ exceptional efforts, and our
fleet wash operations, as well as independent car washes. time-proven strategies, we are confident we can do so again.
Ecolab will maintain its leadership position by continuing
At the end of 1997, we completed our acquisition of
s
to develop differentiated products and services that offer
Gibson Chemical Industries Limited of Melbourne, Australia,
increased value to our customers. We will expand our sales-
a leader in the institutional, food and beverage, and water
and-service force — the largest and best-trained in the
care markets in Australia and New Zealand. This will allow
industry. And we will stay far ahead of industry issues and
us to leverage our presence in the region.
trends, as we have with the growing concerns over food
Demonstrated leadership and employee safety. Ecolab will also continue to follow its
global customers into emerging markets, providing them
For the ninth time in 13 years, Ecolab earned the Multi-
s
with the same level of service they enjoy at home — and
Unit Food Service Operators “Supplier of the Year” award,
strengthening our presence, expertise and competitive
demonstrating our commitment to service excellence.
advantage around the world.
Associates showed incredible support for Ecolab’s
s
Opportunities remain in all of our markets, and as we forge
Grand Forks, N.D., employees during devastating spring-
our 21st century enterprise, we will seize these opportunities
time floods. Donations included $241,000 from employees,
at an accelerated pace, aggressively implementing our
retirees, customers, suppliers and matching corporate
Circle the Customer – Circle the Globe strategy to better
contributions, and truckloads of clothing and supplies.
serve our customers, grow our sales, gain market share
This was supplemented by $800,000 in grants and loans
and ultimately increase shareholder value.
from the Ida C. Koran Trust for Ecolab associates.
When you see a world, Ecolab sees a world of
Rick Marcantonio joined Ecolab as senior vice president,
s
opportunity. That’s why we will continue to grow our
Industrial, responsible for the Food & Beverage, Water Care
business by expanding our products, coverage and
Services and Pest Elimination divisions. He came to Ecolab
customer base. In doing so, we will provide businesses,
from the Keebler Company.
employees and shareholders alike with opportunities —
In August, Les Biller, president and chief operating officer
s
and rewards — that are endless.
of Norwest Corporation, was elected to Ecolab’s Board
of Directors. We welcome Les and look forward to
his contributions.
Bill Rosengren, senior vice president, Law and General
s
Allan L. Schuman
Counsel, retired from Ecolab in December after 18 years of President and Chief Executive Officer
service. Bill is a good friend; we will miss his contributions
and wish him well in the future.
We suffered a tragic loss in 1997 when Russ Cleary,
s
Michael E. Shannon
a member of our Board of Directors since 1981, passed Chairman of the Board, Chief Financial
away unexpectedly. He was a trusted advisor and leader and Administrative Officer
who helped us grow.
4 Ecolab 1997 Annual Report