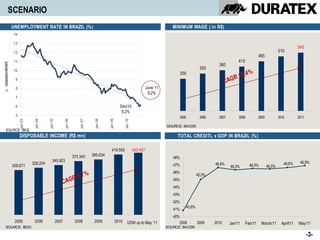
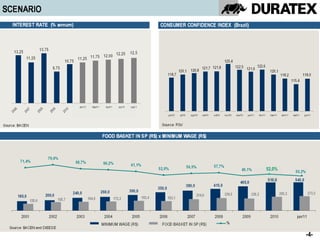
1) The document presents an overview of the economic scenario in Brazil, including unemployment rates, minimum wage, disposable income, and total credit as a percentage of GDP.
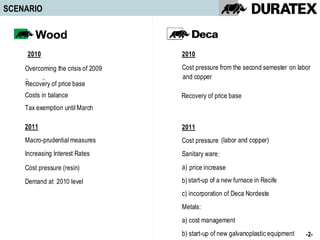
2) It discusses Duratex's performance and challenges in 2010, including overcoming the crisis of 2009 and cost pressures, and recovery of prices and rates.
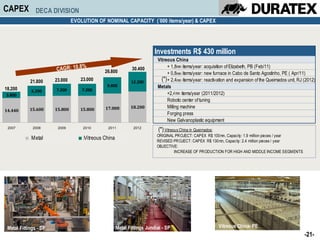
3) It outlines Duratex's expectations for 2011, including continued cost pressures, macroprudential measures, increasing interest rates, and demand at 2010 levels. Specific initiatives are mentioned for their sanitary wares and metals business units.


![Rebound of us_supplier_industry_final[1]](https://cdn.slidesharecdn.com/ss_thumbnails/reboundofussupplierindustryfinal1-121211101715-phpapp01-thumbnail.jpg?width=640&height=640&fit=bounds)


