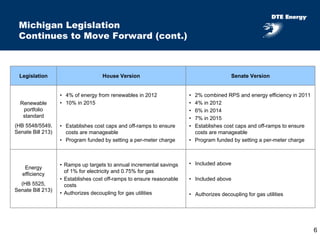
This document provides a mid-year business update from DTE Energy, including:
1) An overview of energy legislation progressing through the Michigan legislature aimed at electric choice reform, cost-of-service rates, and renewable portfolio standards.
2) Details on Detroit Edison's general rate case filing, including a requested $60 million revenue increase to recover required environmental investments and merger premium costs.
3) An outline of topics to be covered, including the legislative update, non-utility business performance, and updated earnings guidance.
This document provides a summary of DTE Energy's business update presentation at the AGA Financial Forum on May 5, 2008. It discusses DTE Energy's focused integrated energy strategy of executing strong regulated utility growth and a value-focused non-utility plan. Specifically, it outlines DTE Energy's projected utility earnings growth rates, regulatory environment, and growth opportunities. It also provides an overview of DTE Energy's utilities and non-utility businesses and the proportion of projected 2008 earnings they represent.
The document summarizes Progress Energy's Q3 2008 earnings call. It discusses ongoing earnings of $306M for Q3 2008, regulatory updates in the Carolinas and Florida, energy efficiency and alternative energy programs, and $7-8B in capital expenditures through 2013 for major generation projects. Cost controls have kept year-to-date O&M expenses flat compared to 2007 despite 2.5% reported growth. Customer growth has been positive but milder weather reduced retail usage. Guidance of $2.95-3.05 for 2008 ongoing earnings is maintained based on a trailing 12-month EPS of $2.91. Liquidity remains strong with $1.9B in available credit facilities and cash.
The document summarizes a presentation given by Joseph P. O'Leary and Steven P. Eschbach at a Mid-Cap Utility Conference on March 25, 2008. It discusses Integrys Energy Group's goals of delivering long-term shareholder value and earnings growth. It provides an overview of Integrys' regulated utility businesses, the progress of integrating Peoples Energy, capital investment programs, and financial outlook. Guidance is given for 6-8% annual EPS growth and a projected 2008 EPS range of $3.33-$3.78.
This document summarizes a presentation given by Dick Kelly, the CEO of Xcel Energy, at a financial conference in 2007. The presentation addresses Xcel Energy's strategy for achieving financial success through environmental leadership as climate change policies emerge. Key points include:
1) Xcel Energy is positioning itself to be a leader in addressing climate change by stabilizing or reducing its carbon emissions by 2020 through investments in renewables, energy efficiency, nuclear and cleaner generation.
2) This strategy is expected to reduce regulatory risk, meet customer and political expectations, and demonstrate environmental leadership which could open investment opportunities.
3) Financial projections show rate base growth of 7.5% annually through 2011 which Xcel Energy expects to
This document summarizes Xcel Energy's presentation at the Banc of America Securities Energy & Power Conference on November 17-19, 2003. It discusses Xcel Energy's accomplishments in 2003, objectives for investment, earnings growth, and credit ratings improvement. It also provides guidance on projected 2003 and 2004 earnings, cash flows, utility investments, and the expected timeline for NRG's emergence from bankruptcy.
This document provides an overview of Xcel Energy from their presentation at the Edison Electric Institute Financial Conference in October 2003. Key points include Xcel achieving several accomplishments in 2003 including settling with NRG creditors, maintaining investment grade ratings, and refinancing debt. Projections for 2004 include earnings of $1.15-1.25 per share assuming NRG emerges from bankruptcy. The presentation outlines Xcel's objectives, investments, regulatory strategy, and earnings drivers to emphasize the company as a low-risk, integrated utility with a total return of 7-8%.
This document summarizes a presentation given by Steven P. Eschbach, Vice President of Investor Relations for Midwest Utilities Seminar. The presentation provides an overview of Integrys Energy Group, a leading Midwest energy company serving over 2 million customers. Key points included Integrys' goals of long-term shareholder value and earnings growth, its diverse regulated utility businesses across six states, ongoing capital investment including the Weston 4 power plant project, and guidance for 2008 financial performance.
DTE Energy reported its business and financial results for 2007. Key points include:
- Operating earnings for 2007 were $2.82 per share, driven by strong results across utility and non-utility segments.
- Detroit Edison and MichCon earned near their authorized returns on equity despite challenges from new computer systems.
- Non-utility segments like coal/gas midstream and energy trading significantly contributed to earnings.
- The company is making investments to grow its utilities and pipelines, with plans to file an updated rate case for Detroit Edison.
xcel energy 9_8888LehmanConfPresentation952007SECfinance26
The document is a presentation by Dick Kelly, Chairman and CEO of Xcel Energy, at a Merrill Lynch conference on September 25, 2007. Kelly summarizes Xcel's value proposition as a low-risk regulated utility with opportunities for investment and environmental leadership. He outlines the company's accomplishments in 2007, upcoming capital investment opportunities, and expectations for continued earnings per share growth of 5-7% and dividend growth of 2-4% per year through strong capital expenditure programs and constructive regulation.
The document summarizes Progress Energy's Q2 2008 earnings call. It discusses the company reaffirming its 2008 ongoing earnings guidance of $3.05 per share despite challenges in Florida. It also provides updates on recent court rulings impacting emissions regulations, the Levy County nuclear project, and major capital expenditure projects. Progress Energy's CFO discusses the company's quarterly and year-to-date financial performance and steps taken to offset weakness in Florida retail markets through increased wholesale contracts.
xcel energy 9_11EuropeanRoadShowPresentationSeptember2007finance26
This document provides an overview of Xcel Energy's business and financial performance from the perspective of the Vice President and CFO. It summarizes Xcel's operating regions, recent accomplishments, capital investment opportunities, environmental leadership, and financial outlook. The key messages are that Xcel delivers low-risk returns through regulated utilities, has a strong pipeline of investment opportunities, and is positioned to continue delivering earnings and dividend growth through 2011 by executing on its capital plans.
George Tyson, Vice President and Treasurer of Xcel Energy, presented at a West Coast seminar on February 15, 2007. He discussed Xcel's financial objectives of 5-7% annual EPS growth and 2-4% annual dividend growth per share. He outlined Xcel's strategy of investing in regulated utility operations, environmental leadership, and obtaining constructive regulation. Tyson also provided an overview of various capital projects and cost recovery mechanisms across Xcel's service territories.
Public Service Enterprise Group (PSEG) operates power generation, transmission and distribution businesses. The document discusses opportunities for growth across PSEG's businesses in areas like renewable energy, carbon reduction initiatives, and New Jersey's Energy Master Plan. PSEG is well positioned for growth through its diverse portfolio of assets and investments aligned with trends in tightening capacity, environmental compliance, and energy policy debates. PSE&G in particular is positioned for steady growth through its base investment plan and additional opportunities in transmission expansion, renewable strategies, and advanced metering infrastructure.
This document provides an overview of Xcel Energy, an integrated utility company focused on reducing carbon emissions. Key points include:
1) Xcel Energy has plans to significantly reduce carbon emissions by 2020-2030 through investments in renewable resources like wind, solar, and biomass as well as new technologies like smart grids and carbon sequestration.
2) The company operates under constructive regulation with recovery mechanisms for major capital projects and has a strong financial position with consistent earnings growth and dividend increases.
3) Xcel Energy expects to invest over $2 billion per year through 2011 to expand renewable generation, upgrade infrastructure, and extend the life of its nuclear plants, positioning it for continued growth.
xcel energy 8_16_2007KohlerPresentation8172007SECfinance26
Xcel Energy delivered positive results in 2007 and positioned itself for continued growth. Key accomplishments included resolving legal issues, completing generation projects on time and budget, and receiving constructive regulatory resolutions. The company expects to meet or exceed 2007 earnings guidance. Xcel outlined capital investment opportunities through 2011 focused on generation, transmission and distribution. Recovery mechanisms provide stability, and opportunities exist to improve returns in some jurisdictions.
This document provides an overview of Xcel Energy Inc. for investors attending the EEI International Financial Conference. It summarizes Xcel's business segments, strengths, investment merits, capital investment plans, power supply, environmental commitments, and financial performance. Projections for 2004 earnings per share and cash flow are also presented. Key points include Xcel being the 4th largest US electric and gas utility, a growing service area, low rates, and a goal of providing competitive total returns of 7-9% to shareholders.
This document provides an overview of a Midwest Utilities Seminar held in April 2008. It discusses Ameren Corporation, a regional electric and gas utility operating in Missouri and Illinois. The presentation outlines Ameren's business segments and strategy to achieve operational excellence and regulatory frameworks that support earnings growth. Financial projections through 2012 indicate a target of 4-6% annual EPS growth through rate cases and investment in regulated infrastructure. Non-regulated generation is also positioned for potential earnings growth depending on power and fuel prices.
Danial Khan has expertise in various areas related to project management, risk management, trading software implementation, strategic consulting, and commodity trading. He has worked with natural gas, power, crudes, chemicals and other commodities. Khan has extensive experience implementing trading and risk management systems like OpenLink Endur, Allegro, TriplePoint CX, and RiskWatch for large energy companies including Eni, Marathon Oil, Shell, BP, PG&E, DTE, Kuwait Petroleum Company, Valero Energy Services, DTE MichCon, PP&L, Koch Industries, Enron, Portland Power, ONEOK, and NGC/Dynegy. He is proficient with ERP systems like SAP and Oracle.
YRC Worldwide Inc. reported record revenue and operating profit in 2006. The company achieved its fourth consecutive year of returns exceeding its weighted average cost of capital. In 2006, YRC formed new organizational structures including YRC National Transportation and the Enterprise Solutions Group to improve efficiency and enable faster growth. The company will continue pursuing its strategic goal of becoming a global leader in transportation and supply chain solutions.
DTE Energy reported 2004 earnings of $431 million, down from 2003 earnings of $521 million. Operating earnings for 2004 were $427 million, down from $500 million in 2003. The company maintained its 2005 earnings guidance of $3.30 to $3.60 per share. Key factors impacting 2004 results included mild weather, lower utility sales from customer choice programs, and higher power plant and benefit costs. However, the company completed favorable rate cases and expects regulatory resolutions and non-utility growth to improve 2005 earnings.
- YRC Worldwide reported record quarterly revenue of $2.57 billion, up 3.2% from the third quarter of 2005. Adjusted quarterly earnings per share were $1.72, up 12% from the prior year.
- For the first nine months of 2006, revenue was $7.51 billion, up 20% from the same period in 2005. Adjusted diluted EPS was $4.06 compared to $3.88 the previous year.
- The company expects full year 2006 EPS between $5.45-$5.55 and revenue of approximately $10 billion.
- Yellow Transportation reported a 14.2% increase in total revenue for Q4 2004 compared to Q3 2003, driven by increases in both LTL and TL revenue. For the full year 2004, revenue increased 13.1% over 2003.
- Tonnage and shipments increased across all business segments for both Q4 and full year 2004 compared to the prior year.
- Revenue per hundredweight and revenue per shipment increased across most business segments for both Q4 and full year 2004 compared to 2003, indicating improved pricing.
Starbucks had another successful fiscal year, opening 2,199 new stores globally to bring their total to 12,440 stores in 37 countries, generating $7.8 billion in revenue and $564 million in net earnings. Starbucks continued to innovate with new food and beverage offerings, expanded into new international markets like Brazil and Egypt, and further developed their corporate social responsibility programs. Looking ahead, Starbucks is confident about continued global growth and has set targets to open 2,400 new international stores in fiscal 2007 and achieve 20-25% annual earnings growth over the next 3-5 years.
Pepco Holdings, Inc. held an analyst conference on October 5-6, 2004 to discuss the company's performance. The presentation included an overview of PHI's businesses, strategy, and corporate governance practices. It noted PHI has $7.1 billion in revenues and focuses on its regulated electric and gas delivery business, which accounts for 72% of operating income. The Power Delivery segment was discussed, which includes the transmission and distribution of electricity to 1.8 million customers across several mid-Atlantic states.
CenterPoint Energy's electric transmission and distribution business serves over 1.84 million metered customers across a 5,000 square mile area including Houston, Texas. In 2003, the business gained 47,000 new customers, delivered over 71 billion kilowatt-hours of electricity, and improved productivity through ongoing process improvements despite cost increases. The business focuses on building, operating, and maintaining the infrastructure between power plants and end users to ensure reliable and safe electricity delivery.
This document provides a summary of DTE Energy's business update presentation given at the AGA Financial Forum on May 5, 2008. It discusses DTE Energy's focused strategy of executing strong regulated utility growth and a value-focused non-utility plan. Specifically, it outlines DTE Energy's projected utility earnings growth rates, regulatory environment, and opportunities in areas like renewables. It also summarizes the composition and focus of DTE Energy's non-utility businesses. Finally, it provides an overview of Detroit Edison's general rate case and notes the importance of energy legislation passing in Michigan.
DTE Energy reported its business and financial results for 2007. Key points include:
- Operating earnings for 2007 were $2.82 per share, driven by strong results across utility and non-utility segments.
- Detroit Edison and MichCon earned near their authorized returns on equity despite challenges from new computer systems.
- Non-utility segments like coal/gas midstream and energy trading significantly contributed to earnings.
- The company is making investments to grow its utilities and pipelines, with plans to file an updated rate case for Detroit Edison.
This document summarizes a presentation by Ameren, a regional electric and gas utility, at the Morgan Stanley Energy & Electricity Conference in April 2008. It discusses Ameren's business plan to achieve operational excellence, improve customer service, demonstrate environmental leadership, and maximize shareholder value. Financially, Ameren expects near-term regulatory lag due to rising costs but significant longer-term earnings growth from rate cases and increasing regulated investments. Regulated returns currently support earnings growth and regulated investment plans are expected to grow rate base and earnings.
xcel energy 9_11EuropeanRoadShowPresentationSeptember2007finance26
This document provides an overview of Xcel Energy's business and financial performance from the perspective of the Vice President and CFO. It summarizes Xcel's operating regions, recent accomplishments, capital investment opportunities, environmental leadership, and financial outlook. The key messages are that Xcel delivers low-risk returns through regulated utilities, has a strong pipeline of investment opportunities, and is positioned to continue delivering earnings and dividend growth through 2011 by executing on its capital plans.
xcel energy 1D KEnvironmental_Leadership_Xcel_Energy_12052007finance26
This document outlines Xcel Energy's strategy for achieving financial success through environmental leadership. The strategy focuses on growing their core regulated utility business while meeting environmental challenges like reducing emissions by 2020. Key elements of the strategy include investing in regulated utility infrastructure, increasing renewable energy generation and company-owned transmission, enhancing regulatory frameworks to support clean energy, and improving customer understanding of clean energy costs and benefits. The strategy aims to achieve 5-7% annual EPS growth and 2-4% annual dividend growth while transitioning to a cleaner energy supply mix by 2020.
xcel energy 1DKxcel energy Environmental_Leadership_Xcel_Energy_12052007finance26
This document outlines Xcel Energy's strategy for achieving financial success through environmental leadership. The strategy focuses on growing their core regulated utility business while meeting environmental challenges like reducing emissions by 2020. Key elements of the strategy include investing in regulated utility infrastructure, increasing renewable energy generation and company-owned transmission, enhancing regulatory frameworks to support clean energy, and improving customer understanding of clean energy costs and benefits. The strategy aims to achieve 5-7% annual EPS growth and 2-4% annual dividend growth while transitioning to a cleaner energy supply mix by 2020.
George Tyson, Vice President and Treasurer of Xcel Energy, presented at a West Coast seminar on February 15, 2007. He outlined Xcel Energy's strategy of investing in regulated utility operations to meet customer needs, provide environmental leadership, and earn a reasonable return. Significant planned capital investments include projects to upgrade power plants, expand renewable energy and transmission infrastructure, and potentially build an IGCC plant with carbon sequestration. Tyson projected 2007 earnings per share of $1.35 to $1.45.
This document summarizes a presentation given by Dick Kelly, the Chairman, President and CEO of Xcel Energy, at the 2007 EEI Financial Conference. The presentation discusses Xcel Energy's strategy to address climate change and carbon regulation by stabilizing or reducing carbon emissions from electric service by 2020. This will be achieved through increasing renewable energy, upgrading nuclear plants, expanding energy efficiency programs, and replacing inefficient generation. The strategy positions Xcel Energy for regulatory success and continued leadership in environmental stewardship.
xcel energy BAC_Presentation_112007_Finalfinance26
Ben Fowke, Vice President and CFO of Xcel Energy, discusses the company's strategy to achieve financial success through environmental leadership. Xcel aims to stabilize or reduce carbon emissions from electricity by 2020 through renewable energy, energy efficiency, upgrading plants, and evaluating carbon capture technology. This strategy positions the company for anticipated climate regulation while maintaining reasonable customer rates and regulatory support for investments. Fowke outlines capital spending projections and enhanced recovery mechanisms that can deliver earnings and dividend growth.
xcel energy BAC_Presentation_112007_Finalfinance26
Ben Fowke, CFO of Xcel Energy, discusses the company's strategy to achieve financial success through environmental leadership and addressing climate change. Xcel plans to stabilize or reduce carbon emissions by 2020 through increasing renewable energy, upgrading plants, expanding energy efficiency programs, and potentially carbon capture technology. This strategy positions the company for continued regulatory approval and investment opportunities under future carbon regulation.
This document provides an overview and update on Integrys Energy Group for August 2008. It discusses forward-looking statements and risks, Integrys' vision and regulated utilities business, key investments and projects including American Transmission Company and Weston 4, upcoming regulated utility rate cases, and prospects for future growth. Integrys serves over 2 million utility customers across the Midwest and has nonregulated energy services operating in the Northeast US and parts of Canada.
Progress Energy held a financial conference in Phoenix, Arizona on November 10-11, 2008. The conference focused on providing an overview of the company including its growth strategy and regulatory updates. Progress Energy is the largest regulated electric utility in the US with significant projected rate base growth through 2010 driven by investments in its regulated operations in North Carolina and Florida. Regulatory proceedings in both states approved various cost recovery filings which will support continued investment and earnings growth.
xcel energy 9_8888LehmanConfPresentation952007SECfinance26
The document is a presentation by Dick Kelly, Chairman and CEO of Xcel Energy, at a Merrill Lynch conference on September 25, 2007. Kelly summarizes Xcel's value proposition as a low-risk regulated utility with opportunities for investment and environmental leadership. He outlines the company's accomplishments in 2007, upcoming capital investment opportunities, and expectations for continued earnings per share growth of 5-7% and dividend growth of 2-4% per year through strong capital expenditure programs and constructive regulation.
xcel energy 4_10MinneapolisInvestorMtgSECApril2007finance26
This document summarizes a presentation given by Xcel Energy to investors. It outlines Xcel's strategy of investing in regulated utility infrastructure to drive sustainable earnings growth of 5-7% annually. It highlights Xcel's leadership in renewable energy and environmental initiatives. The presentation also reviews Xcel's constructive regulatory relationships and mechanisms to recover costs and earn fair returns on investments.
Progress Energy reported first quarter 2008 results. Earnings were lower than expected due to milder than normal weather and lower customer growth and usage, particularly in Florida. The company reaffirmed its 2008 earnings guidance. Several regulatory filings and projects remained on track. Key nuclear, natural gas, and transmission projects were progressing to increase capacity and meet renewable energy goals. While economic conditions had softened retail demand, cost management and additional wholesale contracts were expected to offset impacts.
This presentation by Barry Davis, President and CEO of NAPTP, provides an overview of NAPTP and forward-looking statements. It discusses non-GAAP financial measures used by EnLink Midstream such as adjusted EBITDA, gross operating margin, and segment cash flows. It then summarizes EnLink Midstream's assets including gas gathering pipelines, processing plants, NGL transportation and fractionation facilities. Finally, it provides brief biographies of members of EnLink Midstream's management team.
This document summarizes Xcel Energy's strategy to reduce carbon emissions while growing earnings. It outlines plans to increase renewable energy and energy efficiency, upgrade plants, and invest in new natural gas generation and transmission. Specific resource plans for Minnesota and Colorado are detailed that would reduce carbon emissions through 2020. The company expects constructive regulation to support capital investments and rate base growth of 7.5% annually through 2011.
This document summarizes Xcel Energy's strategy to reduce carbon emissions while growing earnings. Key points include:
- Xcel aims to reduce carbon emissions 20-30% by 2020-2025 while achieving 5-7% annual EPS growth and increasing dividends 2-4% annually.
- Plans for Minnesota and Colorado include adding significant renewable energy like wind and solar, retiring some coal plants, and expanding energy efficiency programs.
- Xcel has constructive regulation allowing recovery of investment in areas like transmission, renewables and environmental upgrades.
- The company expects to invest $2-2.5 billion annually through 2011 to grow its rate base 7.5% annually and deliver earnings growth.
This document provides an overview and summary of Xcel Energy's strategy to reduce carbon emissions while growing earnings. Key points include:
- Xcel aims to achieve annual EPS growth of 5-7% and increase its dividend by 2-4% annually while reducing carbon emissions 30% by 2020.
- Resource plans in Minnesota and Colorado seek approval for increasing renewable energy, demand side management programs, and natural gas generation to reduce carbon emissions.
- Constructive regulation and a pipeline of investment opportunities in areas like transmission, renewables and environmental upgrades provide earnings growth potential.
- Xcel is well positioned geographically and through its diverse portfolio to comply with potential climate change legislation and be an environmental leader.
The document discusses Joseph Rigby's presentation on the strategic positioning of Southeast Utilities. It summarizes the company's strategic focus on power delivery, Conectiv Energy, and Pepco Energy Services. It also outlines the goals for the power delivery business, including sales growth, infrastructure investment, operational excellence, and constructive regulatory outcomes to deliver average annual earnings growth of at least 4%. Key infrastructure projects are highlighted.
The document summarizes a presentation given by Joseph M. Rigby, CFO of Pepco Holdings, Inc. (PHI) at an investor conference on March 28, 2006. The presentation outlines PHI's strategy to remain a regional diversified energy delivery and competitive services company focused on operational excellence. It discusses PHI's power delivery business, Conectiv Energy, and Pepco Energy Services. The presentation also provides financial performance summaries and projections showing PHI's ability to cover dividends and capital expenditures with cash from operations.
The document provides an overview and summary of PHI's strategy and performance across its various business segments. PHI aims to remain a regional diversified energy delivery and competitive services company focused on value creation and operational excellence. Key aspects include achieving constructive regulatory outcomes and 4% annual earnings growth for its power delivery utilities, optimizing assets and market opportunities for Conectiv Energy, and expanding Pepco Energy Services into additional markets. Financial performance has been positively impacted by infrastructure investments and sales growth, though earnings have been reduced in some jurisdictions due to higher standard offer service pricing.
This document provides an overview of PHI and its strategy for positioning itself for success in a dynamic industry. PHI's strategy is to remain a diversified regional energy delivery and competitive services company focused on value creation and operational excellence. For its power delivery utility operations, PHI's goals are to operate with excellence, achieve constructive regulatory outcomes, invest in infrastructure, and deliver at least 4% annual average earnings growth. PHI's service territory has a robust economy that is less susceptible to downturns and includes diverse government and private sectors.
This document provides an overview of PHI's 41st EEI Financial Conference held from November 5-8, 2006. It includes sections on PHI's financial performance for Q3 and year-to-date 2006, drivers of performance, sales and customer trends, regulated distribution summaries, upcoming regulatory activities including transmission formula rate filings and rate cases, and PHI's proposed MAPP transmission project. Key highlights are lower sales due to mild weather, lower transmission revenue, and plans to file rate cases in late 2006/early 2007.
This document provides an overview and summary of Power Holdings Inc.'s (PHI) various business segments. It discusses PHI's regulated electric and gas delivery business, which accounts for 67% of operating income. It also summarizes Conectiv Energy's competitive merchant generation and load service business, which accounts for 33% of operating income. Key highlights from rate cases and recent regulatory activities involving PHI's delivery businesses are also provided. The document contains forward-looking statements and non-GAAP financial measures.
The document provides an overview of Pepco Holdings Inc.'s (PHI) power delivery business and regulatory environment. It summarizes PHI's sales and customer growth projections, infrastructure investment strategy including the proposed Mid-Atlantic Power Pathway transmission project and Blueprint for the Future initiative. Recent distribution rate case outcomes for PHI's utilities are also summarized. The document is intended as a presentation for investors on PHI's positioned for success through its regulated electric and gas delivery business.
The document provides an overview of Pepco Holdings Inc.'s (PHI) various businesses including its regulated electric and gas delivery business, competitive energy generation business, and energy services business. It discusses PHI's infrastructure investment strategies, the status of major projects like the Mid-Atlantic Power Pathway, and the company's regulatory environment. Financial projections show expectations for continued investment and growth across PHI's businesses.
The document discusses Pepco Holdings' strategic focus on infrastructure investments and customer programs to position the company for continued success. It outlines plans to invest $1.2 billion in the Mid-Atlantic Power Pathway transmission project through 2014 and $646 million in advanced metering infrastructure and other programs through the company's Blueprint for the Future initiative between 2008-2014. Regulatory support is essential for cost recovery for these investments, which aim to enhance reliability, manage costs and protect the environment for customers.
This document provides an overview of Pepco Holdings' transmission and distribution business. It discusses plans to invest over $5 billion from 2007-2012 to upgrade aging infrastructure and improve reliability. A key project is the $1.05 billion Mid-Atlantic Power Pathway, a 230-mile 500kV transmission line from Northern Virginia to Southern New Jersey to be completed by 2013. The presentation outlines the project timeline, environmental stewardship efforts, and cost recovery approach through PJM and FERC. It also reviews the company's focus on replacing aging transmission equipment to further enhance reliability.
The document provides an overview of Pepco Holdings, Inc.'s (PHI) strategy to build shareholder value. PHI aims to increase investment in infrastructure through its Blueprint programs to modernize its electric grid. It also plans growth for its competitive energy businesses, Conectiv Energy and Pepco Energy Services. PHI expects its regulated Power Delivery business to remain the primary driver of earnings, contributing 60-70% of operating income over the planning period through infrastructure investments and favorable regulatory outcomes.
This document provides an overview of Pepco Holdings, Inc.'s power delivery business. It discusses planned infrastructure investments totaling $4.99 billion from 2008-2012 to improve reliability, support load growth, and implement new technology. A key project is the $1.05 billion Mid-Atlantic Power Pathway transmission line. The document also reviews regulatory highlights, including recent rate cases, and outlines operational and financial summaries for the company's distribution and transmission businesses.
- Pepco Holdings held its annual meeting and provided its annual report to shareholders.
- In 2002, Pepco Holdings earned $210.5 million in consolidated earnings, or $1.61 per share. Earnings were driven by strong performance from regulated utility businesses and some competitive energy businesses.
- The letter discusses the company's strategy, leadership, and financial and operational performance across its various business segments in 2002. It also encourages shareholders to vote and continue supporting the company.
- Pepco Holdings provided its first annual report after merging Pepco and Conectiv in August 2002.
- In 2002, PHI earned $210.5 million, or $1.61 per share, on $4.3 billion in revenue. Excluding merger costs, earnings were $1.74 per share.
- The letter discusses the company's regulated utility and competitive energy businesses, noting stable earnings from utilities and growth potential from competitive businesses. It encourages shareholders to vote and thanks them for their confidence and investment.
This document provides a summary of Pepco Holdings' 2004 annual report and proxy statement. Key points include:
1) Pepco Holdings reported improved financial performance in 2004 with consolidated earnings of $258.7 million, up from $113.5 million in 2003, driven by improved performance of competitive energy businesses.
2) The company made progress on reducing debt and preferred stock by $480 million in 2004 and achieved a total shareholder return of over 22% for 2003-2004.
3) The regulated power delivery business continues as the primary focus and driver of steady cash flow. Earnings from this segment improved to $233.4 million in 2004.
4) Competitive energy businesses also posted
The document provides details on Pepco Holdings' 2003 performance and future plans. It discusses challenges faced in 2003 including an energy trading loss, Mirant's bankruptcy, and Hurricane Isabel. However, actions taken in 2003 such as divesting non-core businesses and reducing risk are expected to set the stage for future earnings growth. The company remains focused on strengthening its core power delivery business and improving customer satisfaction.
This document provides a summary of Pepco Holdings' 2004 annual report and proxy statement. Key points include:
1) Pepco Holdings reported improved financial performance in 2004 with consolidated earnings of $258.7 million, up from $113.5 million in 2003, driven by improved performance of competitive energy businesses.
2) The company made progress on reducing debt and preferred stock by $480 million in 2004 as part of its balance sheet improvement goals.
3) The regulated power delivery business continues as the primary focus due to its stability and cash generation. Earnings from this segment grew to $233.4 million in 2004.
4) Competitive energy businesses also posted profits in 2004 despite challenging markets
The document is the 2005 annual report and proxy statement from PHI (Pepco Holdings Inc.). It discusses PHI's strategy of focusing on stable power delivery and growing energy businesses. In 2005, PHI achieved earnings of $371.2 million and strengthened its balance sheet by paying down over $1 billion in debt. Rising energy prices present challenges for PHI and its customers. The proxy statement announces the annual meeting to elect directors and ratify the independent auditor.
Vicinity Jobs’ data includes more than three million 2023 OJPs and thousands of skills. Most skills appear in less than 0.02% of job postings, so most postings rely on a small subset of commonly used terms, like teamwork.
Laura Adkins-Hackett, Economist, LMIC, and Sukriti Trehan, Data Scientist, LMIC, presented their research exploring trends in the skills listed in OJPs to develop a deeper understanding of in-demand skills. This research project uses pointwise mutual information and other methods to extract more information about common skills from the relationships between skills, occupations and regions.
Falcon stands out as a top-tier P2P Invoice Discounting platform in India, bridging esteemed blue-chip companies and eager investors. Our goal is to transform the investment landscape in India by establishing a comprehensive destination for borrowers and investors with diverse profiles and needs, all while minimizing risk. What sets Falcon apart is the elimination of intermediaries such as commercial banks and depository institutions, allowing investors to enjoy higher yields.
Financial Assets: Debit vs Equity Securities.pptxWrito-Finance
financial assets represent claim for future benefit or cash. Financial assets are formed by establishing contracts between participants. These financial assets are used for collection of huge amounts of money for business purposes.
Two major Types: Debt Securities and Equity Securities.
Debt Securities are Also known as fixed-income securities or instruments. The type of assets is formed by establishing contracts between investor and issuer of the asset.
• The first type of Debit securities is BONDS. Bonds are issued by corporations and government (both local and national government).
• The second important type of Debit security is NOTES. Apart from similarities associated with notes and bonds, notes have shorter term maturity.
• The 3rd important type of Debit security is TRESURY BILLS. These securities have short-term ranging from three months, six months, and one year. Issuer of such securities are governments.
• Above discussed debit securities are mostly issued by governments and corporations. CERTIFICATE OF DEPOSITS CDs are issued by Banks and Financial Institutions. Risk factor associated with CDs gets reduced when issued by reputable institutions or Banks.
Following are the risk attached with debt securities: Credit risk, interest rate risk and currency risk
There are no fixed maturity dates in such securities, and asset’s value is determined by company’s performance. There are two major types of equity securities: common stock and preferred stock.
Common Stock: These are simple equity securities and bear no complexities which the preferred stock bears. Holders of such securities or instrument have the voting rights when it comes to select the company’s board of director or the business decisions to be made.
Preferred Stock: Preferred stocks are sometime referred to as hybrid securities, because it contains elements of both debit security and equity security. Preferred stock confers ownership rights to security holder that is why it is equity instrument
<a href="https://www.writofinance.com/equity-securities-features-types-risk/" >Equity securities </a> as a whole is used for capital funding for companies. Companies have multiple expenses to cover. Potential growth of company is required in competitive market. So, these securities are used for capital generation, and then uses it for company’s growth.
Concluding remarks
Both are employed in business. Businesses are often established through debit securities, then what is the need for equity securities. Companies have to cover multiple expenses and expansion of business. They can also use equity instruments for repayment of debits. So, there are multiple uses for securities. As an investor, you need tools for analysis. Investment decisions are made by carefully analyzing the market. For better analysis of the stock market, investors often employ financial analysis of companies.
OJP data from firms like Vicinity Jobs have emerged as a complement to traditional sources of labour demand data, such as the Job Vacancy and Wages Survey (JVWS). Ibrahim Abuallail, PhD Candidate, University of Ottawa, presented research relating to bias in OJPs and a proposed approach to effectively adjust OJP data to complement existing official data (such as from the JVWS) and improve the measurement of labour demand.
STREETONOMICS: Exploring the Uncharted Territories of Informal Markets throug...sameer shah
Delve into the world of STREETONOMICS, where a team of 7 enthusiasts embarks on a journey to understand unorganized markets. By engaging with a coffee street vendor and crafting questionnaires, this project uncovers valuable insights into consumer behavior and market dynamics in informal settings."
In a tight labour market, job-seekers gain bargaining power and leverage it into greater job quality—at least, that’s the conventional wisdom.
Michael, LMIC Economist, presented findings that reveal a weakened relationship between labour market tightness and job quality indicators following the pandemic. Labour market tightness coincided with growth in real wages for only a portion of workers: those in low-wage jobs requiring little education. Several factors—including labour market composition, worker and employer behaviour, and labour market practices—have contributed to the absence of worker benefits. These will be investigated further in future work.
1. Elemental Economics - Introduction to mining.pdfNeal Brewster
After this first you should: Understand the nature of mining; have an awareness of the industry’s boundaries, corporate structure and size; appreciation the complex motivations and objectives of the industries’ various participants; know how mineral reserves are defined and estimated, and how they evolve over time.
5 Tips for Creating Standard Financial ReportsEasyReports
Well-crafted financial reports serve as vital tools for decision-making and transparency within an organization. By following the undermentioned tips, you can create standardized financial reports that effectively communicate your company's financial health and performance to stakeholders.
2. Safe Harbor Statement
The information contained herein is as of the date of this presentation. DTE Energy expressly disclaims any current intention to
update any forward-looking statements contained in this document as a result of new information or future events or developments.
Words such as “anticipate,” “believe,” “expect,” “projected” and “goals” signify forward-looking statements. Forward-looking
statements are not guarantees of future results and conditions but rather are subject to various assumptions, risks and
uncertainties. This presentation contains forward-looking statements about DTE Energy’s financial results and estimates of future
prospects, and actual results may differ materially. Factors that may impact forward-looking statements include, but are not limited
to: the potential requirement to refund proceeds received from synfuel partners; the uncertainties of successful exploration of gas
shale resources and inability to estimate gas reserves with certainty; the effects of weather and other natural phenomena on
operations and sales to customers, and purchases from suppliers; economic climate and population growth or decline in the
geographic areas where we do business; environmental issues, laws, regulations, and the cost of remediation and compliance,
including potential new federal and state requirements that could include carbon and more stringent mercury emission controls, a
renewable portfolio standard and energy efficiency mandates; nuclear regulations and operations associated with nuclear facilities;
impact of electric and gas utility restructuring in Michigan, including legislative amendments and Customer Choice programs;
employee relations and the impact of collective bargaining agreements; unplanned outages; access to capital markets and capital
market conditions and the results of other financing efforts which can be affected by credit agency ratings; the timing and extent of
changes in interest rates; the level of borrowings; changes in the cost and availability of coal and other raw materials, purchased
power and natural gas; effects of competition; impact of regulation by the FERC, MPSC, NRC and other applicable governmental
proceedings and regulations, including any associated impact on rate structures; contributions to earnings by non-utility
subsidiaries; changes in and application of federal, state and local tax laws and their interpretations, including the Internal
Revenue Code, regulations, rulings, court proceedings and audits; the ability to recover costs through rate increases; the
availability, cost, coverage and terms of insurance; the cost of protecting assets against, or damage due to, terrorism; changes in
and application of accounting standards and financial reporting regulations; changes in federal or state laws and their interpretation
with respect to regulation, energy policy and other business issues; amounts of uncollectible accounts receivable; binding
arbitration, litigation and related appeals; changes in the economic and financial viability of our suppliers, customers and trading
counterparties, and the continued ability of such parties to perform their obligations to the Company; and timing, terms and
proceeds from any asset sale or monetization. This presentation should also be read in conjunction with the “Forward-Looking
Statements” section in each of DTE Energy’s and Detroit Edison’s 2007 Form 10-K and 2008 Forms 10-Q (which sections are
incorporated herein by reference), and in conjunction with other SEC reports filed by DTE Energy and Detroit Edison.
2
3. Introduction
Participants
• Gerry Anderson, President and COO
• Dave Meador, Executive Vice President and CFO
• Lisa Muschong, Director of Investor Relations
Presentation Outline
• Michigan Energy Legislation & Detroit Edison Rate Case Update
• Non-Utility Business Update
• Earnings Guidance Update
3
4. Legislation Will Be a Historical Step in
Improving Michigan’s Energy Policies
• Four bills passed Michigan House
• Next step is to reconcile bills
on April 17 on a bi-partisan vote
between the two chambers
and moved to Senate
• Primary differences are in
• On June 27, two bills passed the
renewables/energy efficiency
Michigan Senate on a bi-partisan
provisions
vote
• Completion of legislation backed by a broad coalition including the Michigan
Chamber of Commerce, Michigan Manufacturers Association, labor organization
members, business leaders and the energy industry
• Governor has expressed strong support for appropriate energy reform/renewables
package
4
5. Michigan Legislation
Continues to Move Forward
House Bill 5524 House Version Senate Version
• Caps Choice at 10% of load
Electric Choice
• Same
• Defines rules for customers returning to utility
reform
service
Cost-of-service • Phase in cost-of-service rates, 5 year period
• Phases in cost-of-service based rates over a 5
based electric rates for businesses and 10 year period for
year period
(deskewing) residential customers
• Provides for self-implementation 6 months from
File and use filing
• Same
ratemaking • Establishes 12 month hard-stop deadline for rate
case completion and enhances MPSC staffing
• Allows for forward looking test year
• Provides for pre-approval for capital projects
Certificate of Need • Same
costing more than $500 million
process for major
capital investments • Allows recovery of interest during construction
5
6. Michigan Legislation
Continues to Move Forward (cont.)
Legislation House Version Senate Version
• 4% of energy from renewables in 2012 • 2% combined RPS and energy efficiency in 2011
• 10% in 2015 • 4% in 2012
Renewable
portfolio • 6% in 2014
standard • 7% in 2015
(HB 5548/5549, • Establishes cost caps and off-ramps to ensure • Establishes cost caps and off-ramps to ensure
Senate Bill 213) costs are manageable costs are manageable
• Program funded by setting a per-meter charge • Program funded by setting a per-meter charge
• Included above
• Ramps up targets to annual incremental savings
Energy
of 1% for electricity and 0.75% for gas
efficiency
• Establishes cost off-ramps to ensure reasonable • Included above
(HB 5525, costs
Senate Bill 213)
• Authorizes decoupling for gas utilities • Authorizes decoupling for gas utilities
6
7. Detroit Edison General Rate Case
Detroit Edison’s Estimated Revenue Requirements
• Rate request driven by required
$ millions
environmental investment
($120)
$130
– Strong record of recovery on
past environmental spending
$284
$14
($60) $60
$290 • Cost saving initiatives offset
almost all O&M increases
• Requesting $60 million merger
premium recovery
Capex ≈ Total Request
– Expect Michigan Supreme
Court to rule on merger
premium issue
($30)
• Staff and intervener testimony –
Merger Net Other 2009
2006 Capital O&M Cost Net
July 15, 2008
Control (Incl. Request
Normalized Savings Revenue /
Premium Benefits &
Fuel &
Taxes)
Purchased
• Final order expected January 2009
Power
7
8. Sources and Uses of Monetization
Proceeds and Synfuel Cash
Monetization After-Tax Proceeds and Synfuel Cash Sources
~$2B ~$2B
• Completed monetization efforts
~$1.7B were a success with over $1 billion
in total proceeds
Debt Paydown
Synfuel
& Utility Equity
Synfuel
$900M
• Monetization and synfuel proceeds
(2007-2008)
were used to buy back stock, pay
Core Barnett
down debt and invest in our
Antrim Forward
Peakers
Sales
growing utilities
Monetization
Share
Antrim
Proceeds
• Additional source of funds will be
Repurchase
$800M
provided by future monetizations
of Barnett properties
Original Sources Uses
Guidance
8
9. Barnett Shale Properties Positioned
to Produce Future Shareholder Value
Zones of
DTE Acreage
• Fundamentals are very supportive
Clay
Vertical Wells
– Strong gas/oil prices
Horizontal Wells
– Services readily available
• DTE development of Western assets progressing
– Economic success in all 5 areas where we have
Jack Wise
Denton
focused drilling activity
– 70% of revenue from natural gas, 30% oil/gas liquids
Dallas/
Ft Worth
Palo Pinto Parker
Metropolitan
• Recent Core Barnett monetization very successful
Area
Tarrant
– $250 million sale price
62,000 acres
– 100% after-tax IRR
Hood
• Market continues to be very supportive for sellers
Johnson
Erath
– Will look to monetize when conditions are
Somervell
appropriate
– In some areas, could happen in 2008
Hill
Bosque
9
10. Power & Industrial (P&I) Update
• Fundamentals in our P&I business have improved
materially over the last year
– Earnings growing
– Forecasting continued growth
– ROIC strong
• Fundamentals in the asset sale/monetization market
have weakened over last year
– Sellers’ market has flipped to buyers’ market
– Driven by persistent debt market dynamics
• Given this, monetization doesn’t maximize
shareholder value
– Neutral to 2008 earnings
– Monetization would now be dilutive in 2009/2010
• As a result, DTE is:
– Discontinuing work on P&I monetization
– Raising 2008 operating earnings guidance and
2009 early outlook to reflect retention 10
11. Our Consistent Value-Focused Approach to
Power & Industrial Investments Continues
to Be Successful
2008 to 2009 Expected
Power & Industrial Projects
Operating Earnings* Earnings Drivers
$ millions
$40 – 50
$25 – 35
• Improvements in economics of
(includes $5M of D&A
existing project base
expense deferred from 2007)
• New acquisition and new industrial
$5 D&A deferral
project coming on line for full year
in 2009
$21
• Future renewable and industrial
project development would provide
2007 2008E 2009E
growth after 2009
EBITDA* $80 $90 $130
ROIC 10% 11% 13%
ROE** 14% 15% 18%
11
* Reconciliation to GAAP reported earnings included in the appendix
** Assumes ~ 50/50 debt/equity
12. DTE Energy’s Business Mix
% of Operating Earnings*
2008E
Other Non-
regulated
10%
• Going forward, we expect to
Power &
maintain an operating earnings
Industrial
5%
mix of approximately:
– 80 – 85% regulated
FERC/MPSC
Regulated
– 15 – 20% non-regulated
Pipes &
Storage Detroit Edison
7% 63%
MichCon
15%
Regulated = 85%
Non-Regulated = 15%
12
* Excludes Corporate and Other, reconciliation to GAAP reported earnings included in appendix
13. Raising 2008 Operating Earnings Guidance,
Maintaining EPS Guidance
Operating Earnings*
($ millions)
Prior 2008 New 2008
Guidance Guidance
Detroit Edison experienced a
Detroit Edison $350 - 370 $340 - 360
catastrophic storm in June
MichCon 85 - 90 85 - 90
Extra 2 quarters of earnings from retaining
Coal & Gas Midstream 45 - 50 45 - 50
projects, partially offset by expensing
Power & Industrial Projects 10 - 20 25 - 35 depreciation deferred while projects were
classified as “held for sale”
Unconventional Gas Production 3-5 5 - 10
Higher projected earnings due to
Energy Trading 40 - 55 40 - 55
favorable gas and oil prices
Corporate & Other (80 - 85) (80 - 85)
Operating Earnings $448 - 510 $455 - 520
Higher earnings offset higher shares
Operating EPS $2.80 - 3.20 $2.80 - 3.20 outstanding
Average Shares Outstanding** 159 million 163 million
Share repurchase program completed
13
* Reconciliation to GAAP reported earnings included in the appendix
** Prior guidance assumed $275 million stock buyback in June 2008, new guidance assumes no stock buyback in 2008
14. Raising 2009 Non-Utility Outlook to Reflect
Higher Power & Industrial Project Earnings
Operating Earnings*
2008 2009 Early
($ millions)
Guidance* Outlook*
+14%
Detroit Edison $340 - 360 $390 - 410
+6%
MichCon 85 - 90 90 - 95
Revised
to reflect
+13%
Non-Utility 115 - 150 135 - 165** retention
of P&I
Corporate & Other (80 - 85) (75 - 80)
+6%
Projected Average Shares Outstanding 163M 163M
14
* Reconciliation to GAAP reported earnings included in the appendix
** Prior 2009 early outlook was $105-$140 million for Non-Utility
15. DTE Energy:
A Focused, Integrated Energy Strategy
Execute strong regulated growth plan
• Realize projected utility earnings growth
– Near-term: 7 - 9% per year
– Long-term: 5 - 6% per year
– Upside potential from renewables
• Manage constructive regulatory environment
– Use cost savings to minimize rate increases
• Advocate for comprehensive energy policy that will
promote growth in Michigan
Execute value-focused non-utility plan
• Proven track record of non-utility value creation
• Reduced scale and disciplined approach focused on:
– Premium return on investment
– Long-term value creation
Continue to pay an attractive dividend
• $2.12 per share 15
16. Contact Us
DTE Energy Investor Relations
www.dteenergy.com/investors
313-235-8030
16
18. Our Sustainable Dividend is Very Competitive
As utility earnings increase, our payout ratio will improve, providing
flexibility to consider further dividend increases
Industry Dividend Yield
June 25, 2008
6% DTE 4.9%
5%
4%
3%
2%
1%
0%
18
N
I
C
P
U
ST
S
P
G
G
L
T
P
C
W
PL
ED
G
TE
FE
L
SO
TE
R
R
EC
N
XE
M
N
FP
PG
LN
VV
AE
SR
N
EX
SC
PC
ET
TE
W
PN
N
D
D
C
C
W
19. Power & Industrial Projects
Provide Utility-Like Services to
Select, Energy-Intensive Industries
Power & Industrial Asset Type Value Proposition
Own interest in 4 coke batteries Market location, supply / demand
• •
Coke Battery Expect to produce 2 million Product quality
• •
tons of coke in 2008
(metallurgical coal) Operational excellence
•
Long-term contracts for inputs and output
•
Own 3 pulverized coal injection Cost savings through fuel switching – using
• •
Pulverized Coal projects pulverized coal instead of high-priced
gas/oil/coke
Expect to produce 1.3 million
Injection •
tons in 2008 Output under long term contract
•
17 on-site projects Labor savings / O&M efficiency
• •
Service contracts at 13 Fuel switching / energy savings
• •
On-Site Energy additional projects Long-term contracts with plant closing
•
protections
26 landfill gas recovery sites Cost-competitive, reliable green power
• •
across the US (produced 23.5 Fuel switching – substitute biomass /
•
Renewables Bcf in 2007) biogas for natural gas
2 biomass fired facilities
•
19
20. Power & Industrial Projects Has a Low
Risk Business Strategy
DTE’s P&I Business is relatively low risk. The P&I group leverages our
utility operating experience to provide “private utility” services to select
energy-intensive industries.
Long-Term • P&I projects have long-term contracts, typically from 10-20 years
Contracts
– On-site advantage gives us a high probability of contract renewal
Strong
• Invest at customer sites with long-term viability in relation to competitive facilities
Customer
Sites
Limited
• Contracts are structured to require the customer to purchase commodities (or
Commodity
make them a pass-through obligation)
Risk
• Sales volume risk is limited due to the structure of contracts (take-or-pay or take-
Predictable if-tendered provisions or requirement contracts)
Cash • Predictable operating costs and maintenance cycles and projects employ
Flows relatively uncomplicated and proven technologies
20
• Minimal maintenance capital is typically required
21. Reconciliation of 2007
Reported to Operating Earnings
Use of Operating Earnings Information – DTE Energy management believes that operating earnings provide a more meaningful representation of the Company’s
earnings from ongoing operations and uses operating earnings as the primary performance measurement for external communications with analysts and investors.
Internally, DTE Energy uses operating earnings to measure performance against budget and to report to the Board of Directors.
2007 Net Income ($ millions)
Power & Uncov.
DTE Electric Gas Coal & Gas Energy Indust. Gas Corporate
Energy Utility Utility Midstream Trading Projects Prod. & Other Synfuel
Reported Earnings $971 $317 $70 $53 $32 $30 ($217) $481 $205
Performance Excellence Process (CTA) 7 - 6 - - 1 - - -
GCR Disallowance 6 - 6 - - - - - -
Detroit Thermal 17 17 - - - - - - -
Regulatory Asset Surcharge 6 6 - - - - - - -
Antrim Sale (334) - - - 21 - 211 (566) -
Exploratory Well Adjustment 17 - - - - - 17 - -
Synfuel Discontinued Operations (205) - - - - - - - (205)
Crete Sale (5) - - - - (5) - - -
Operating Earnings $480 $340 $82 $53 $53 $26 $11 ($85) $0
Coal Services $21
Gas Midstream $32
$53
21
22. Reconciliation of 2007 Power &
Industrial Reported Earnings to EBITDA
Use of EBITDA Information – DTE Energy management believes that EBITDA provides a meaningful representation of the company’s performance
and uses EBITDA as a complementary performance measure with earnings.
2007
Power &
Indust.
Projects
Reported Earnings $30
Income Taxes (5)
Interest 16
Depreciation & Amortization 39
EBITDA $80
22
23. Reconciliation of 2008 and 2009
Reported to Operating Earnings
Use of Operating Earnings Information – DTE Energy management believes that operating earnings provide a more meaningful representation of the company’s
earnings from ongoing operations and uses operating earnings as the primary performance measurement for external communications with analysts and investors.
Internally, DTE Energy uses operating earnings to measure performance against budget and to report to the Board of Directors.
Use of EBITDA Information – DTE Energy management believes that EBITDA provides a meaningful representation of the company’s performance
and uses EBITDA as a complementary performance measure with earnings.
In this presentation, DTE Energy provides 2008 guidance and 2009 early outlook for operating earnings. It
is likely that certain items which impact the company’s 2008 and 2009 reported results will be excluded
from operating results. A reconciliation to the comparable 2008 and 2009 reported earnings/net income
guidance/early outlook is not provided because it is not possible to provide a reliable forecast of specific
line items. These items may fluctuate significantly from period to period and may have a significant impact
on reported earnings.
In this presentation, DTE Energy provides 2008 and 2009 EBITDA for its Power & Industrial Projects
segment. It is possible that certain items which impact the company’s 2008 and 2009 reported results will
be excluded from operating results and EBITDA. A reconciliation to the comparable 2008 and 2009
reported earnings is not provided because it is not possible to provide a reliable forecast of specific line
items. These items may fluctuate significantly from period to period and may have a significant impact on
reported earnings.
23