SlideShare a Scribd company logo
1 of 30
IBM GLOBAL SERVICES Las Vegas, NV P04 Brett Allison Practical Performance Analysis  of DS8000 Storage Subsystems July 24 - 28, 2006 ® ©  IBM Corporation 2006
Trademarks & Disclaimer ,[object Object],[object Object],[object Object],[object Object],[object Object],[object Object],[object Object],[object Object],[object Object],[object Object],[object Object],[object Object],[object Object],[object Object],[object Object],[object Object],[object Object]
Table of Contents ,[object Object],[object Object],[object Object],[object Object],[object Object],[object Object],[object Object],[object Object],[object Object]
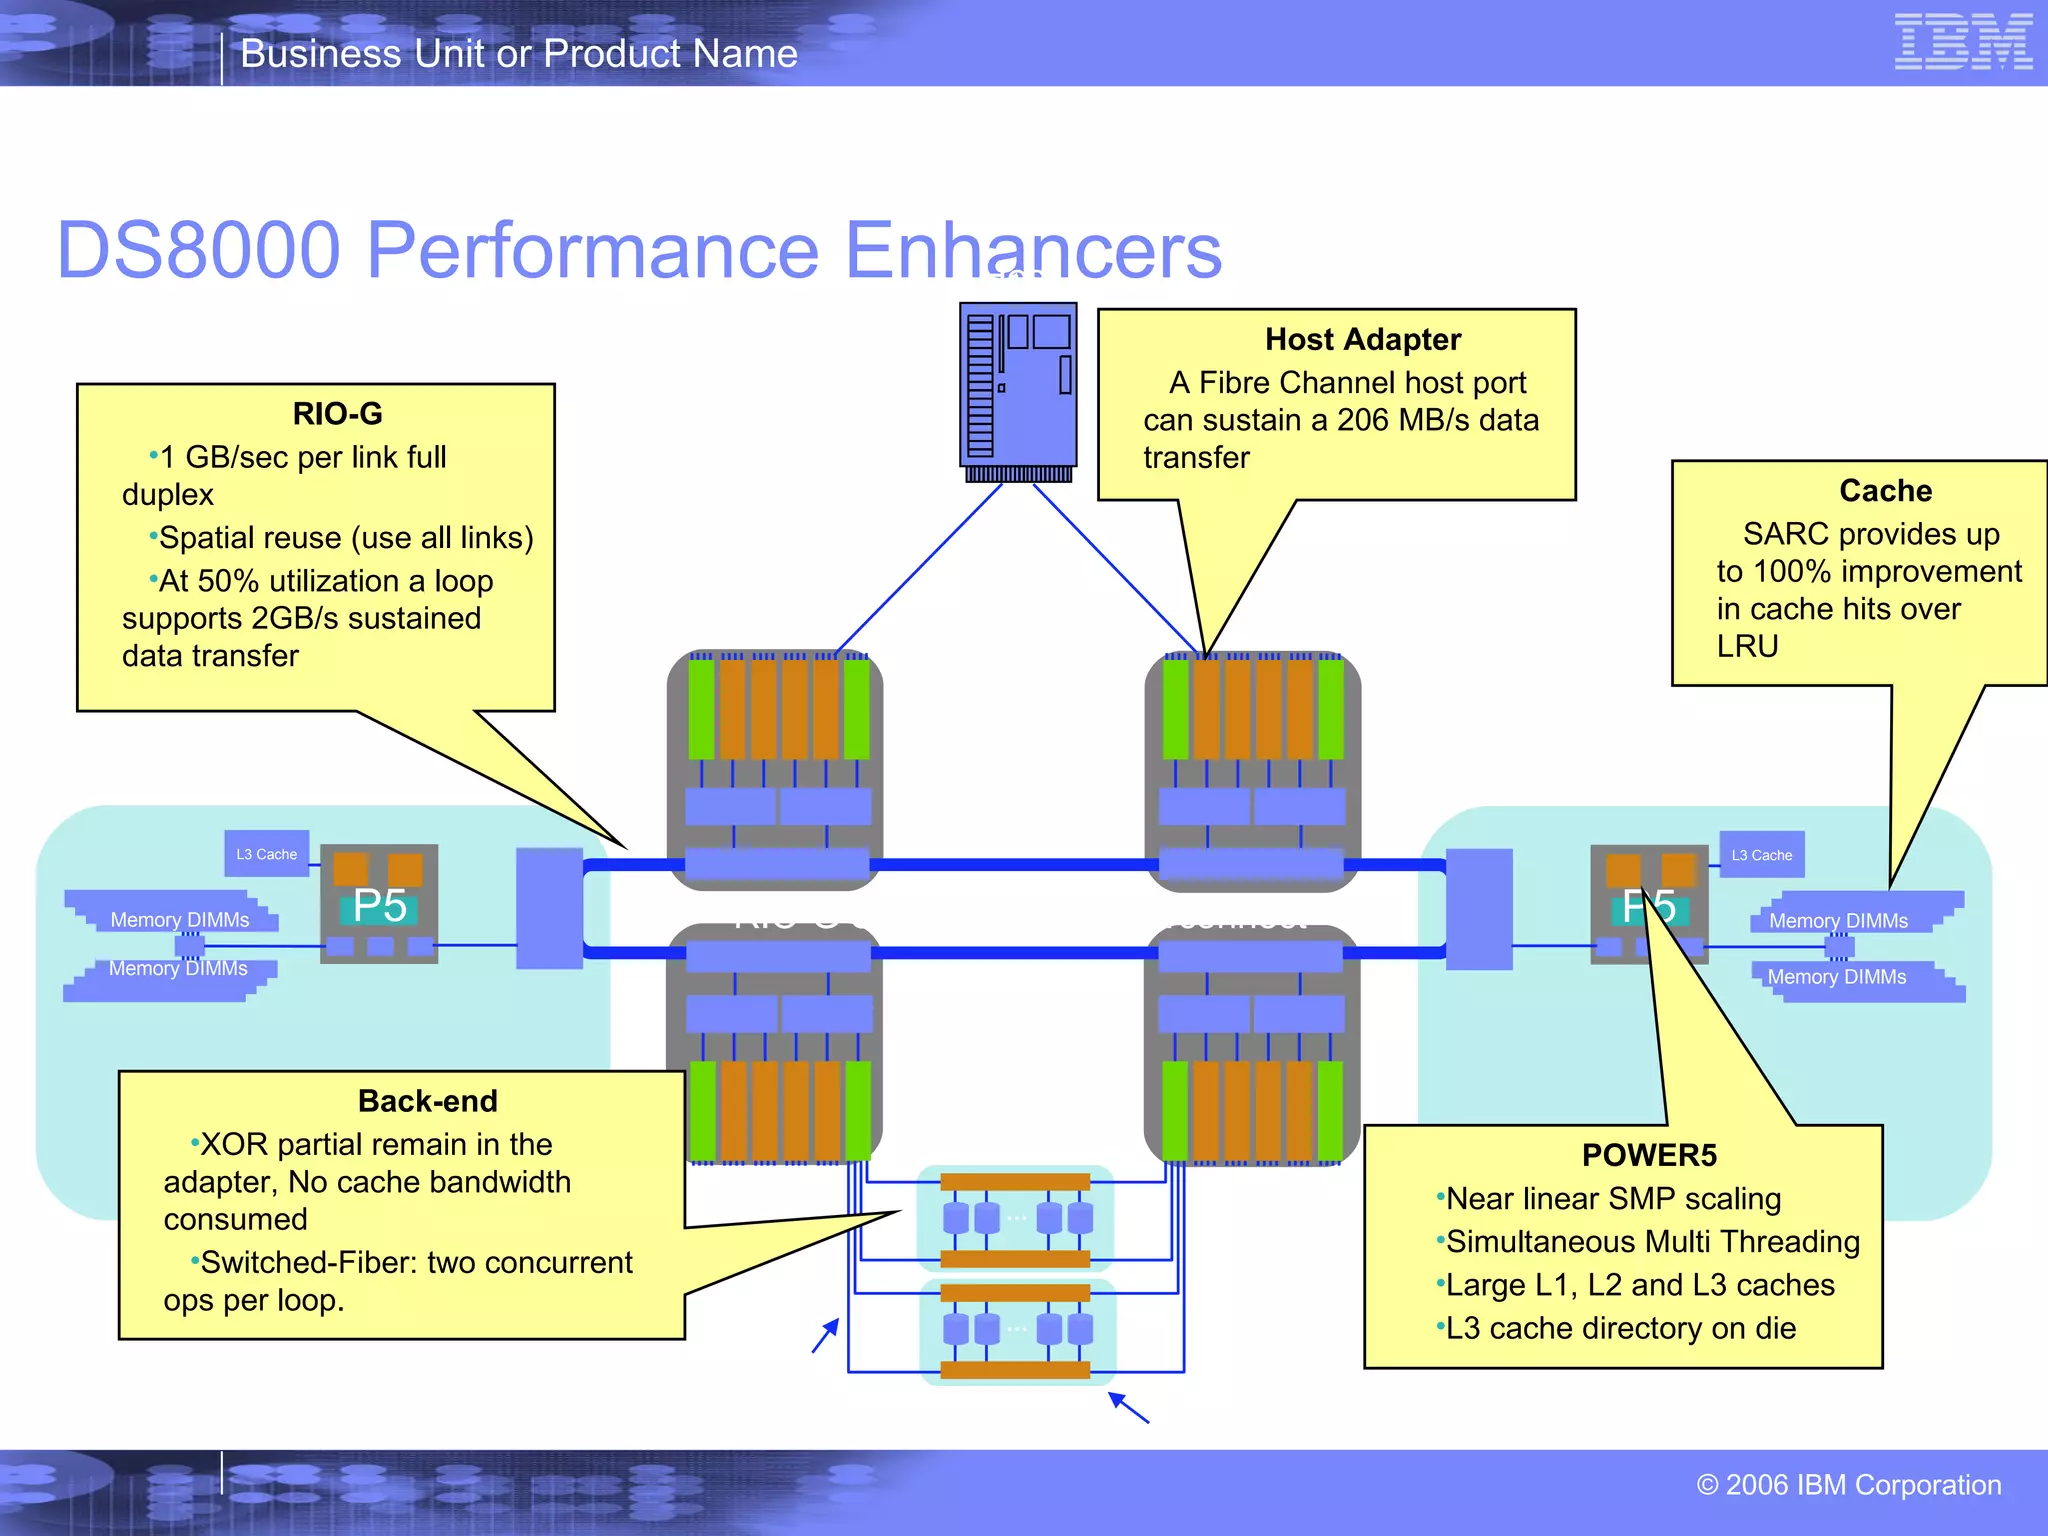
DS8000 Performance Enhancers Memory DIMMs Memory DIMMs P5 L3 Cache Host 2-way P5 570 Server 2-way P5 570 Server RIO-G Switched Fibre Interconnect 2Gb Fibre links Switched FC Disk Packs ,[object Object],[object Object],[object Object],[object Object],Host Adapter A Fibre Channel host port can sustain a 206 MB/s data transfer ,[object Object],[object Object],[object Object],[object Object],[object Object],[object Object],[object Object],[object Object],Cache SARC provides up to 100% improvement in cache hits over LRU … … Memory DIMMs Memory DIMMs P5 L3 Cache
Disk Magic Introduction ,[object Object],[object Object],[object Object]
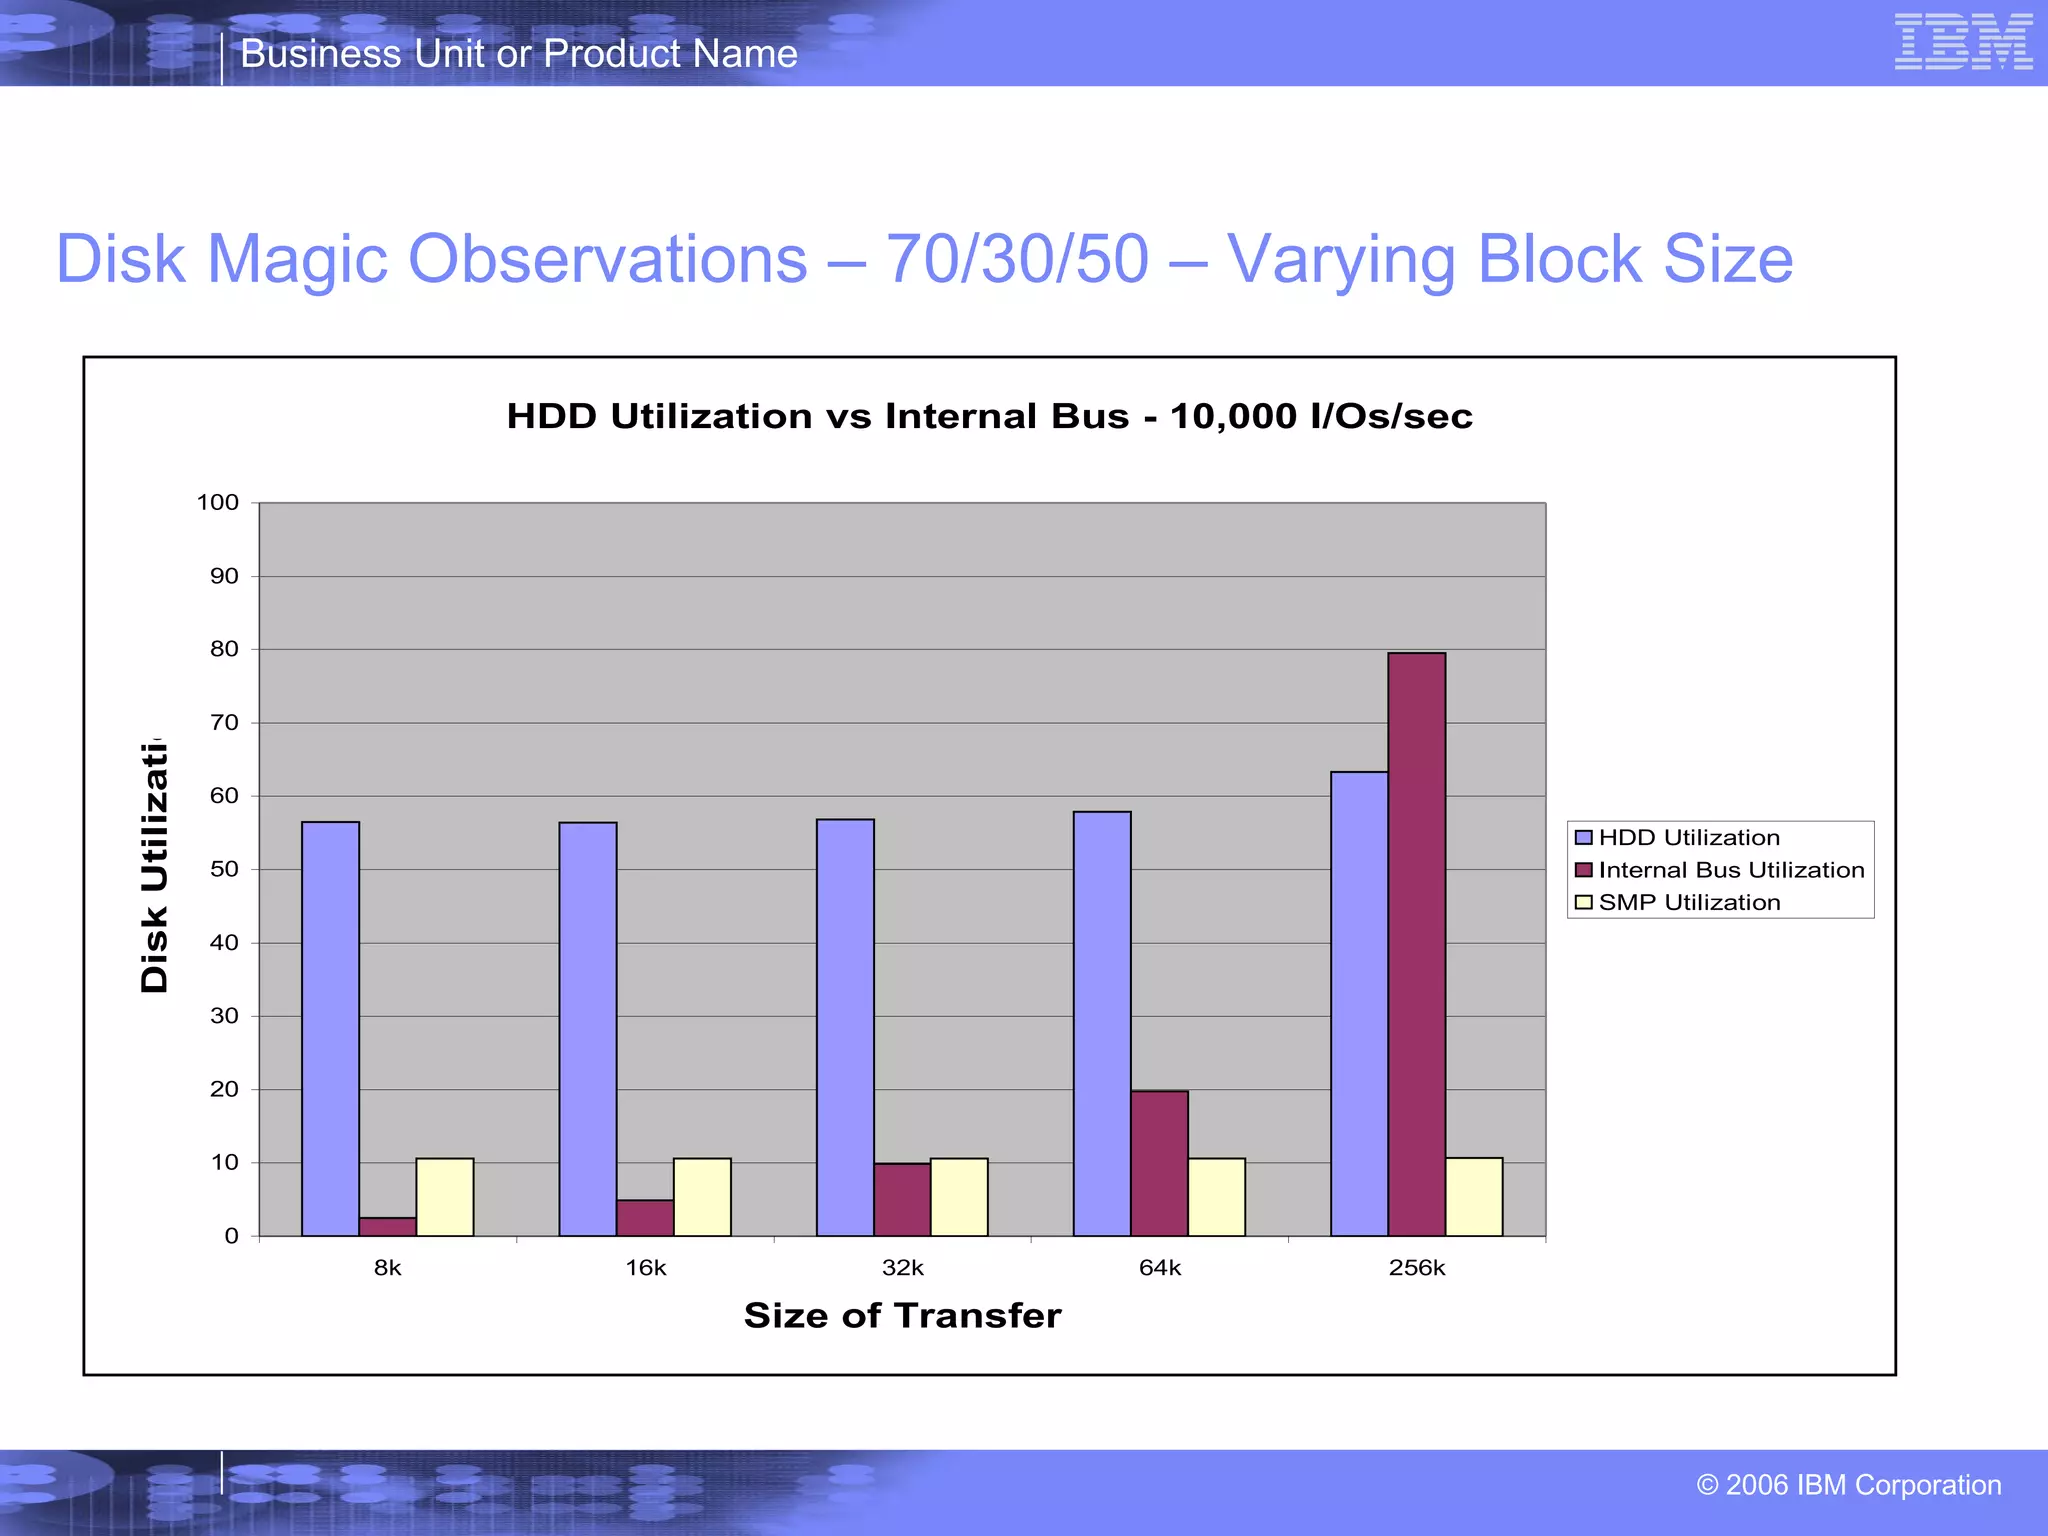
Disk Magic Observations – 70/30/50 – Varying Block Size
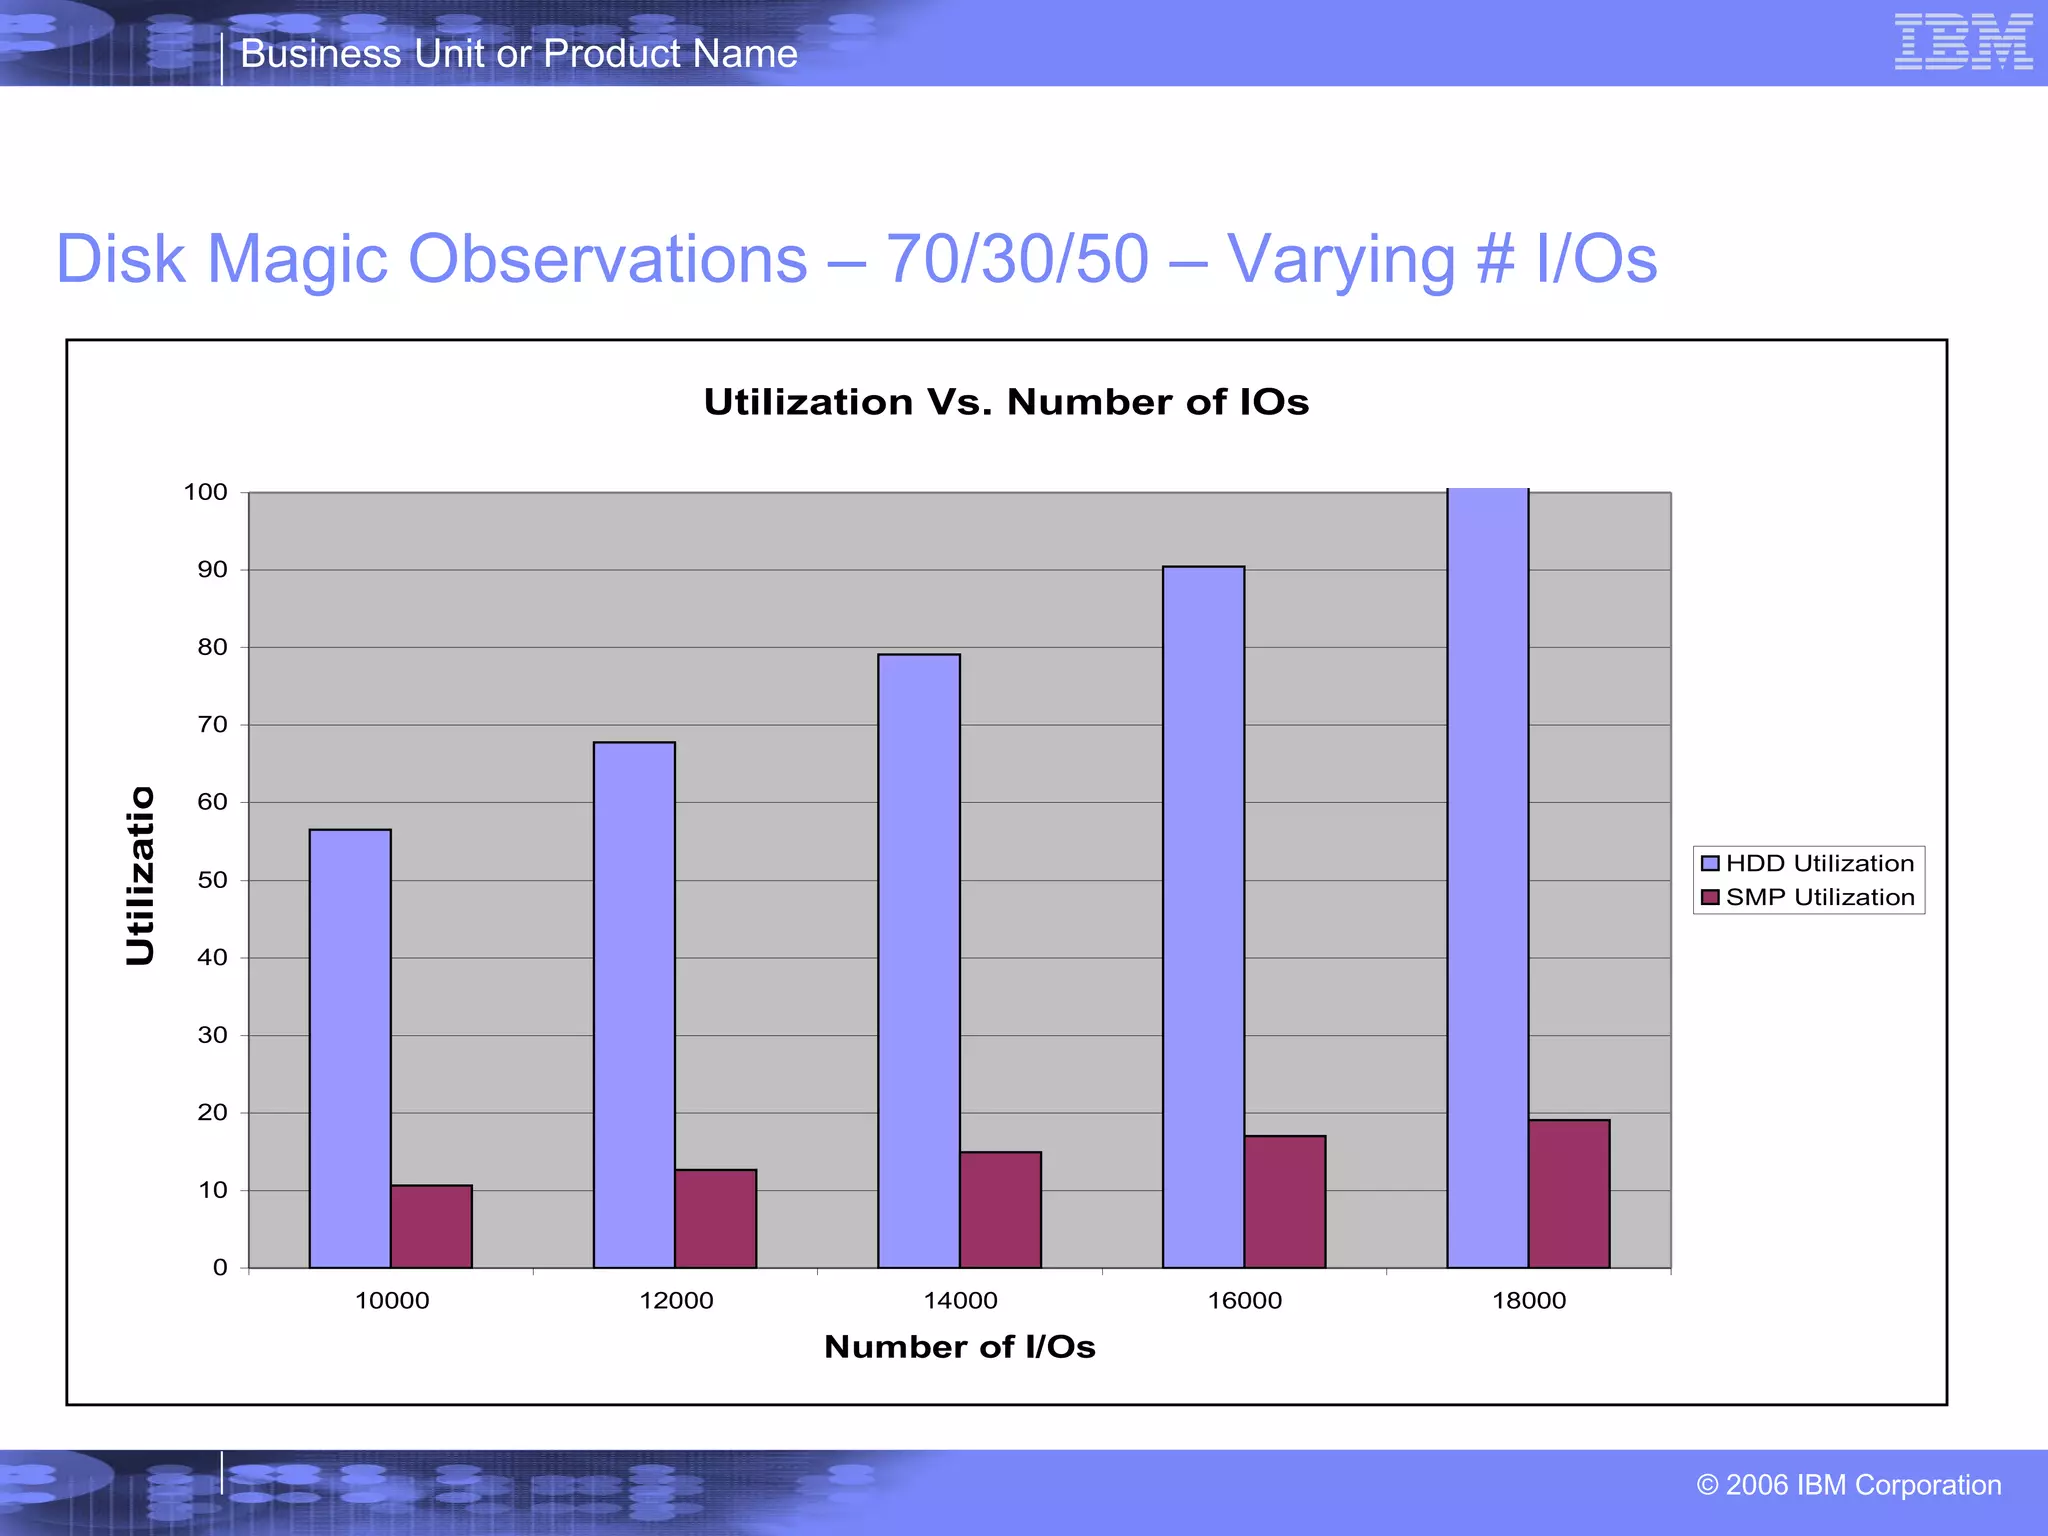
Disk Magic Observations – 70/30/50 – Varying # I/Os
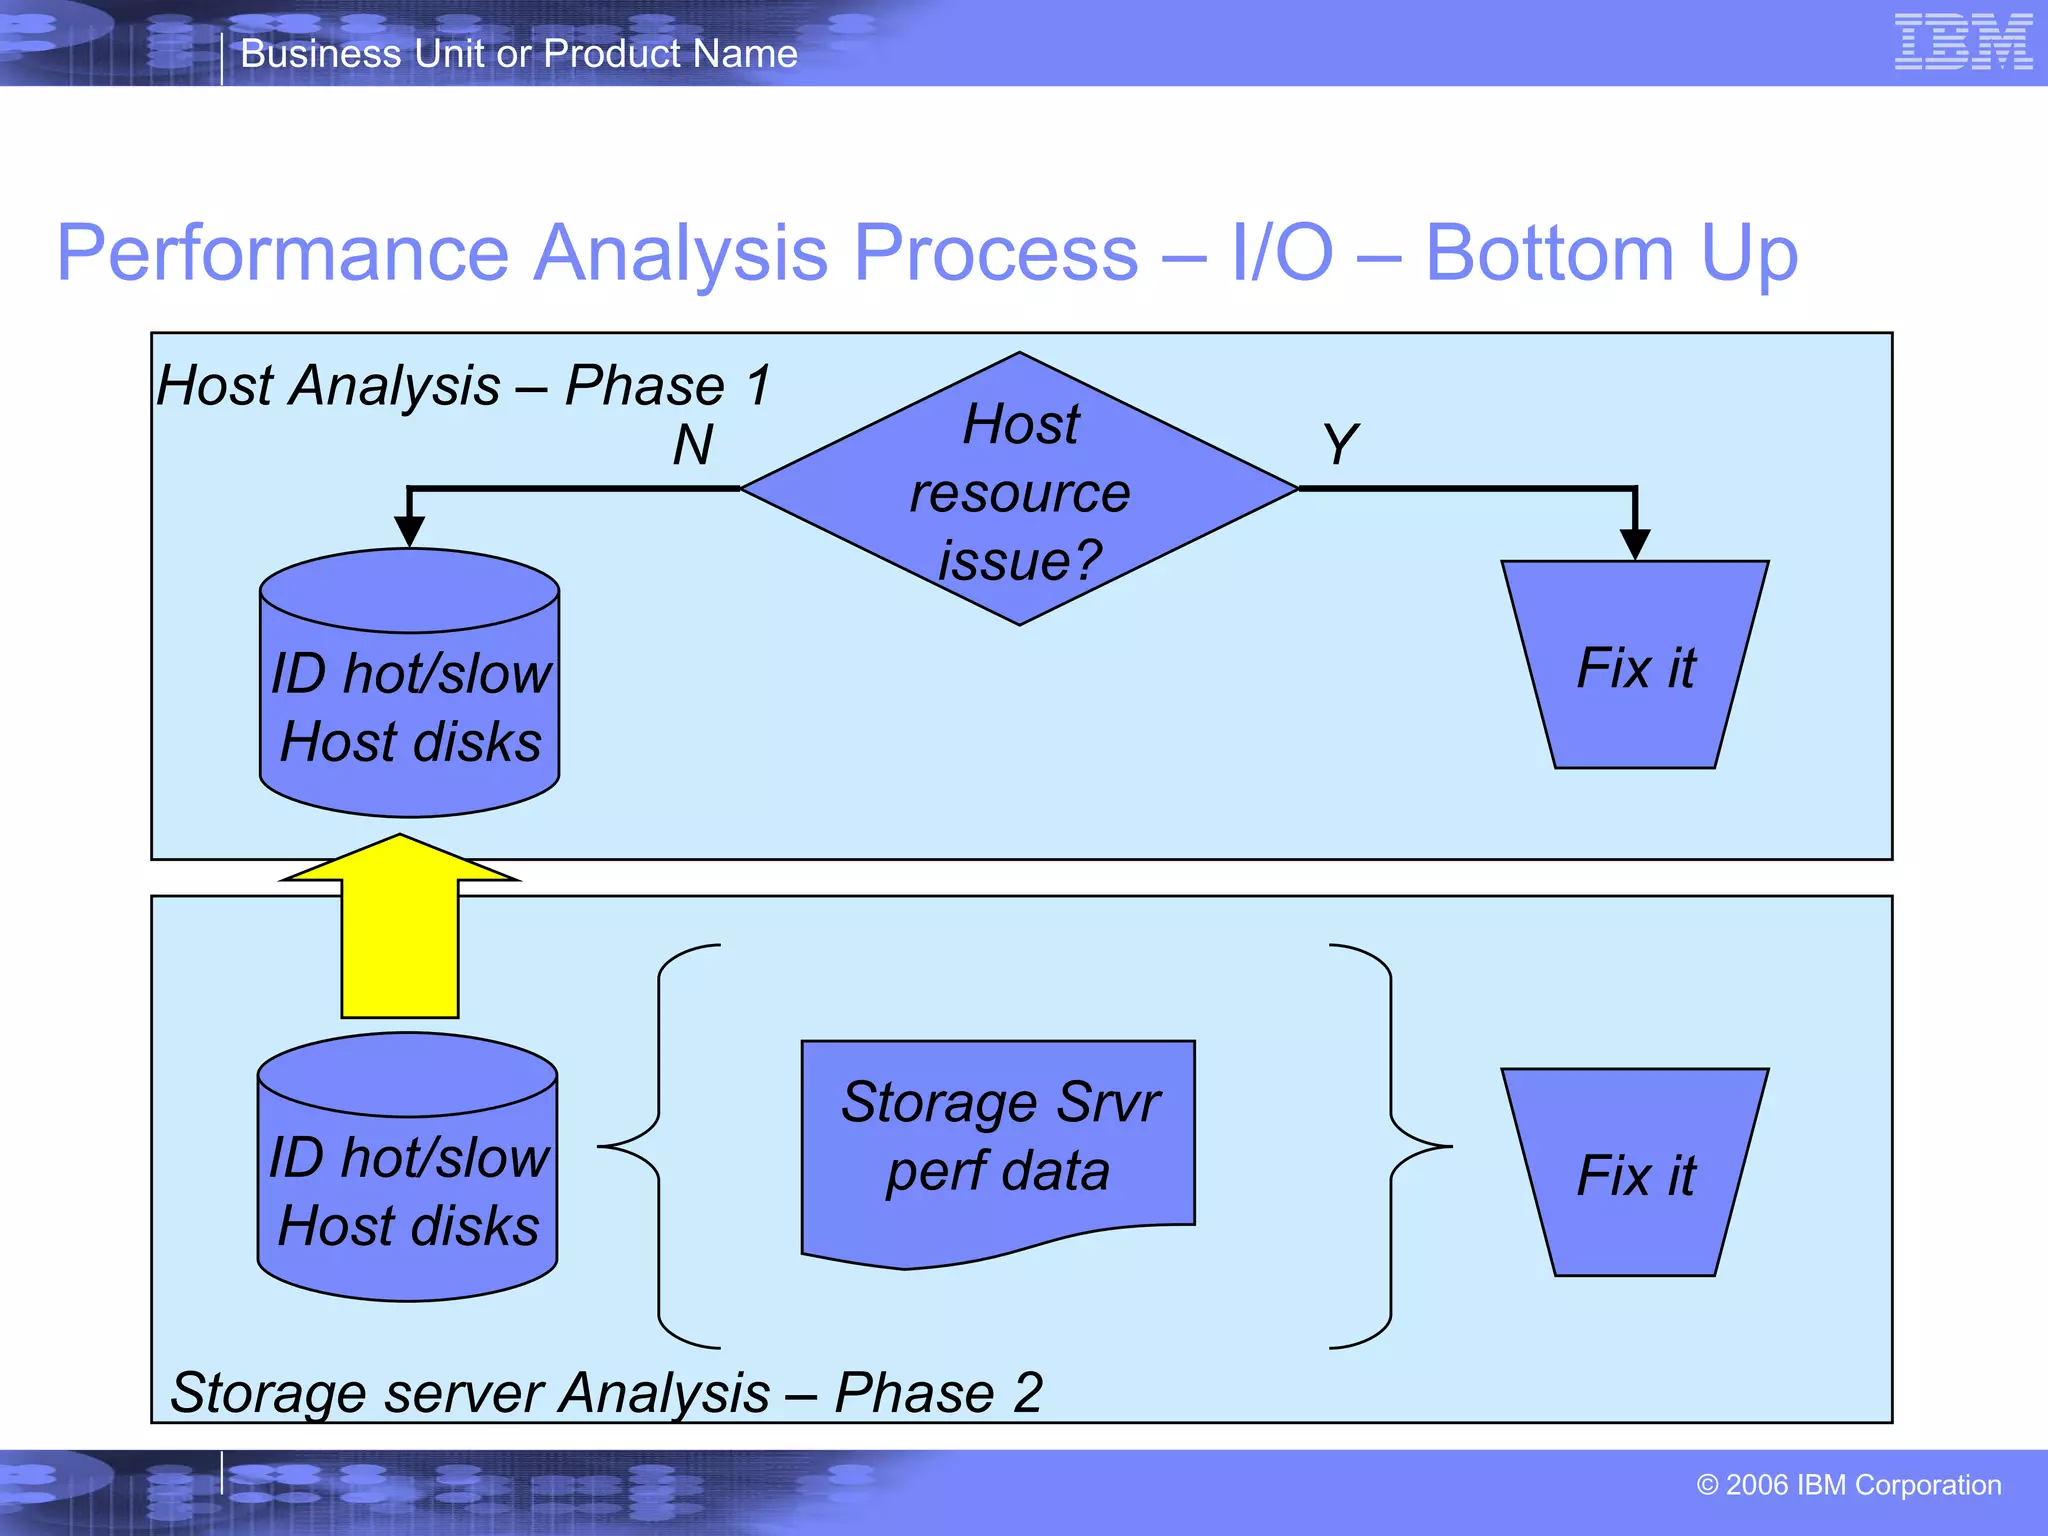
Performance Analysis Process – I/O – Bottom Up Host resource issue? Fix it ID hot/slow Host disks ID hot/slow Host disks Host Analysis – Phase 1 Storage server Analysis – Phase 2 Storage Srvr perf data Fix it N Y
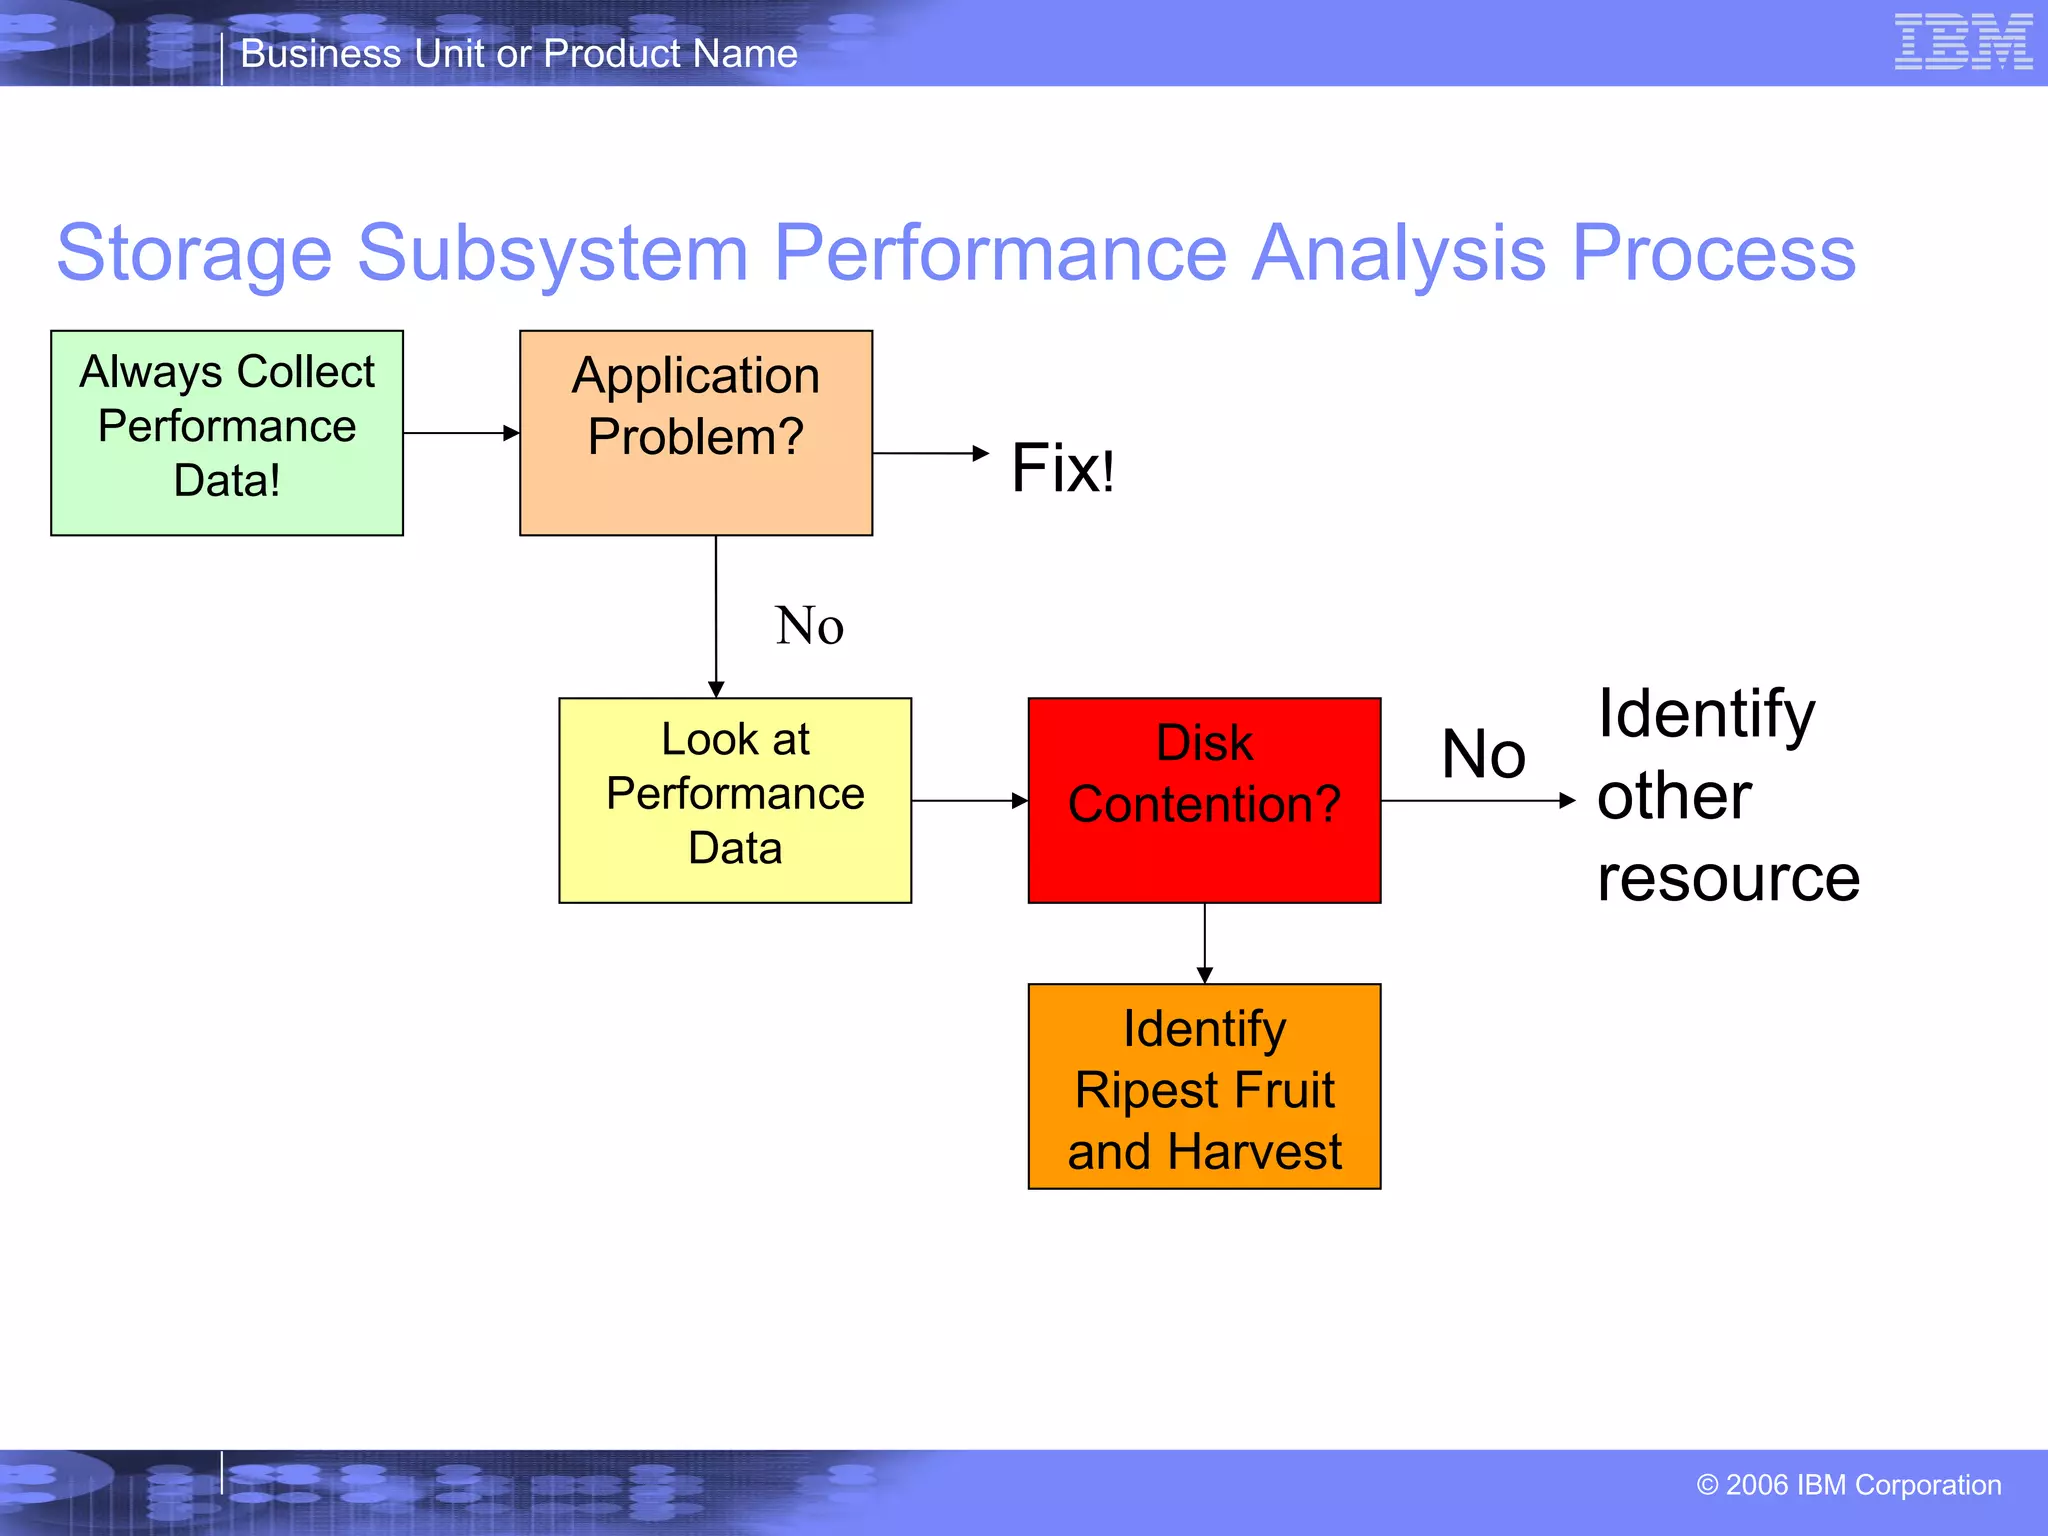
Storage Subsystem Performance Analysis Process Always Collect Performance Data! Application Problem? Disk Contention? Yes  Fix ! No  Look at Performance Data No  Identify other resource Identify Ripest Fruit and Harvest
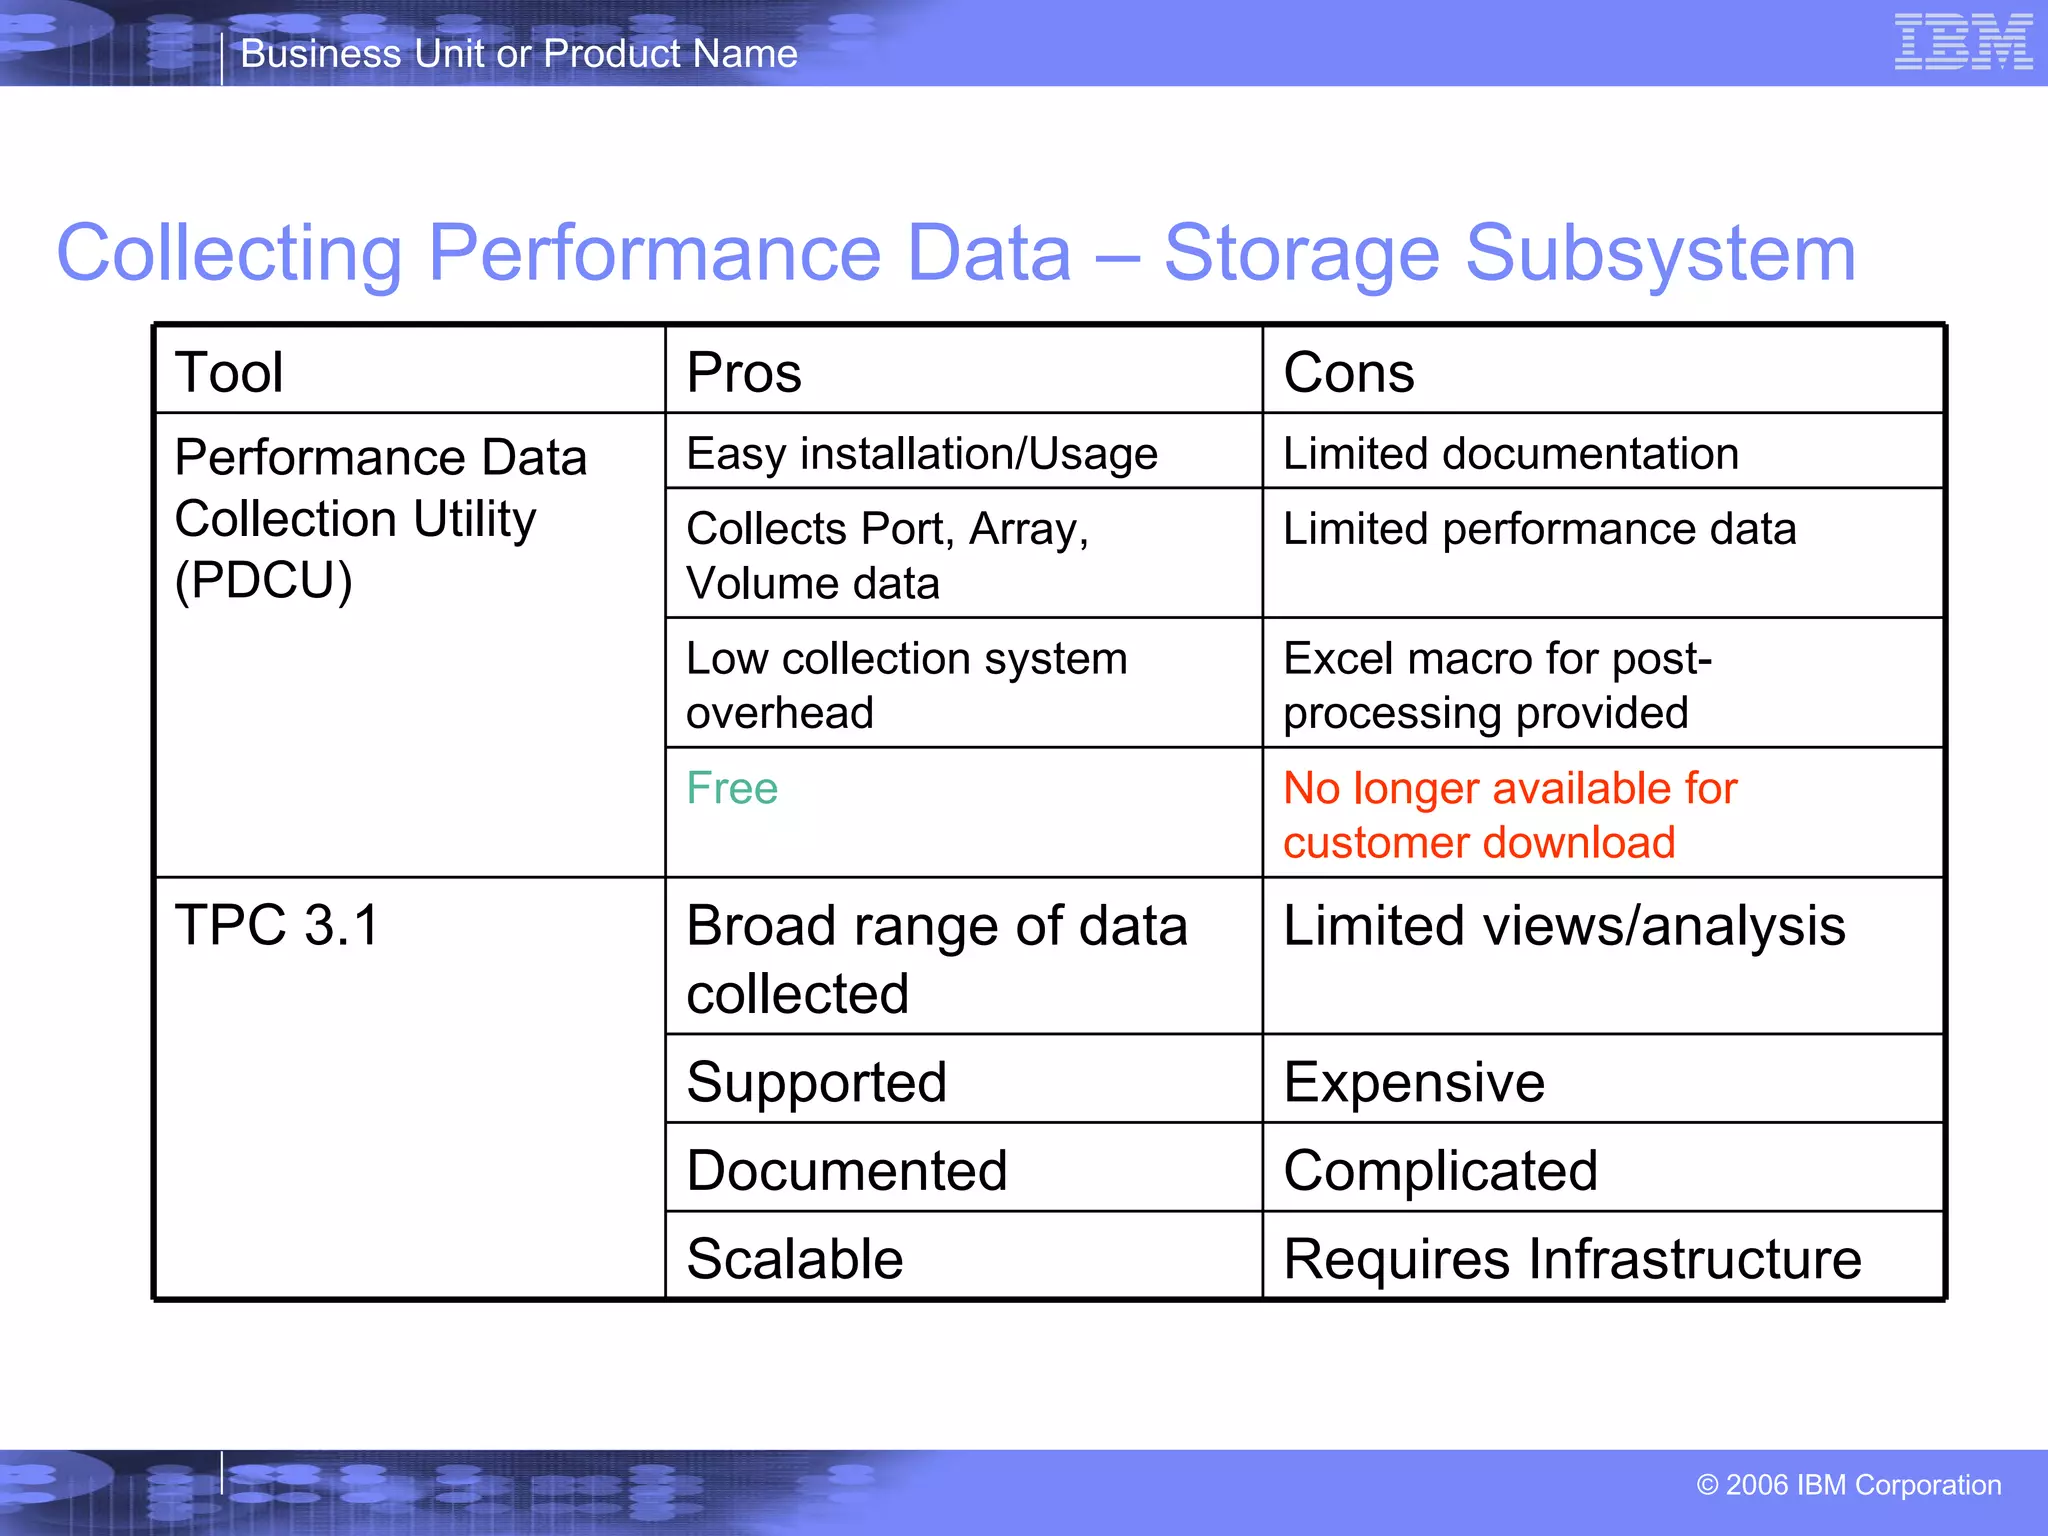
Collecting Performance Data – Storage Subsystem  Requires Infrastructure Scalable Complicated Documented Expensive Supported Limited views/analysis  Broad range of data collected TPC 3.1 No longer available for customer download Free Excel macro for post-processing provided Low collection system overhead Limited performance data Collects Port, Array, Volume data Limited documentation Easy installation/Usage Performance Data Collection Utility (PDCU) Cons Pros Tool
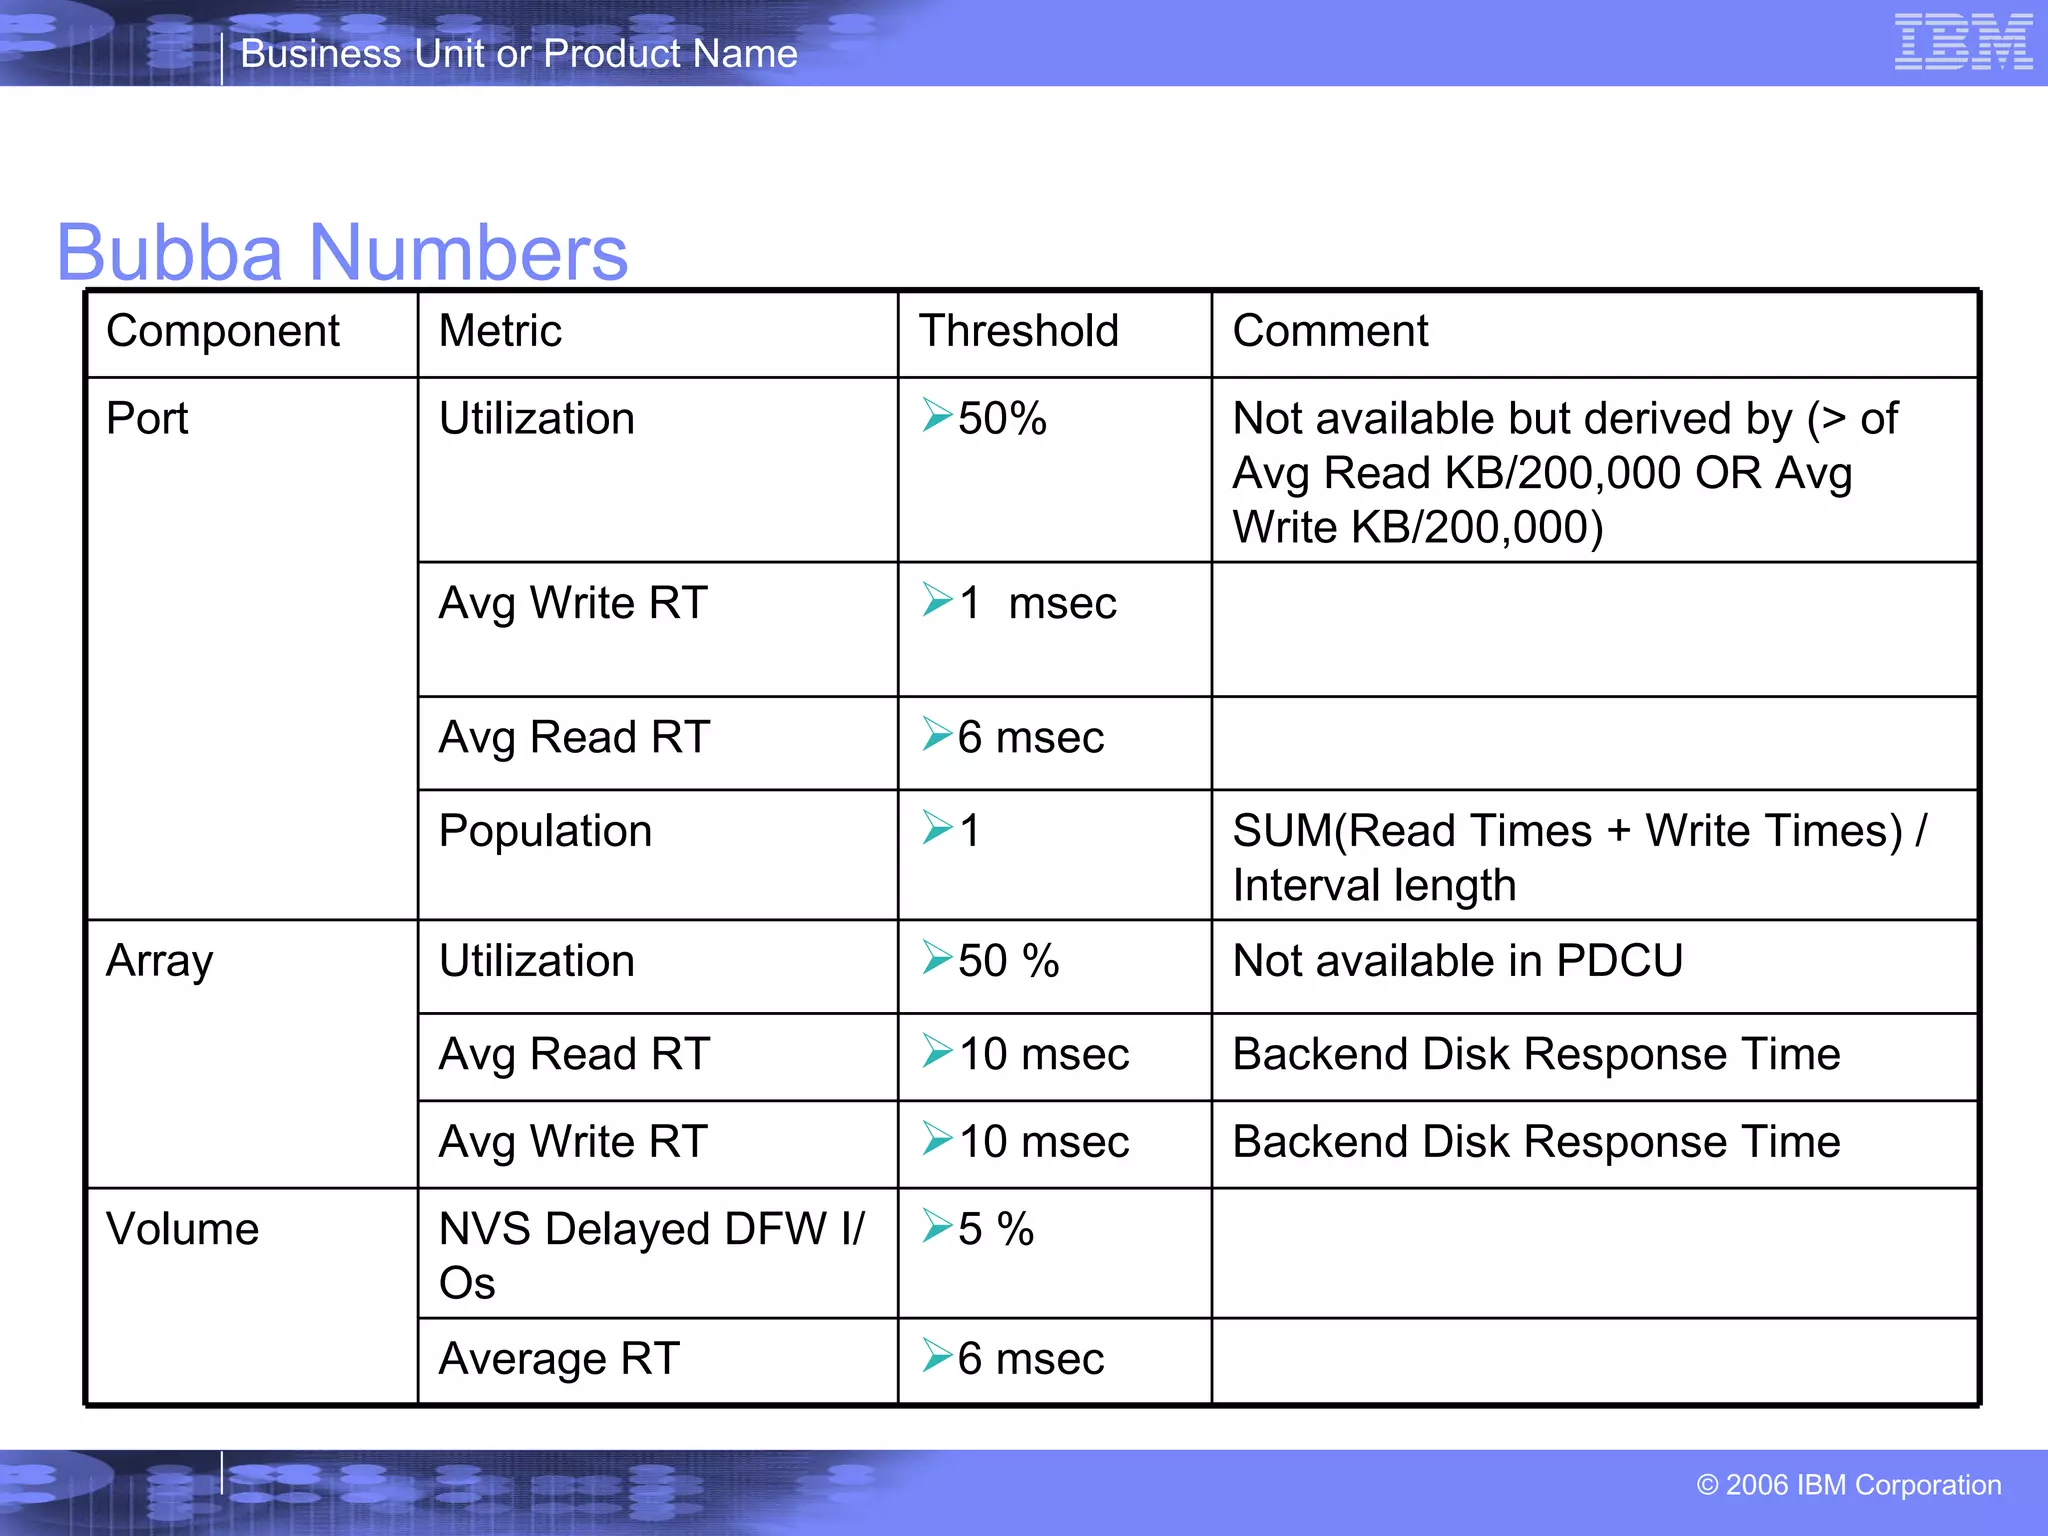
Bubba Numbers Not available but derived by (> of Avg Read KB/200,000 OR Avg Write KB/200,000) ,[object Object],Utilization ,[object Object],Avg Read RT SUM(Read Times + Write Times) / Interval length ,[object Object],Population Backend Disk Response Time ,[object Object],Avg Write RT Average RT NVS Delayed DFW I/Os Avg Read RT Utilization Avg Write RT Metric ,[object Object],[object Object],[object Object],[object Object],[object Object],Threshold Volume Backend Disk Response Time Not available in PDCU Array Port Comment Component
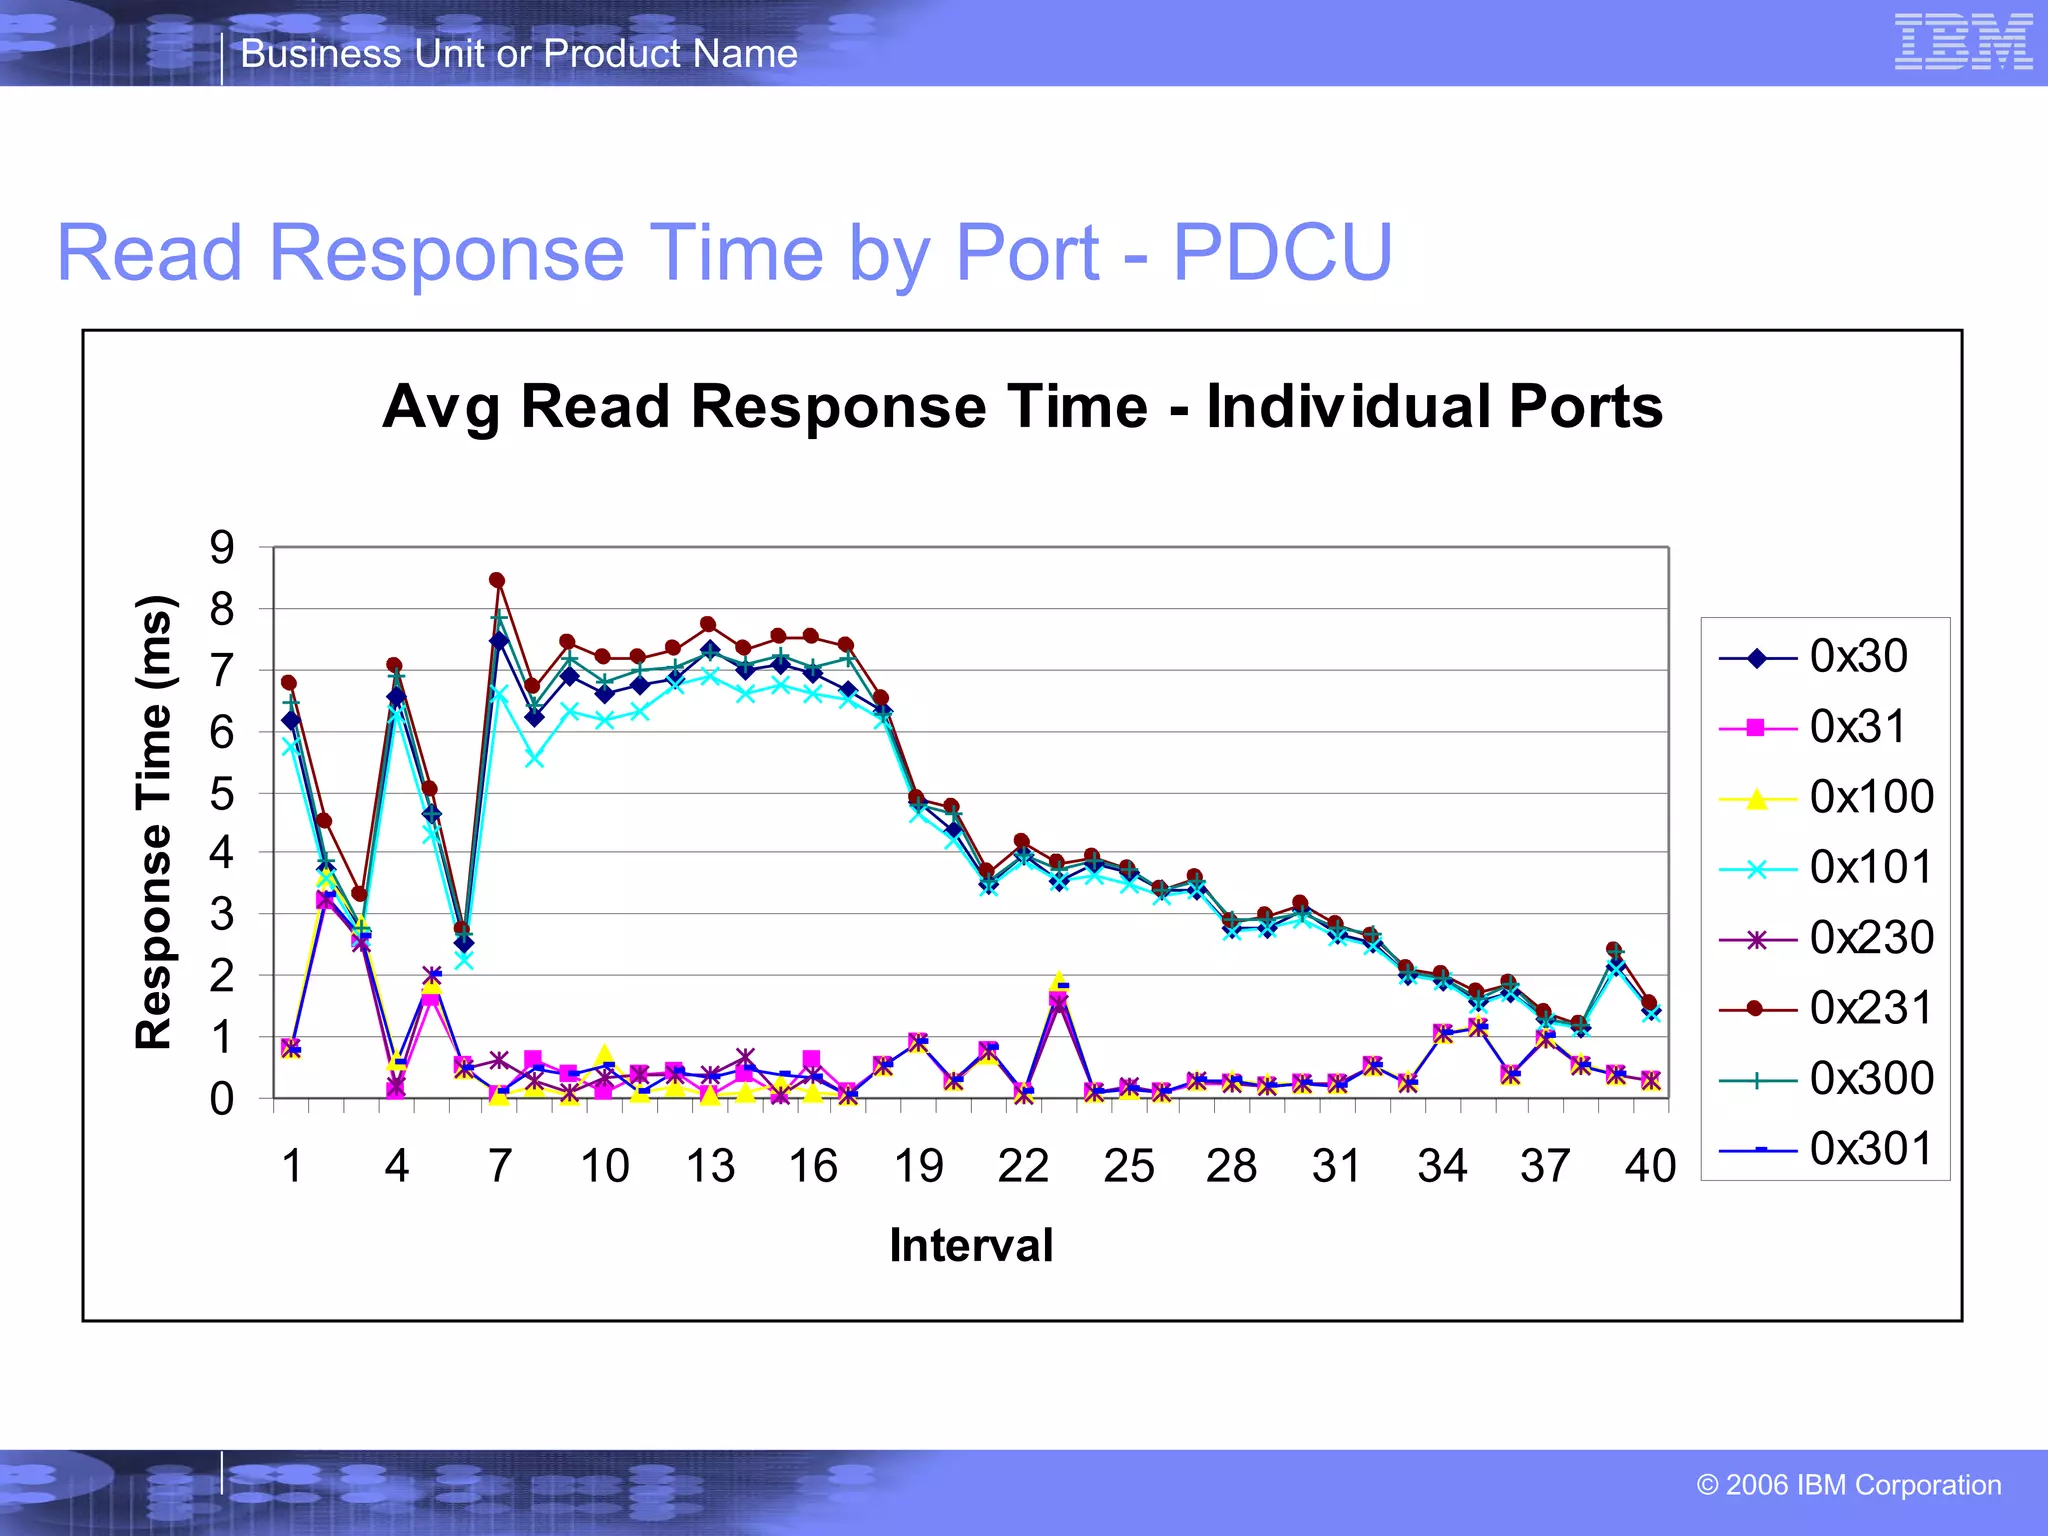
Read Response Time by Port - PDCU
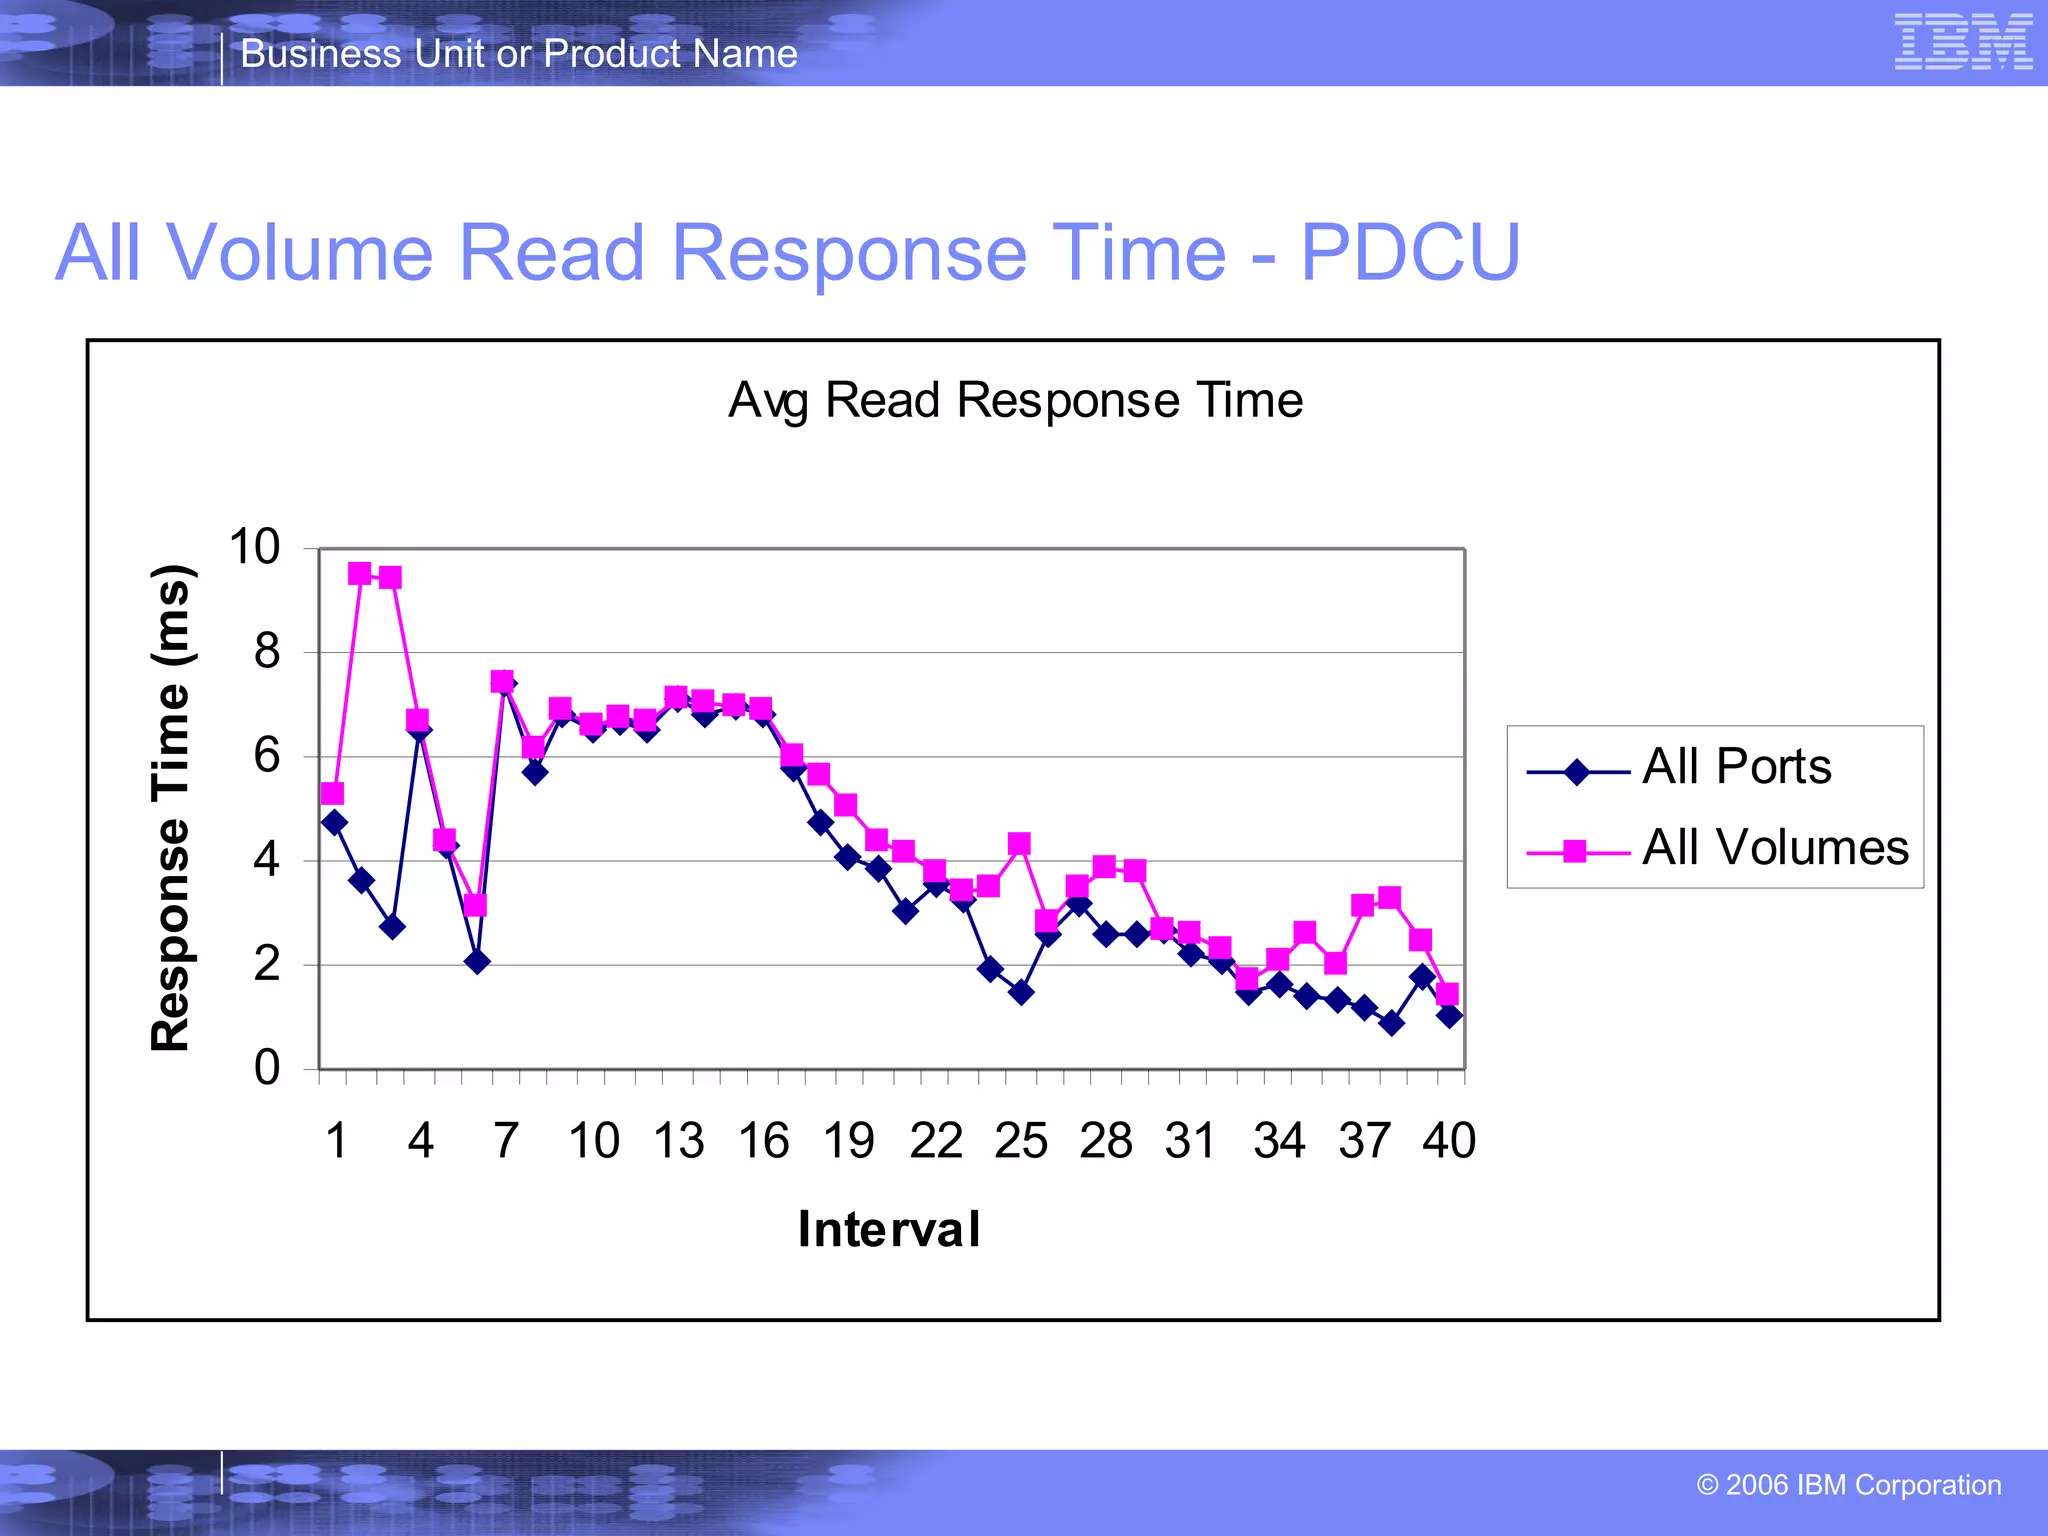
All Volume Read Response Time - PDCU
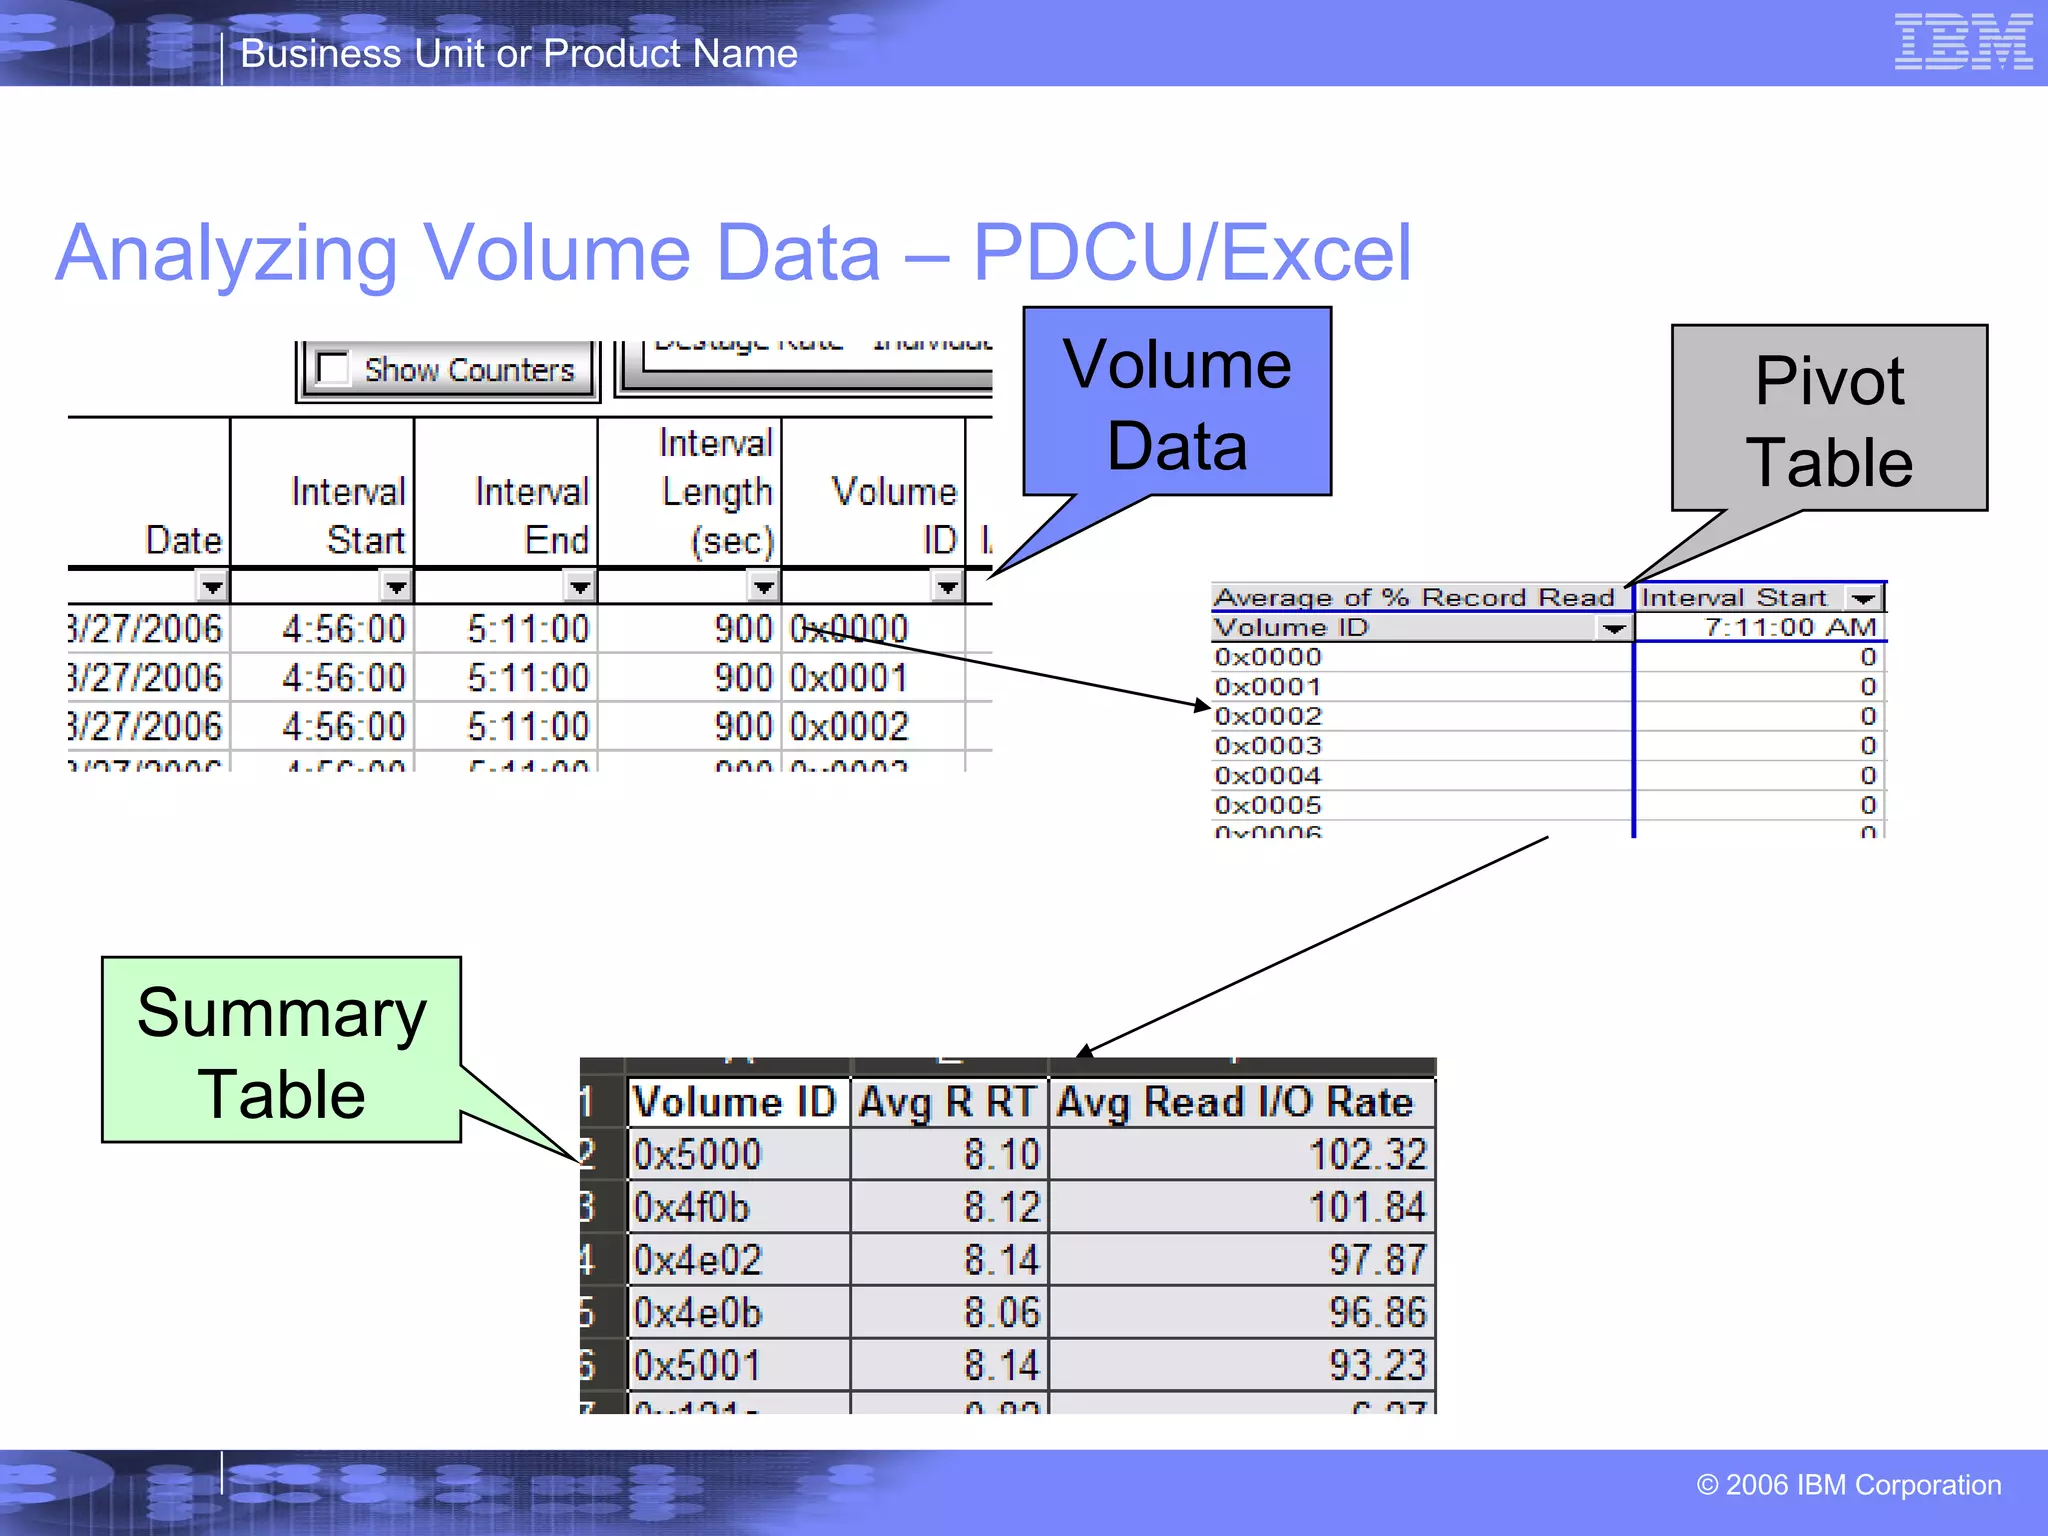
Analyzing Volume Data – PDCU/Excel Pivot Table Volume Data Summary Table
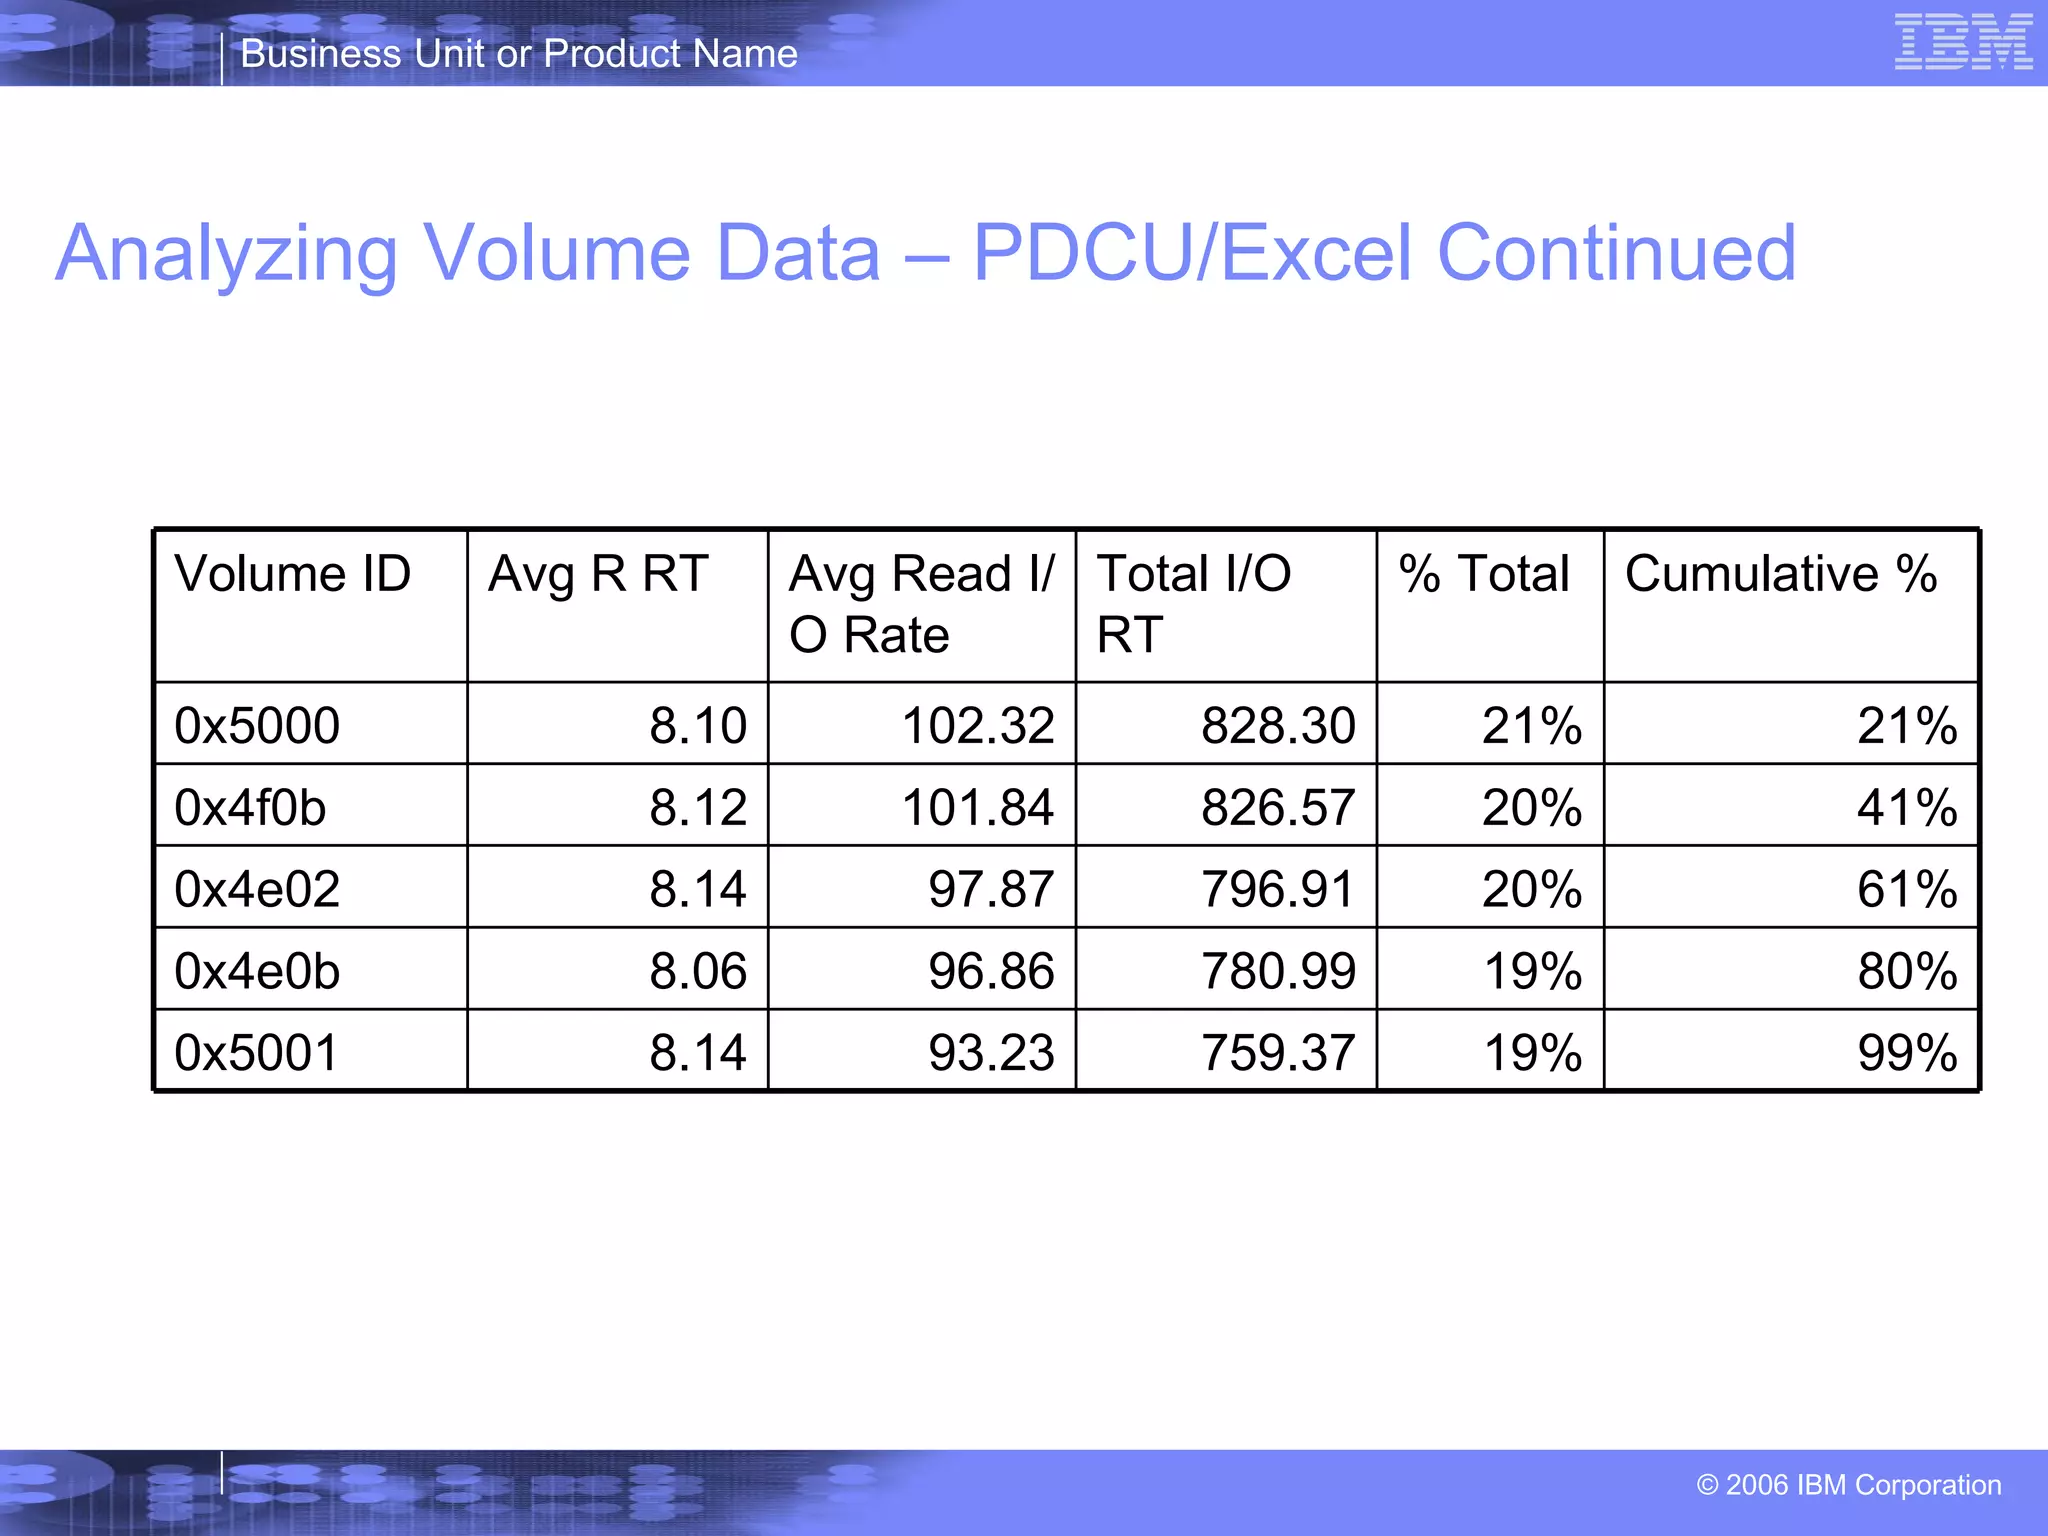
Analyzing Volume Data – PDCU/Excel Continued 99% 19% 759.37 93.23 8.14 0x5001 80% 19% 780.99 96.86 8.06 0x4e0b 61% 20% 796.91 97.87 8.14 0x4e02 41% 20% 826.57 101.84 8.12 0x4f0b 21% 21% 828.30 102.32 8.10 0x5000 Cumulative % % Total Total I/O RT Avg Read I/O Rate Avg R RT Volume ID
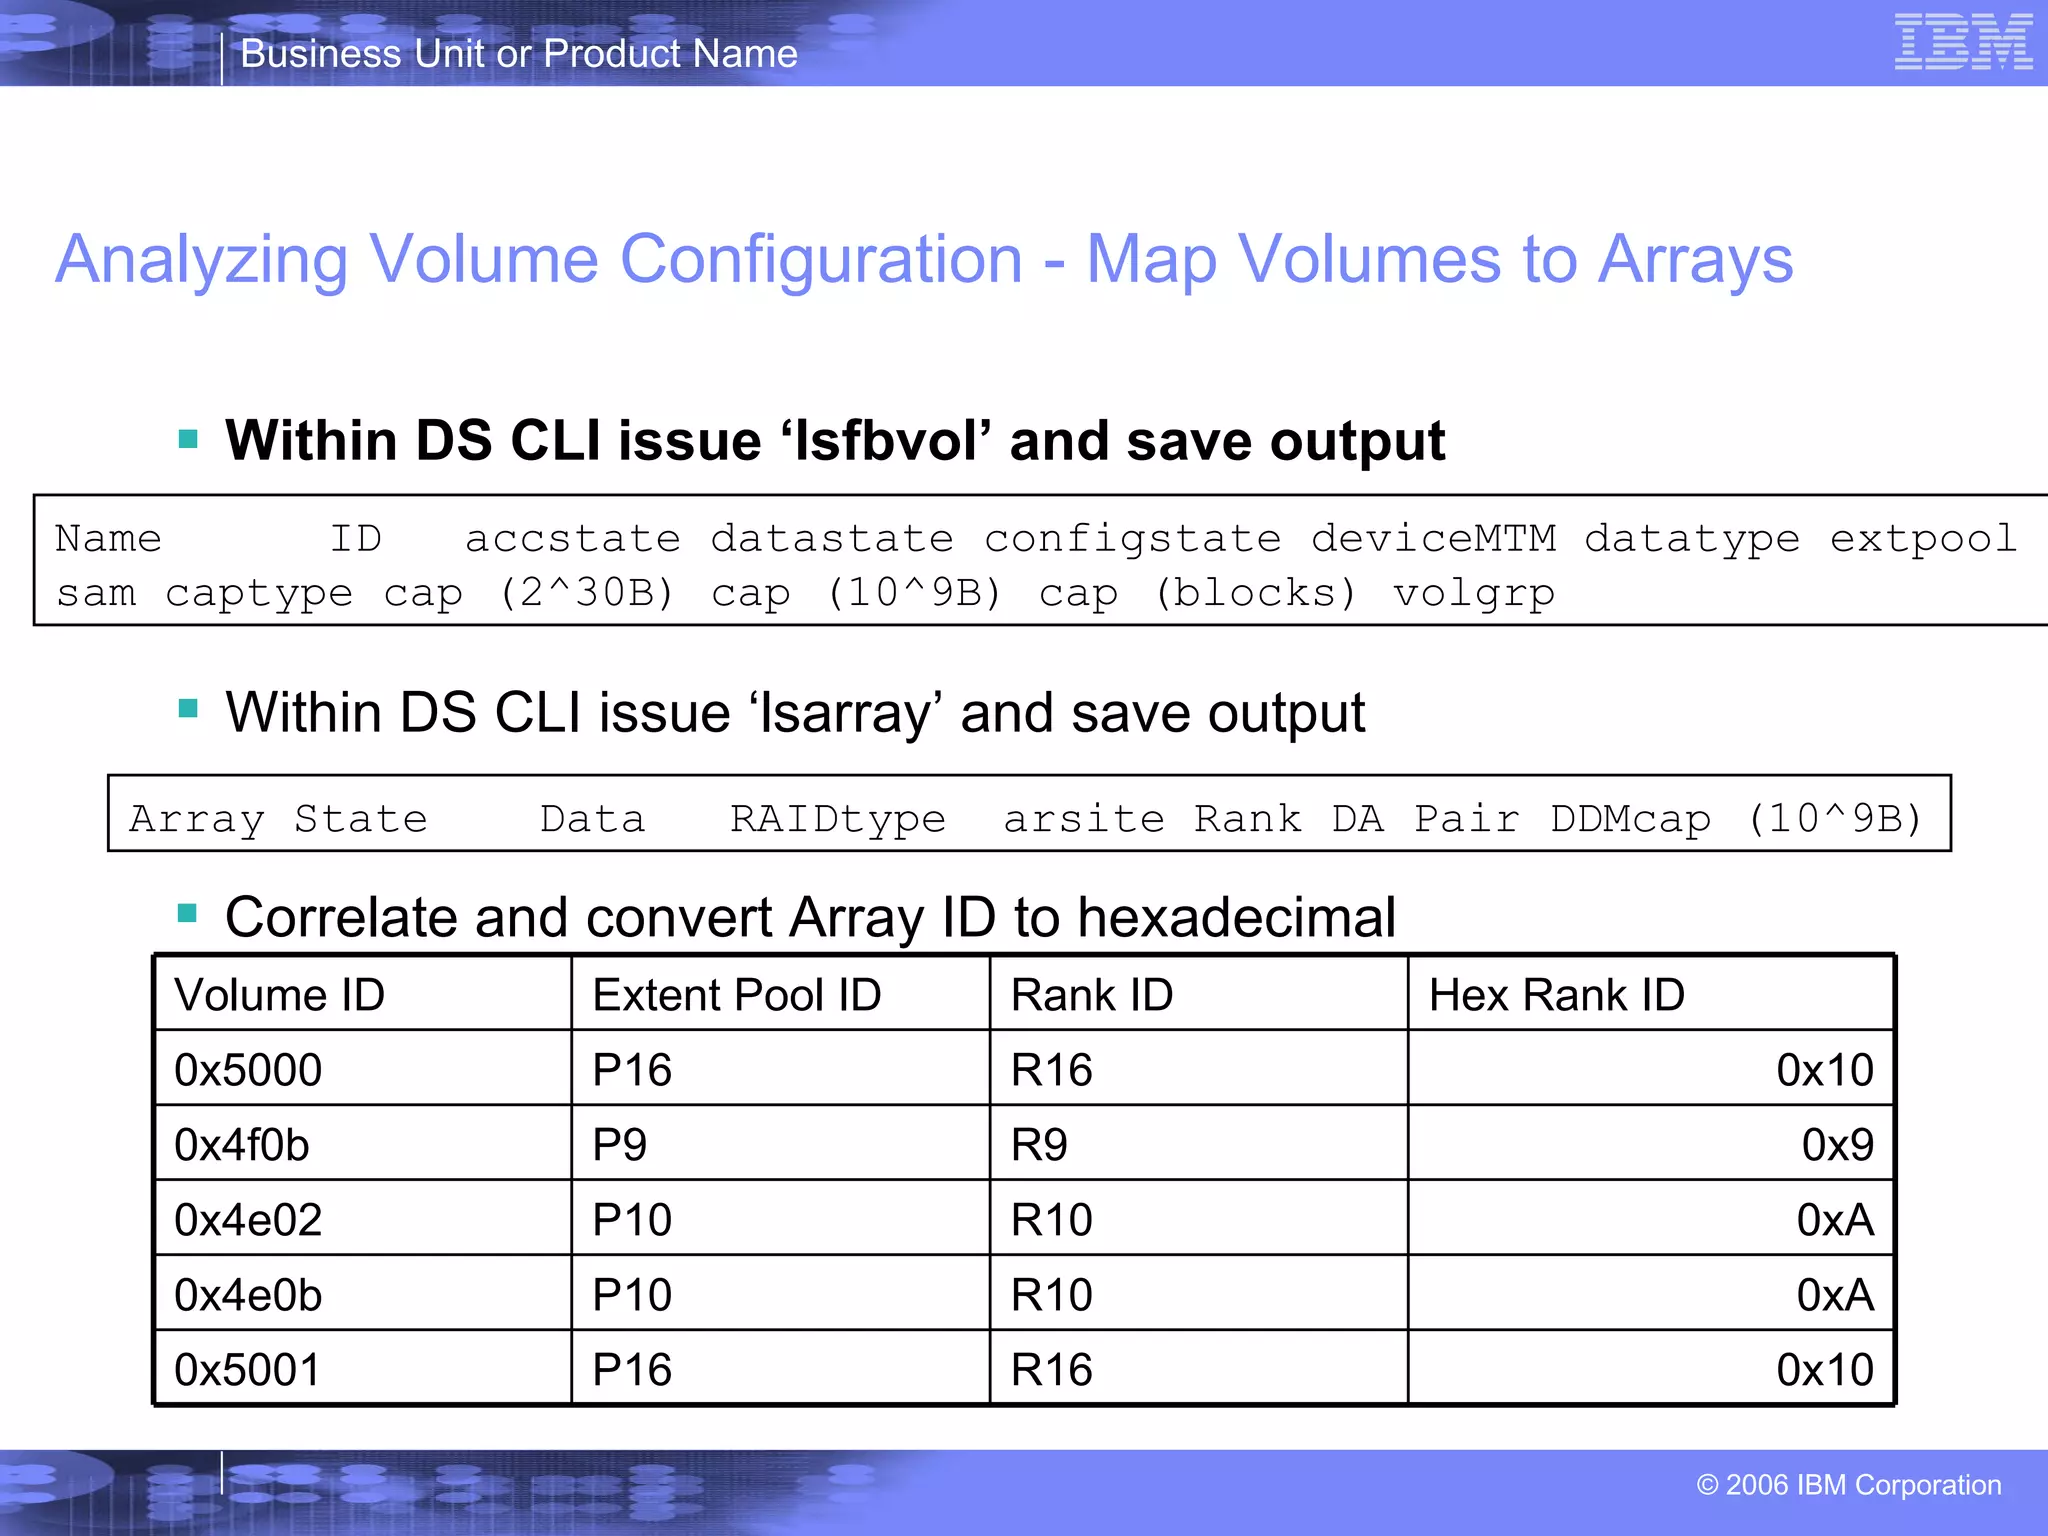
Analyzing Volume Configuration - Map Volumes to Arrays ,[object Object],Name  ID  accstate datastate configstate deviceMTM datatype extpool sam captype cap (2^30B) cap (10^9B) cap (blocks) volgrp ,[object Object],Array State  Data  RAIDtype  arsite Rank DA Pair DDMcap (10^9B) ,[object Object],0x10 R16 P16 0x5001 0xA R10 P10 0x4e0b 0xA R10 P10 0x4e02 0x9 R9 P9 0x4f0b 0x10 R16 P16 0x5000 Hex Rank ID Rank ID Extent Pool ID Volume ID
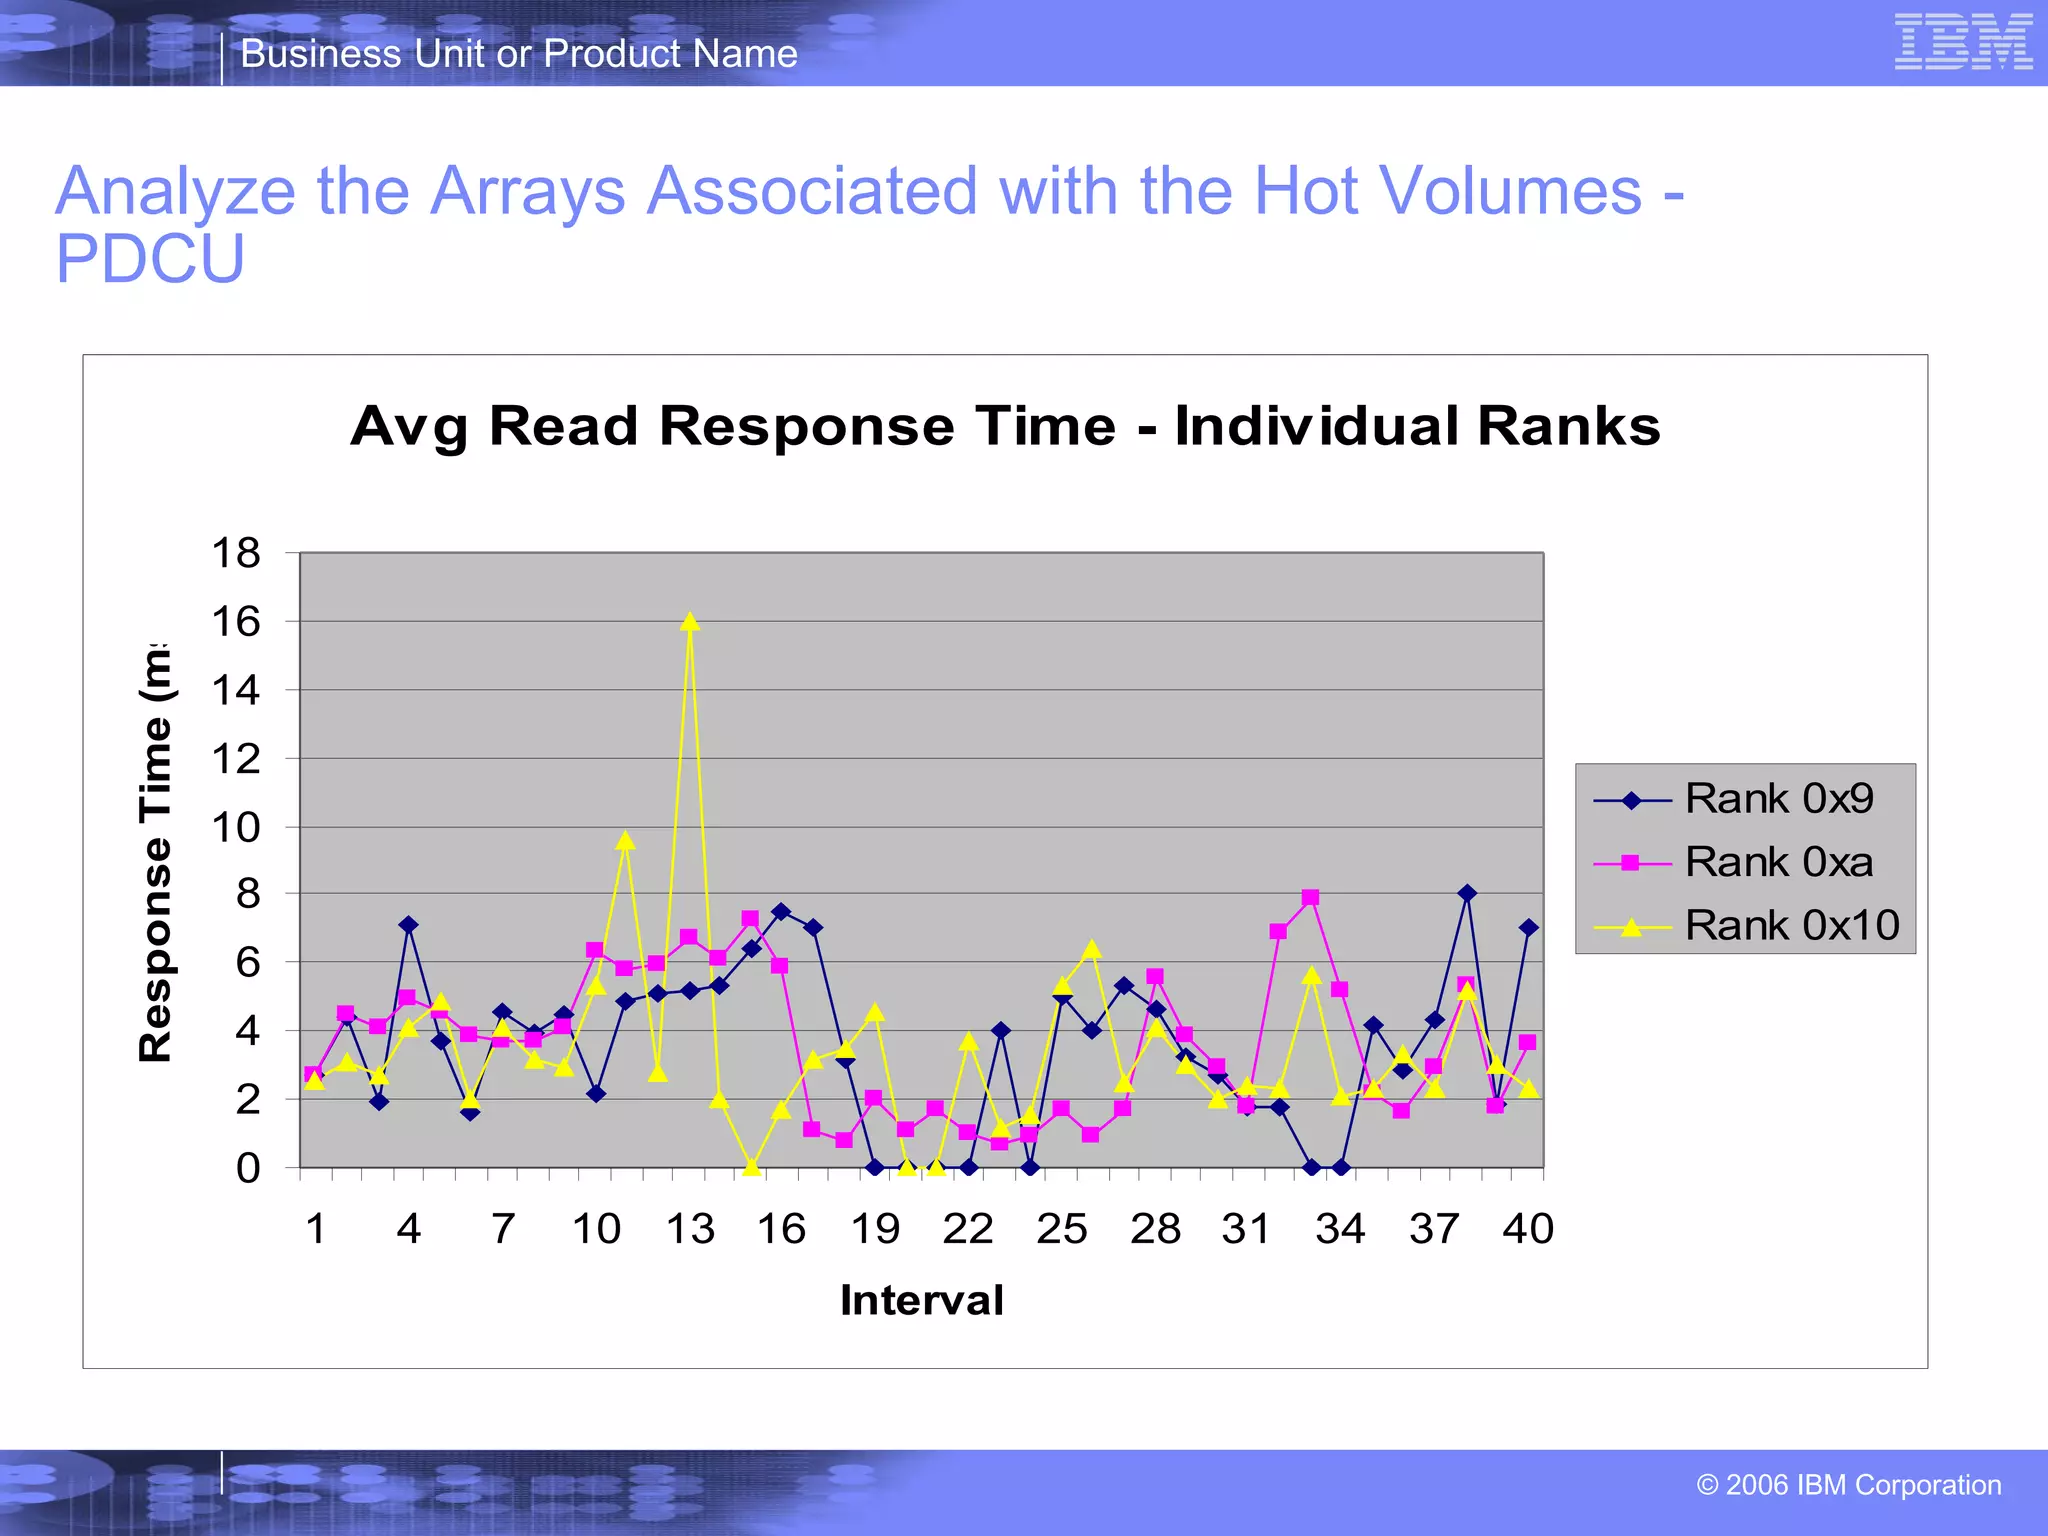
Analyze the Arrays Associated with the Hot Volumes - PDCU
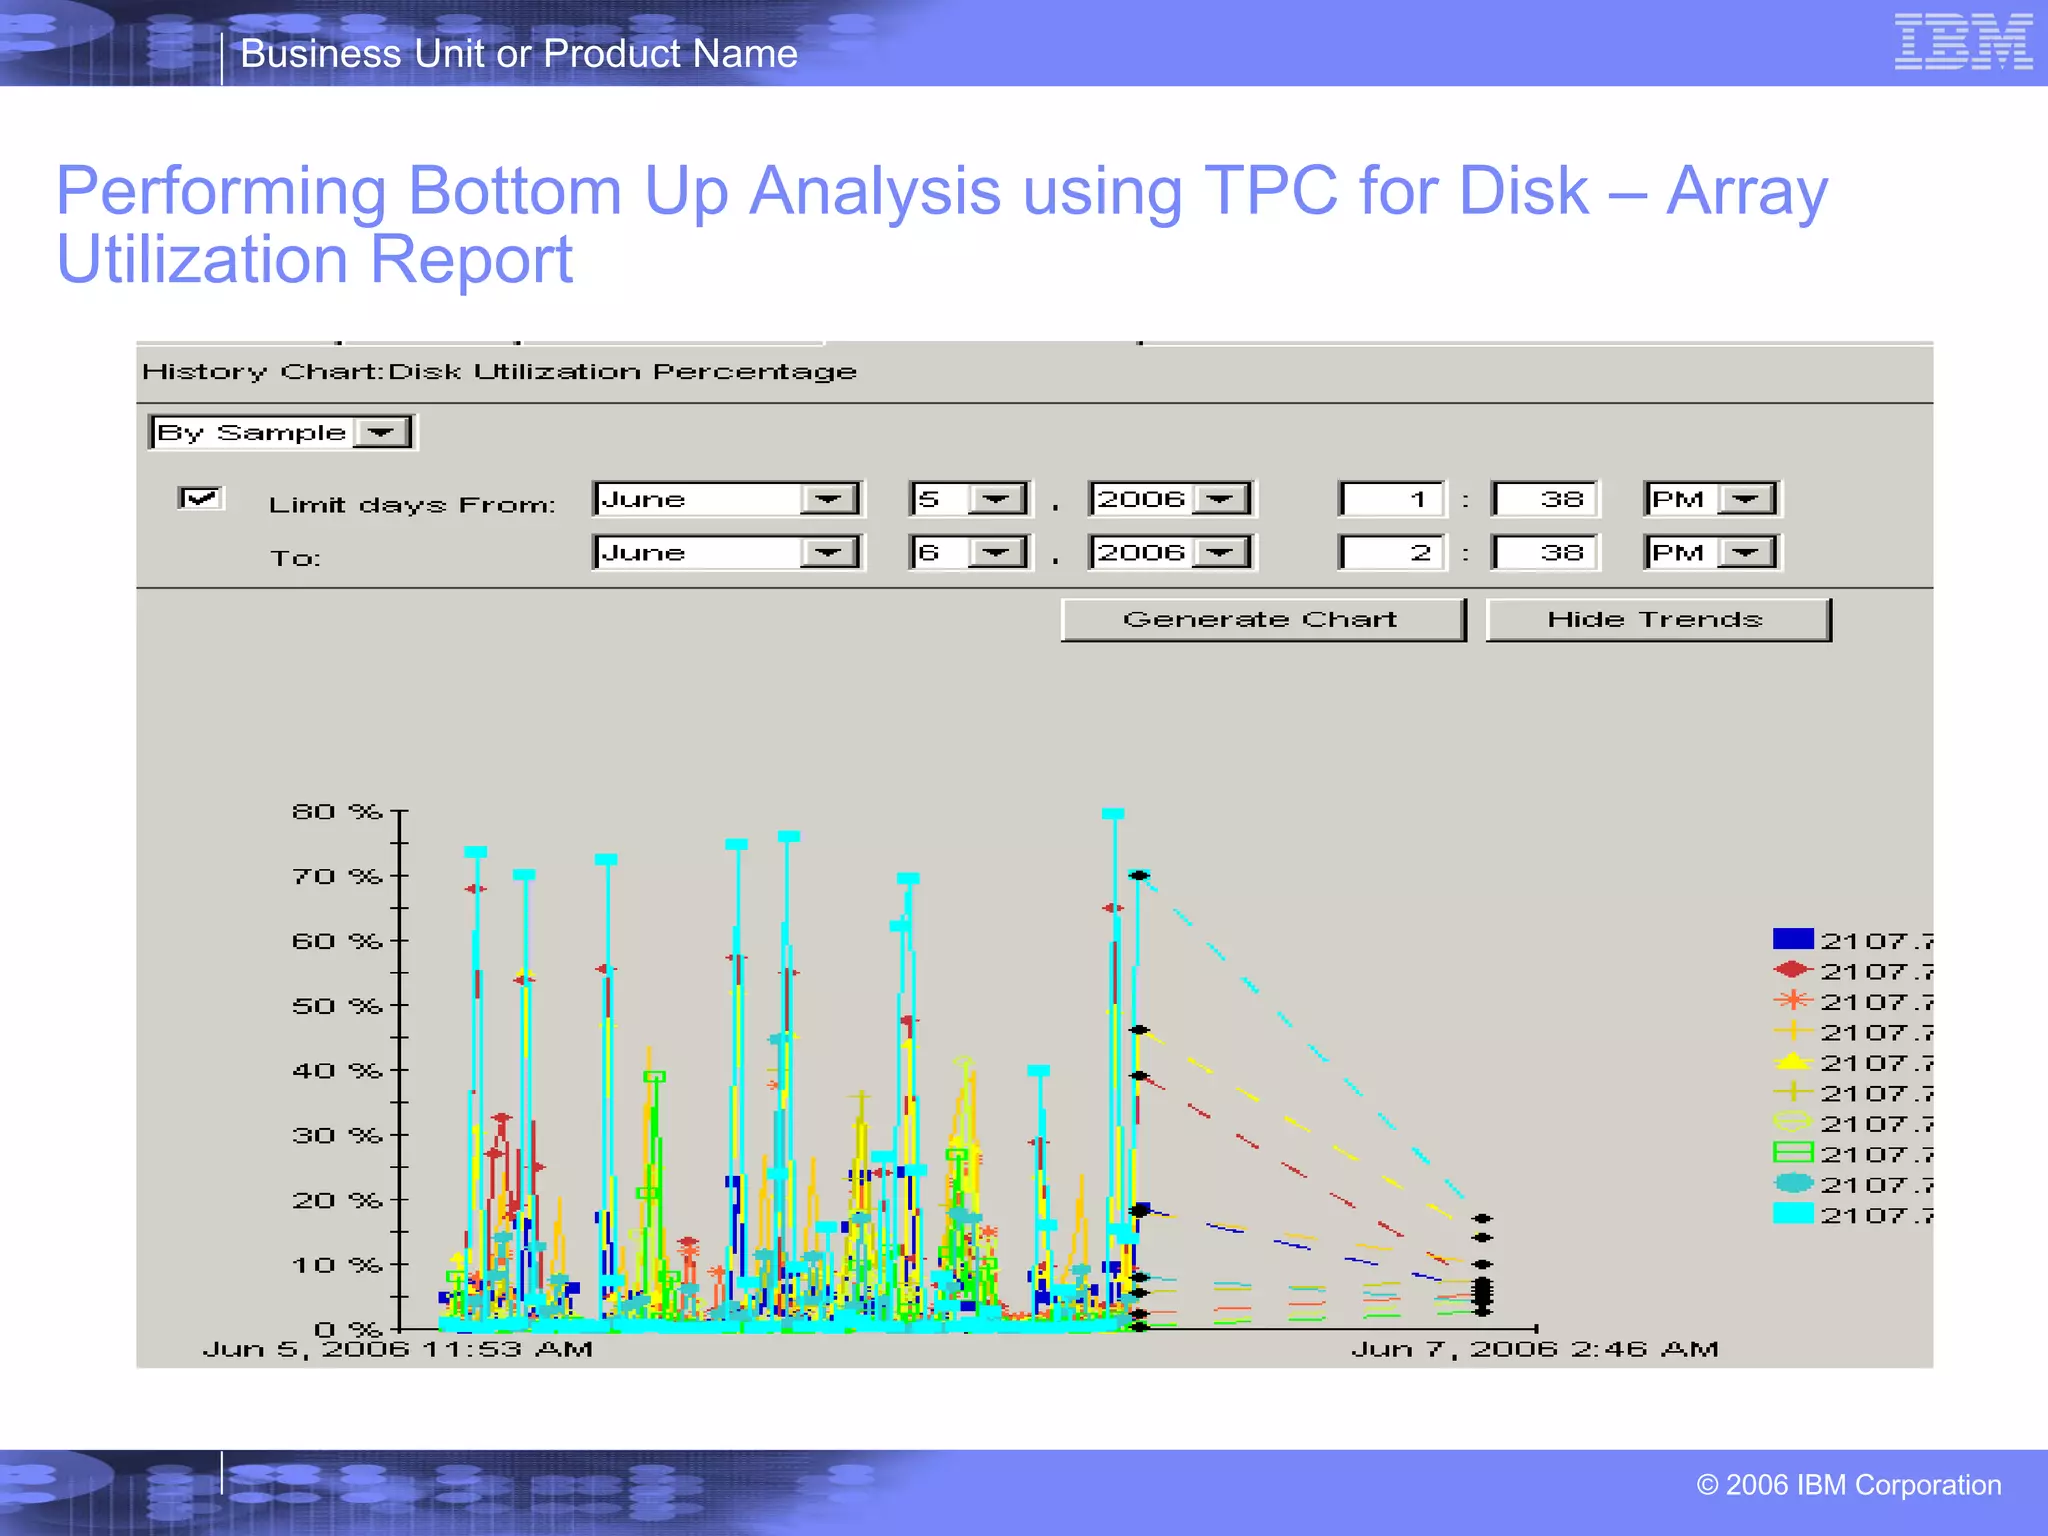
Performing Bottom Up Analysis using TPC for Disk – Array Utilization Report
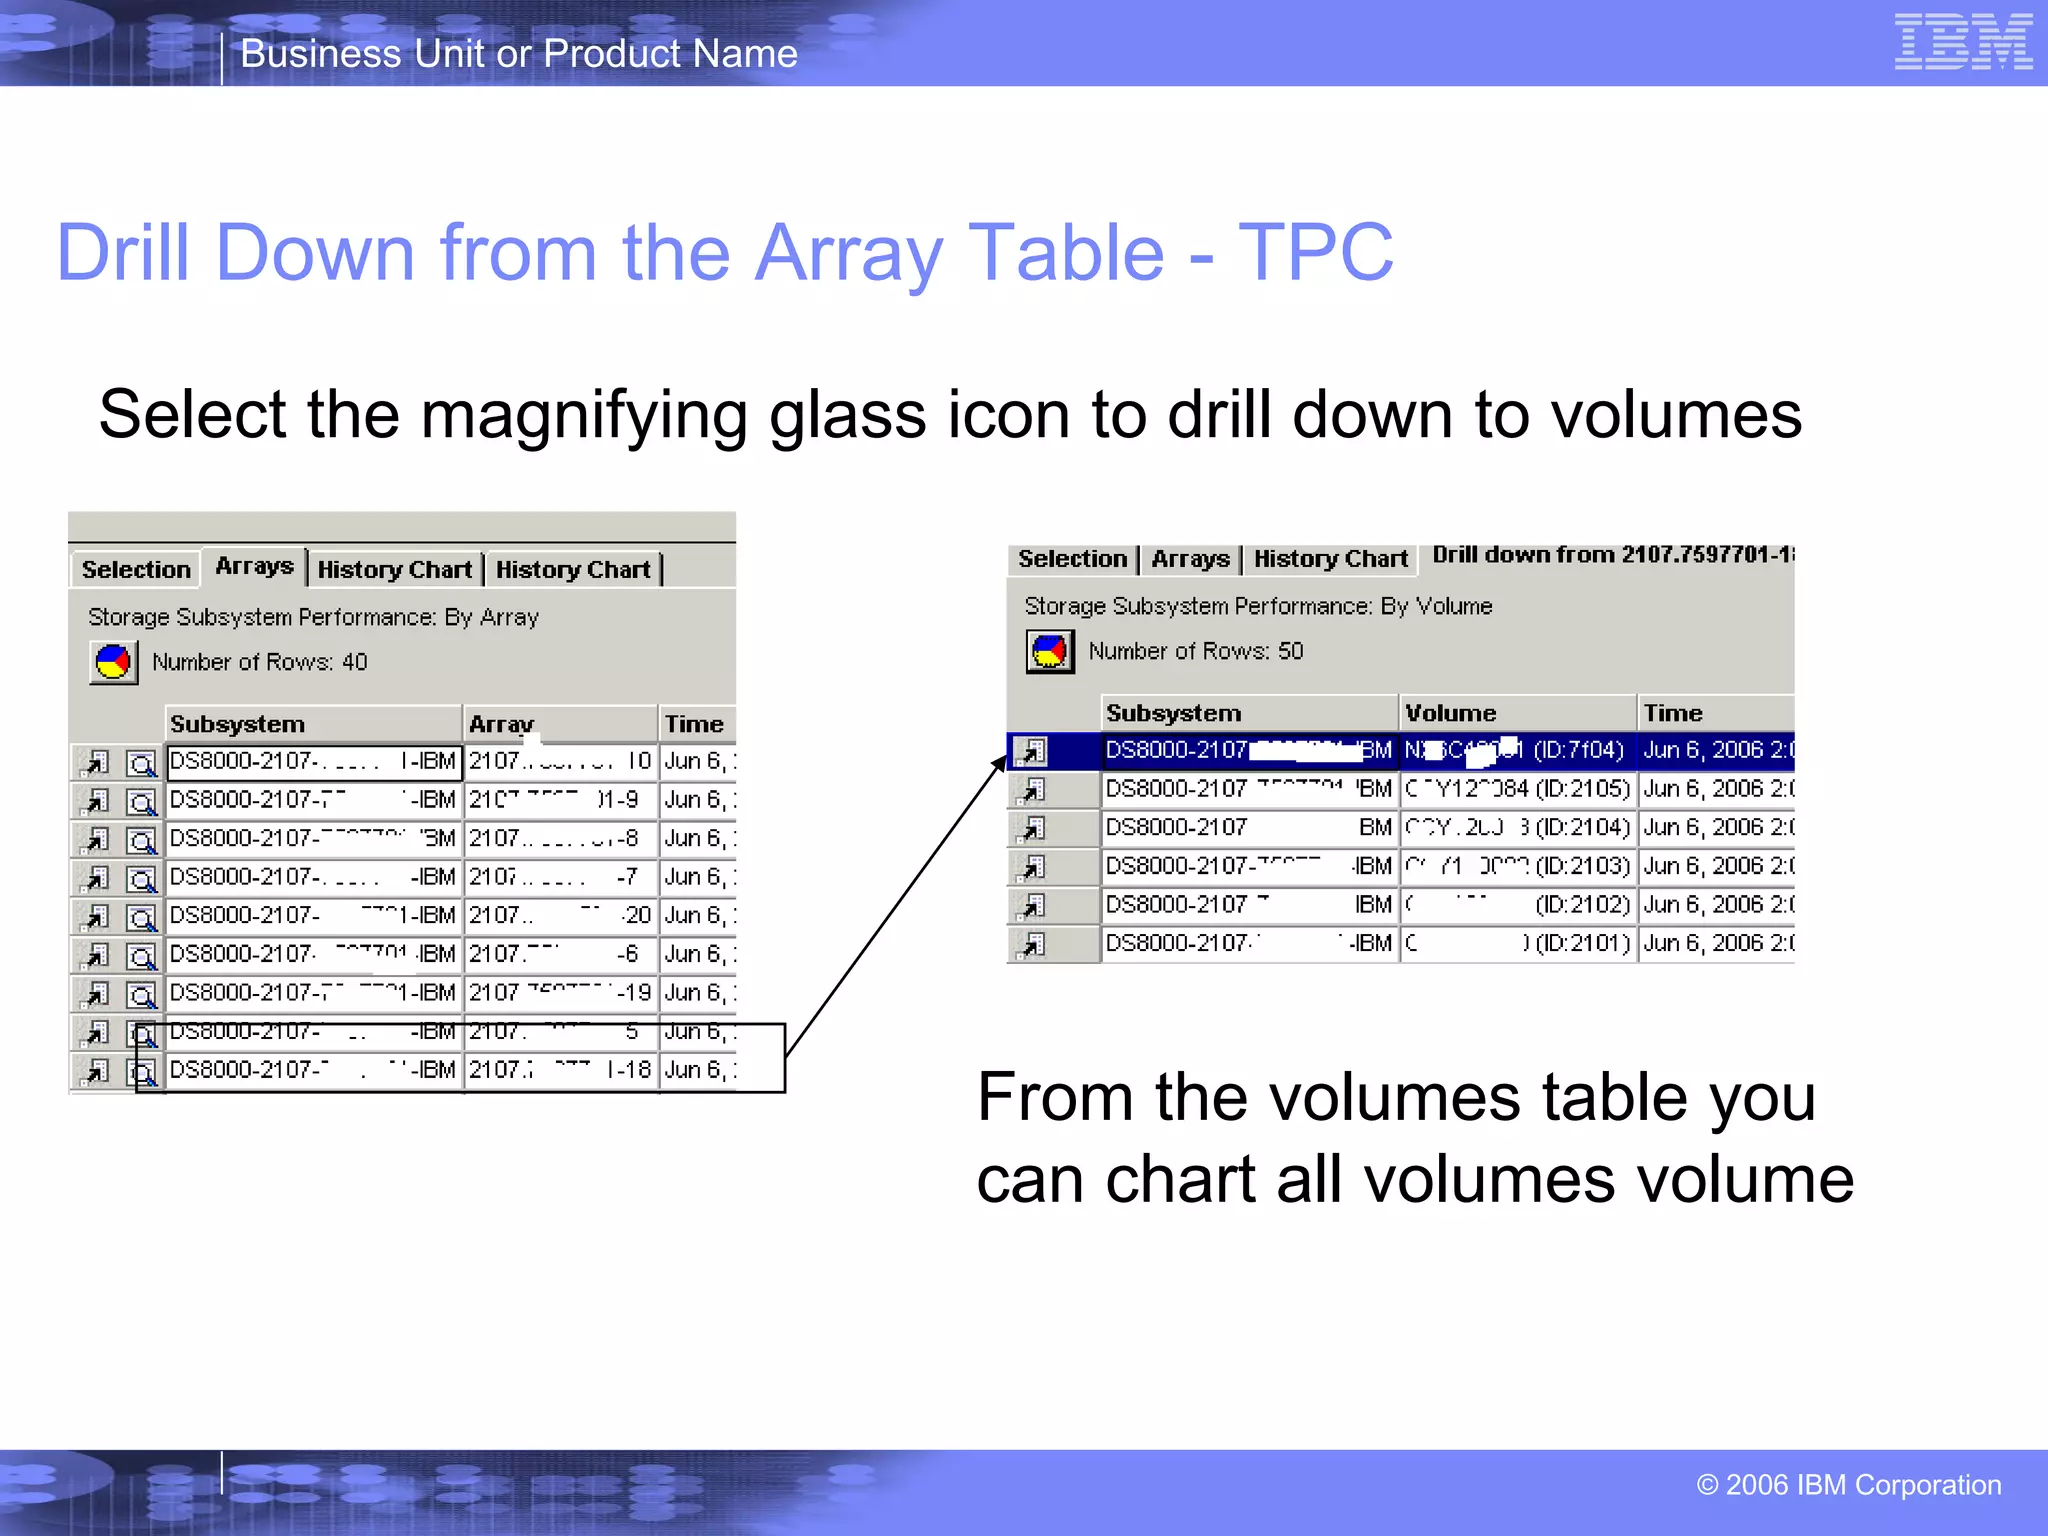
Drill Down from the Array Table - TPC Select the magnifying glass icon to drill down to volumes From the volumes table you can chart all volumes volume
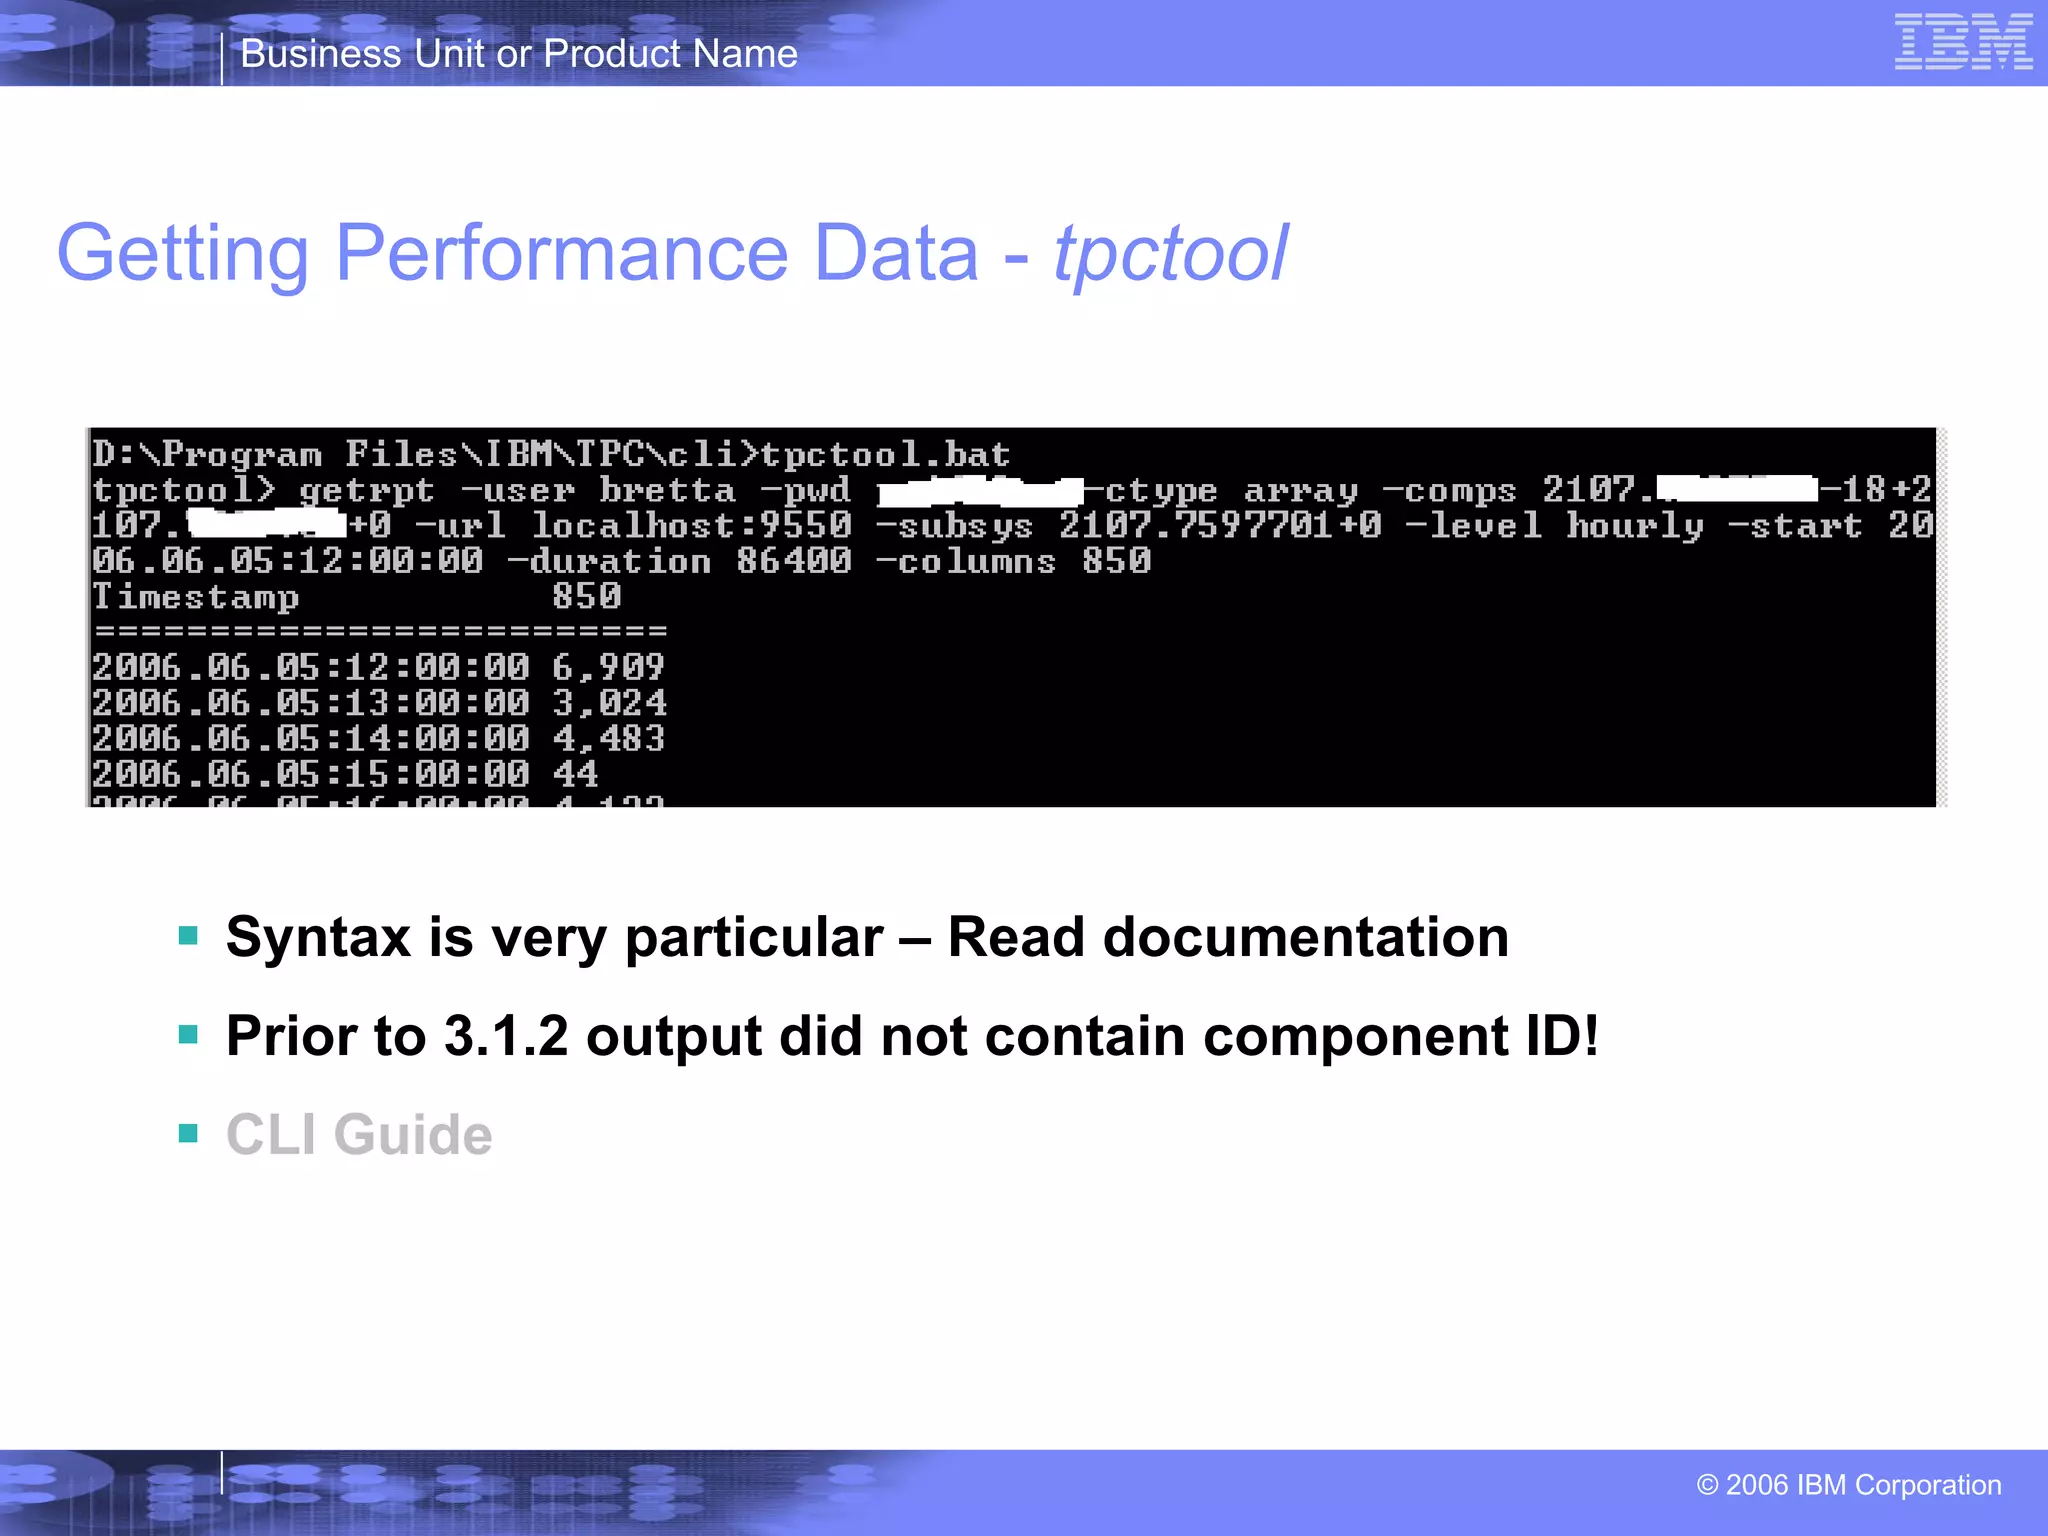
Getting Performance Data -  tpctool ,[object Object],[object Object],[object Object]
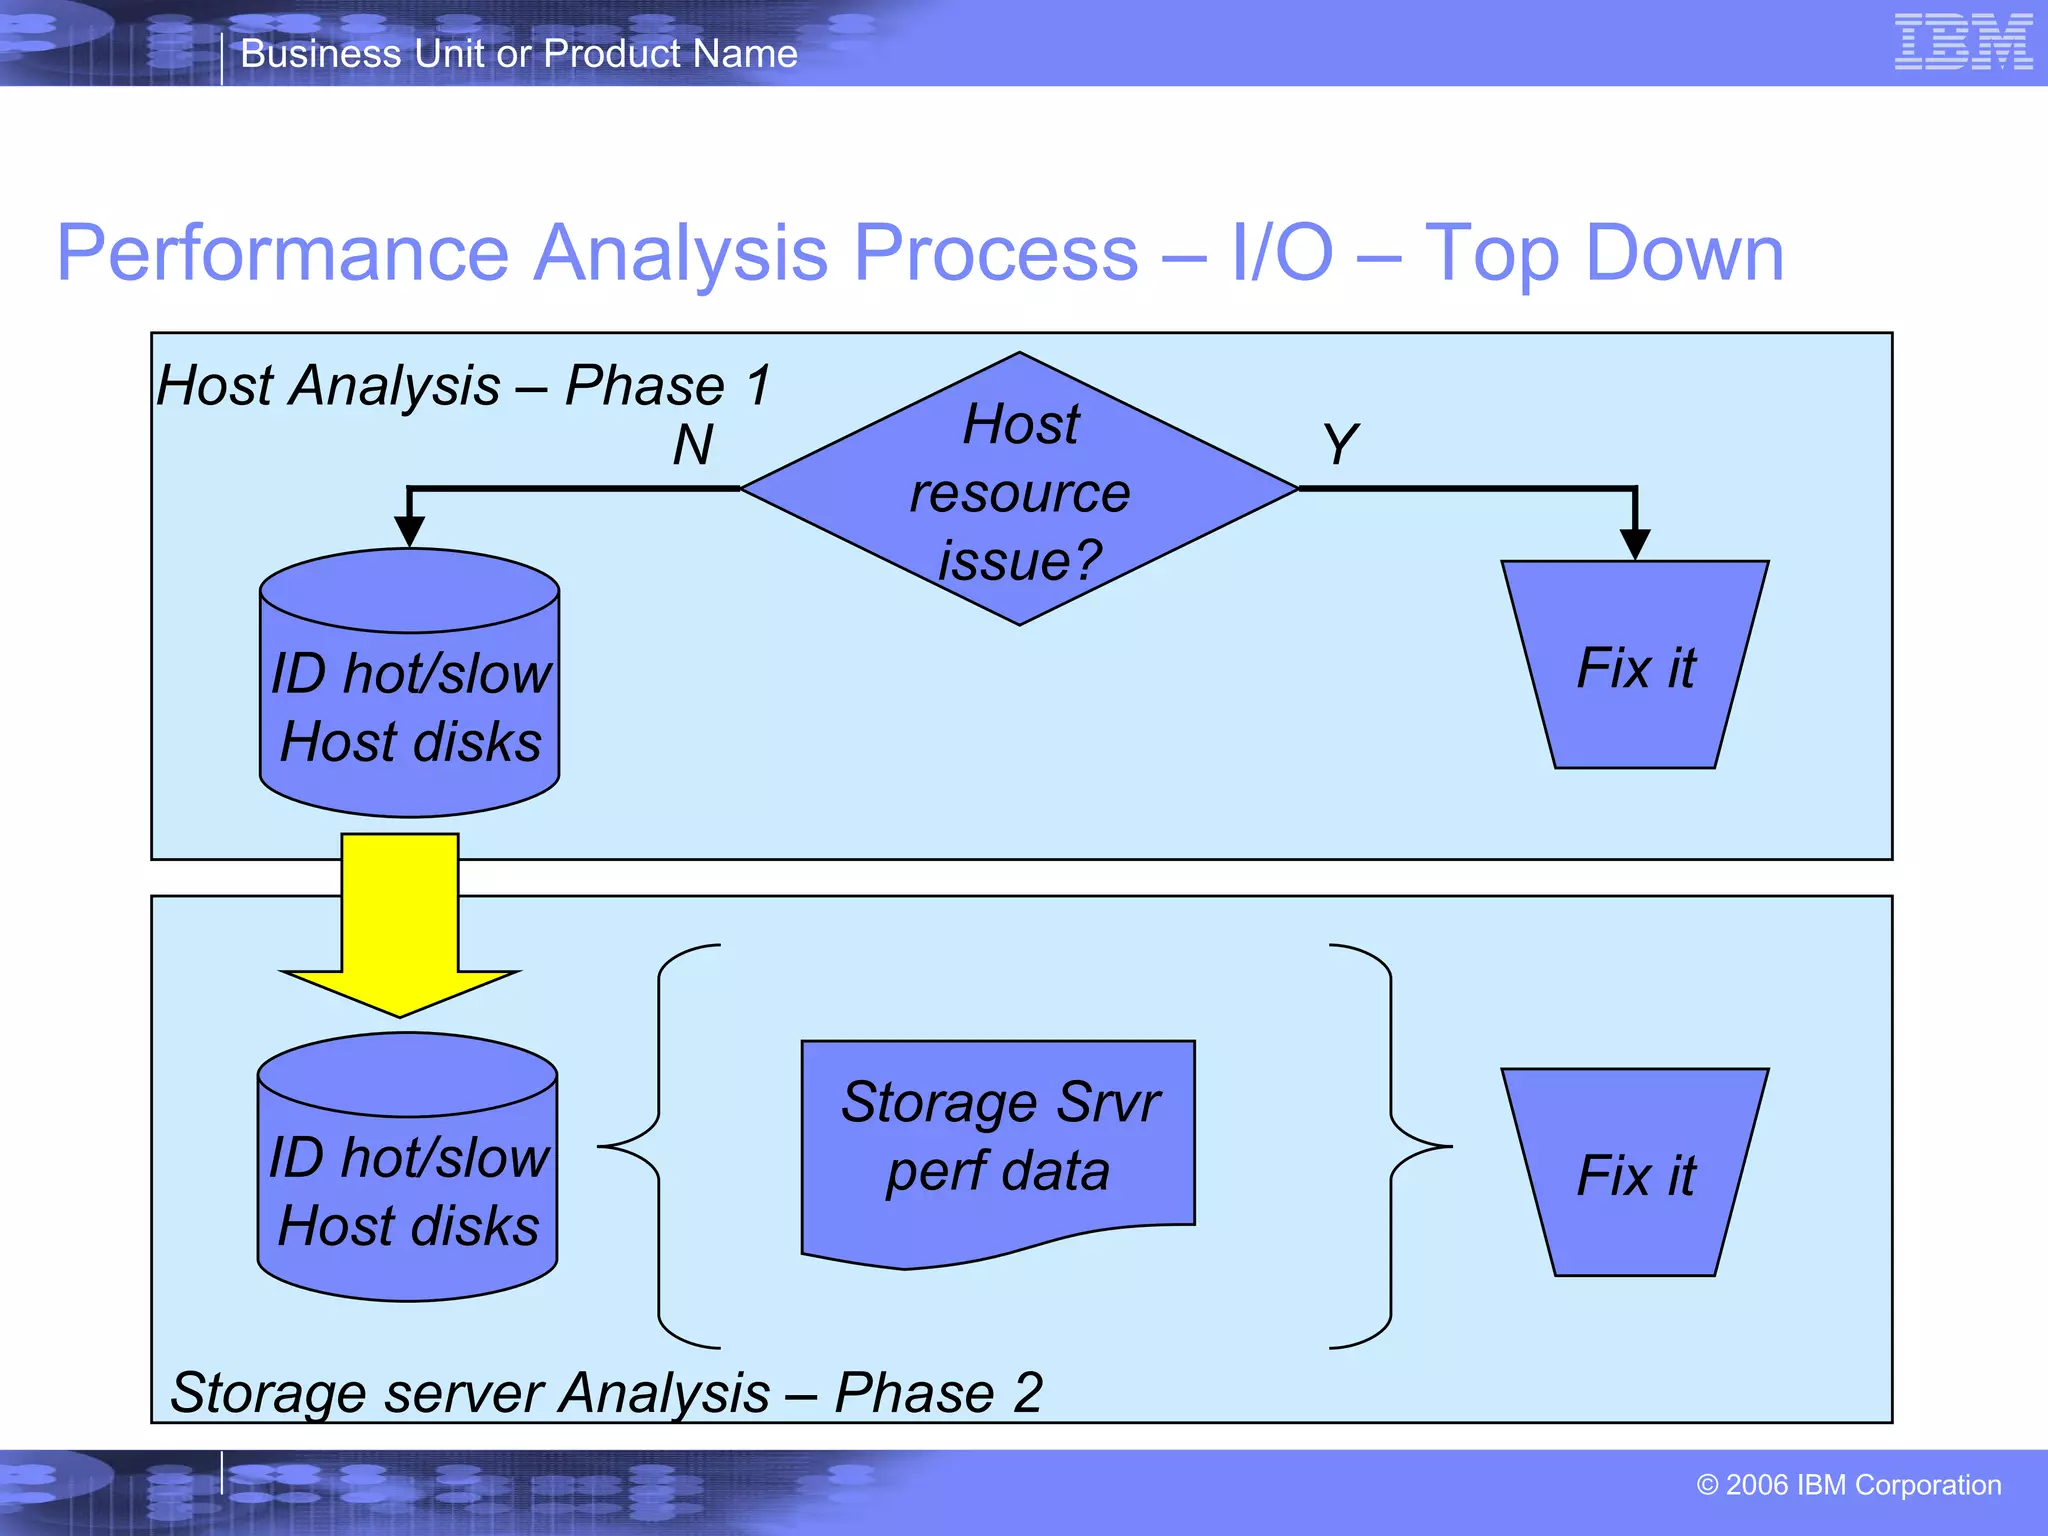
Performance Analysis Process – I/O – Top Down Host resource issue? Fix it ID hot/slow Host disks ID hot/slow Host disks Host Analysis – Phase 1 Storage server Analysis – Phase 2 Storage Srvr perf data Fix it N Y
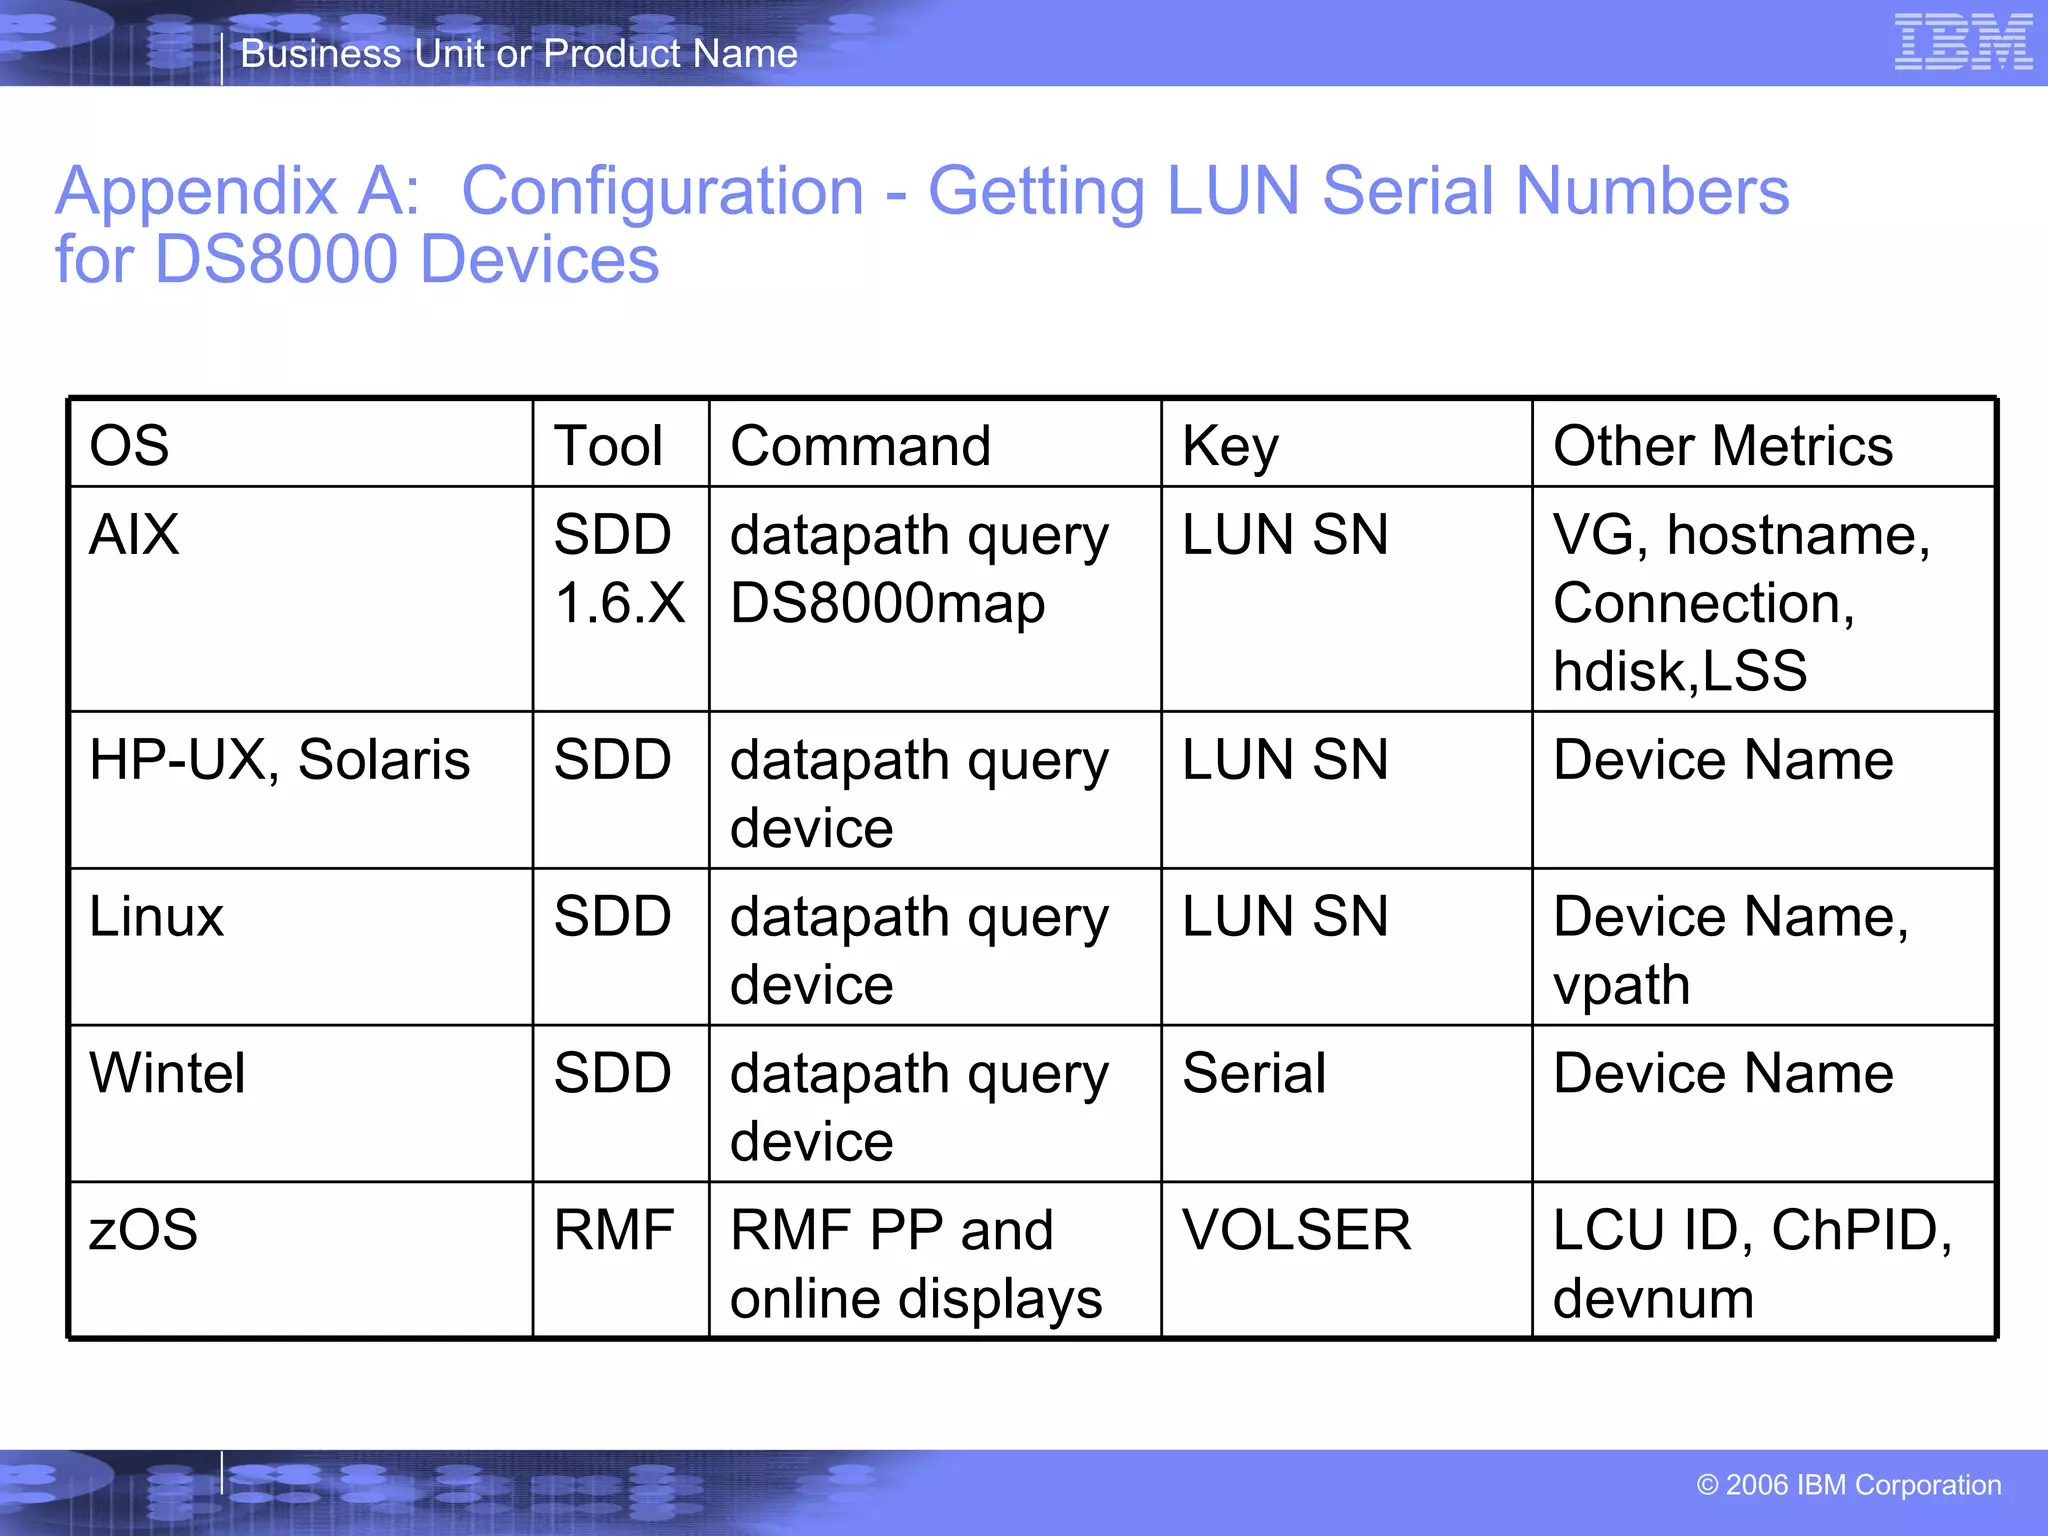
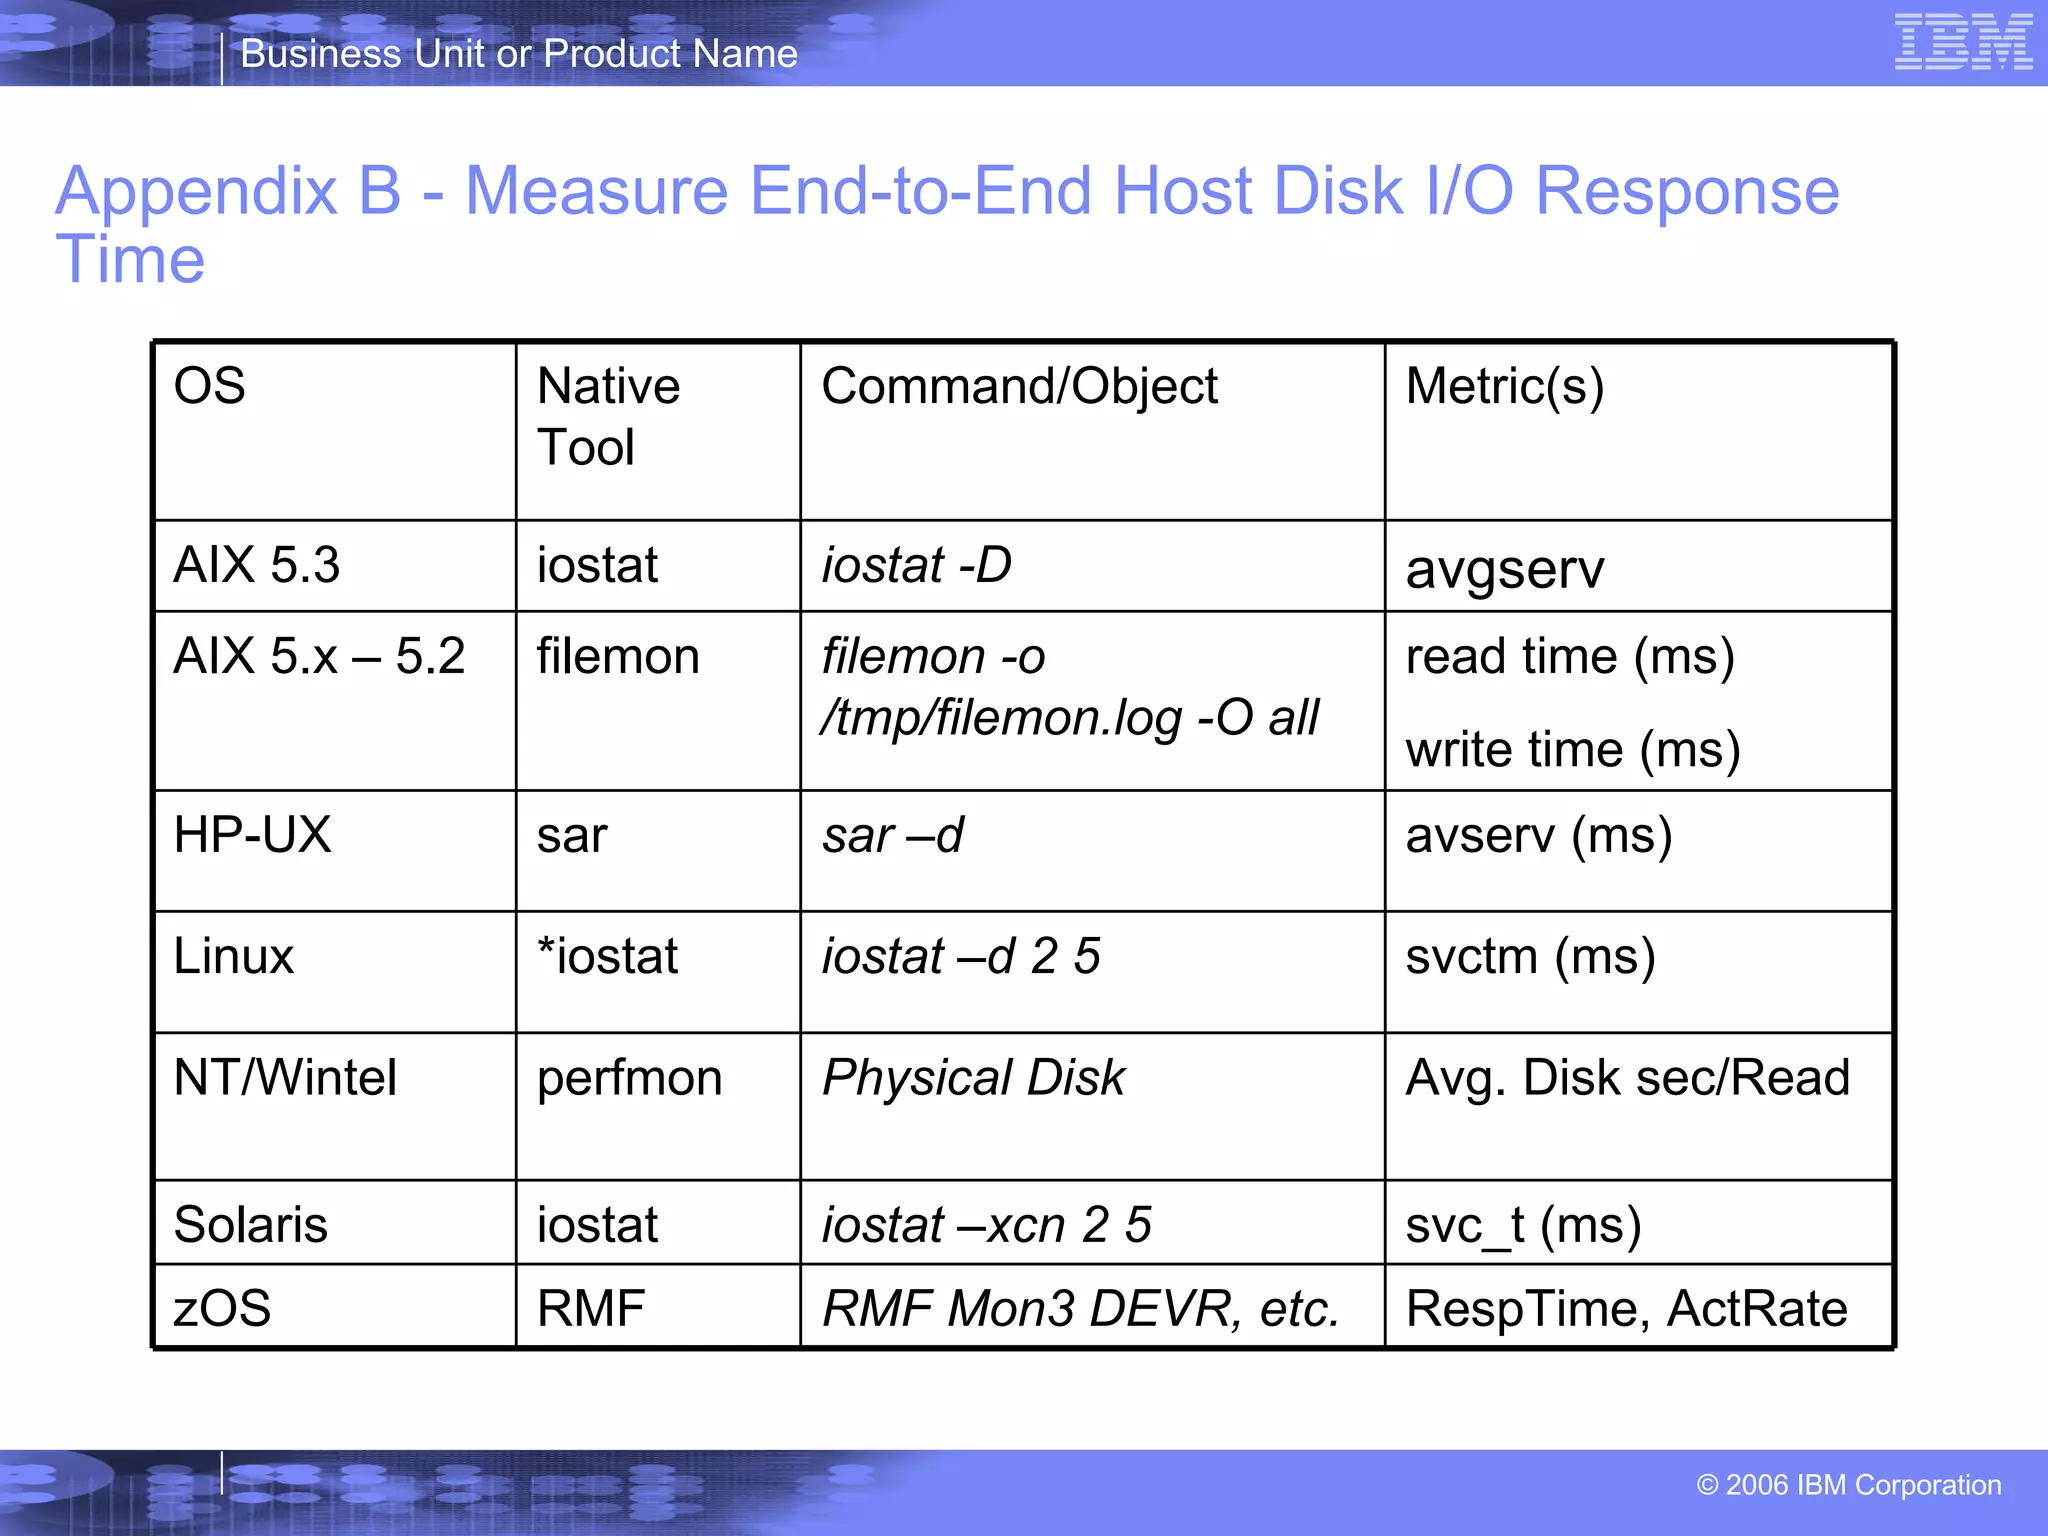
Host I/O Analysis - Example of AIX Server Gather LUN ->hdisk information See Appendix A) Disk  Path  P  Location  adapter  LUN SN  Type  vpath197 hdisk42  09-08-01[FC] fscsi0  75977014E01   IBM 2107-900 Format the data (email me for the filemon-DS8000map.pl script) Note:  The formatted data can be used in Excel pivot tables to perform top-down examination of I/O subsystem performance ------------------------------------------------------------------------ Detailed Physical Volume Stats  (512 byte blocks) ------------------------------------------------------------------------ VOLUME: /dev/hdisk42  description: IBM FC 2107 reads: 1723 (0 errs) read sizes (blks):  avg  180.9 min  8 max  512 sdev  151.0 read times (msec): avg  4.058 min  0.163 max  39.335 sdev  4.284 Gather Response Time Data ‘filemon’ (See Appendix B) 91.8 2.868 1978 hdisk1278 75977010604 7597701 test1 18:04:05 May/30/2006 93.3 3.832 1605 hdisk42 75977014E01 7597701 test1 18:04:05 May/30/2006 AVG_READ_KB READ_TIMES #READS HDISK LUN DS8000 SERVER TIME DATE
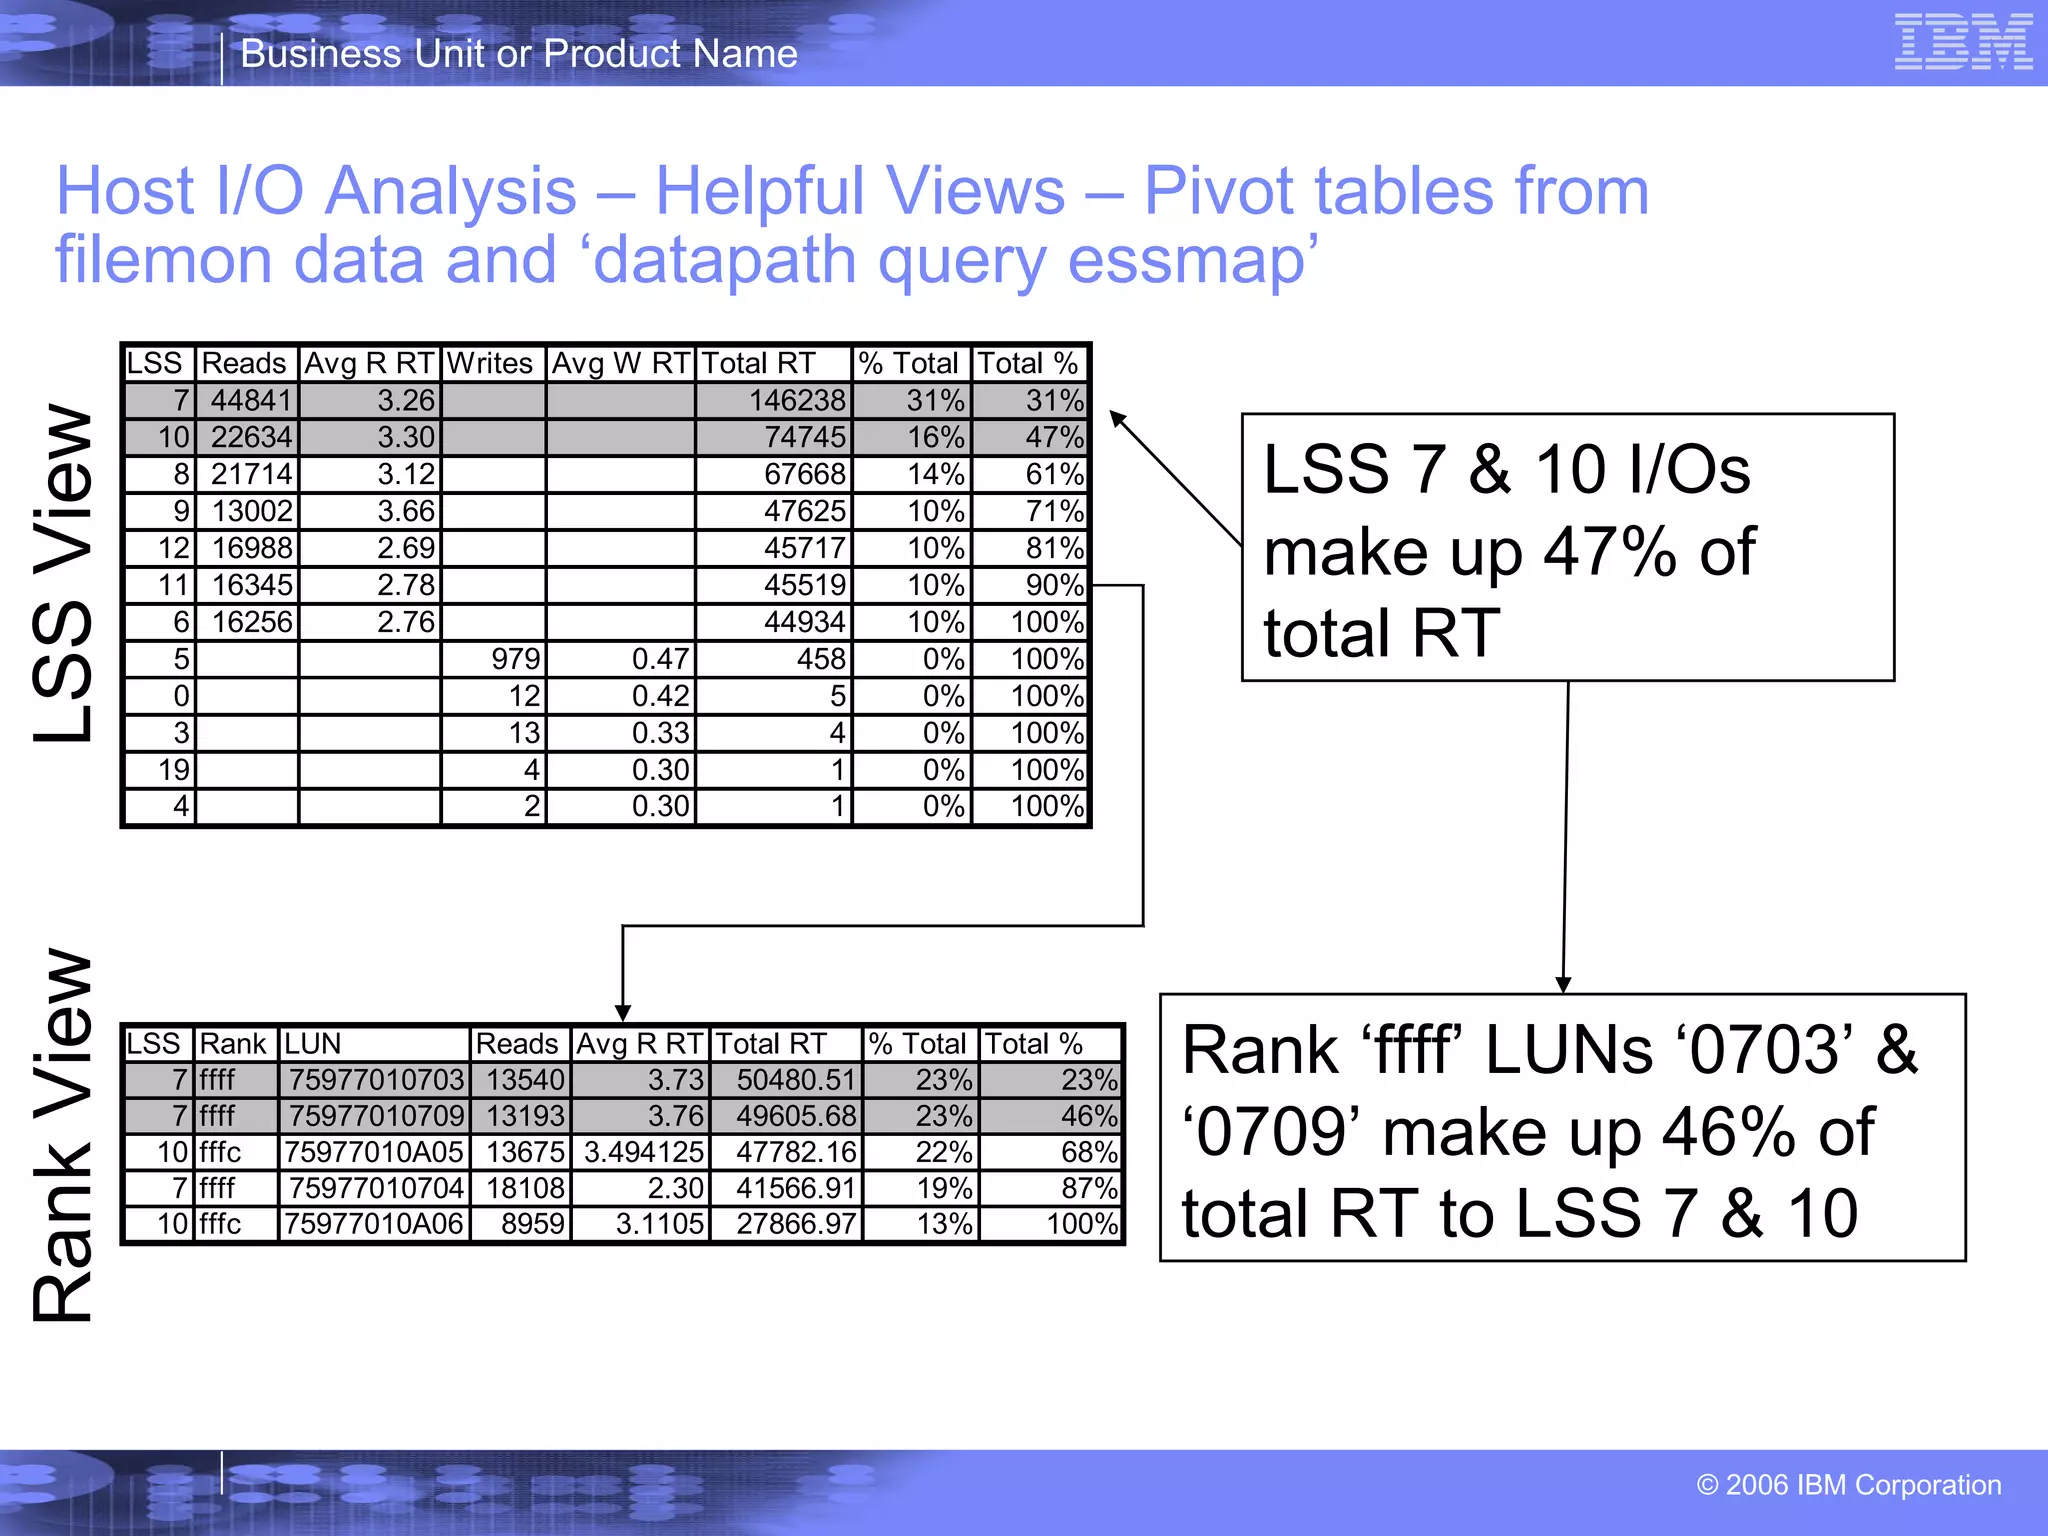
Host I/O Analysis – Helpful Views – Pivot tables from filemon data and ‘datapath query essmap’ LSS 7 & 10 I/Os make up 47% of total RT LSS View Rank View Rank ‘ffff’ LUNs ‘0703’ & ‘0709’ make up 46% of total RT to LSS 7 & 10
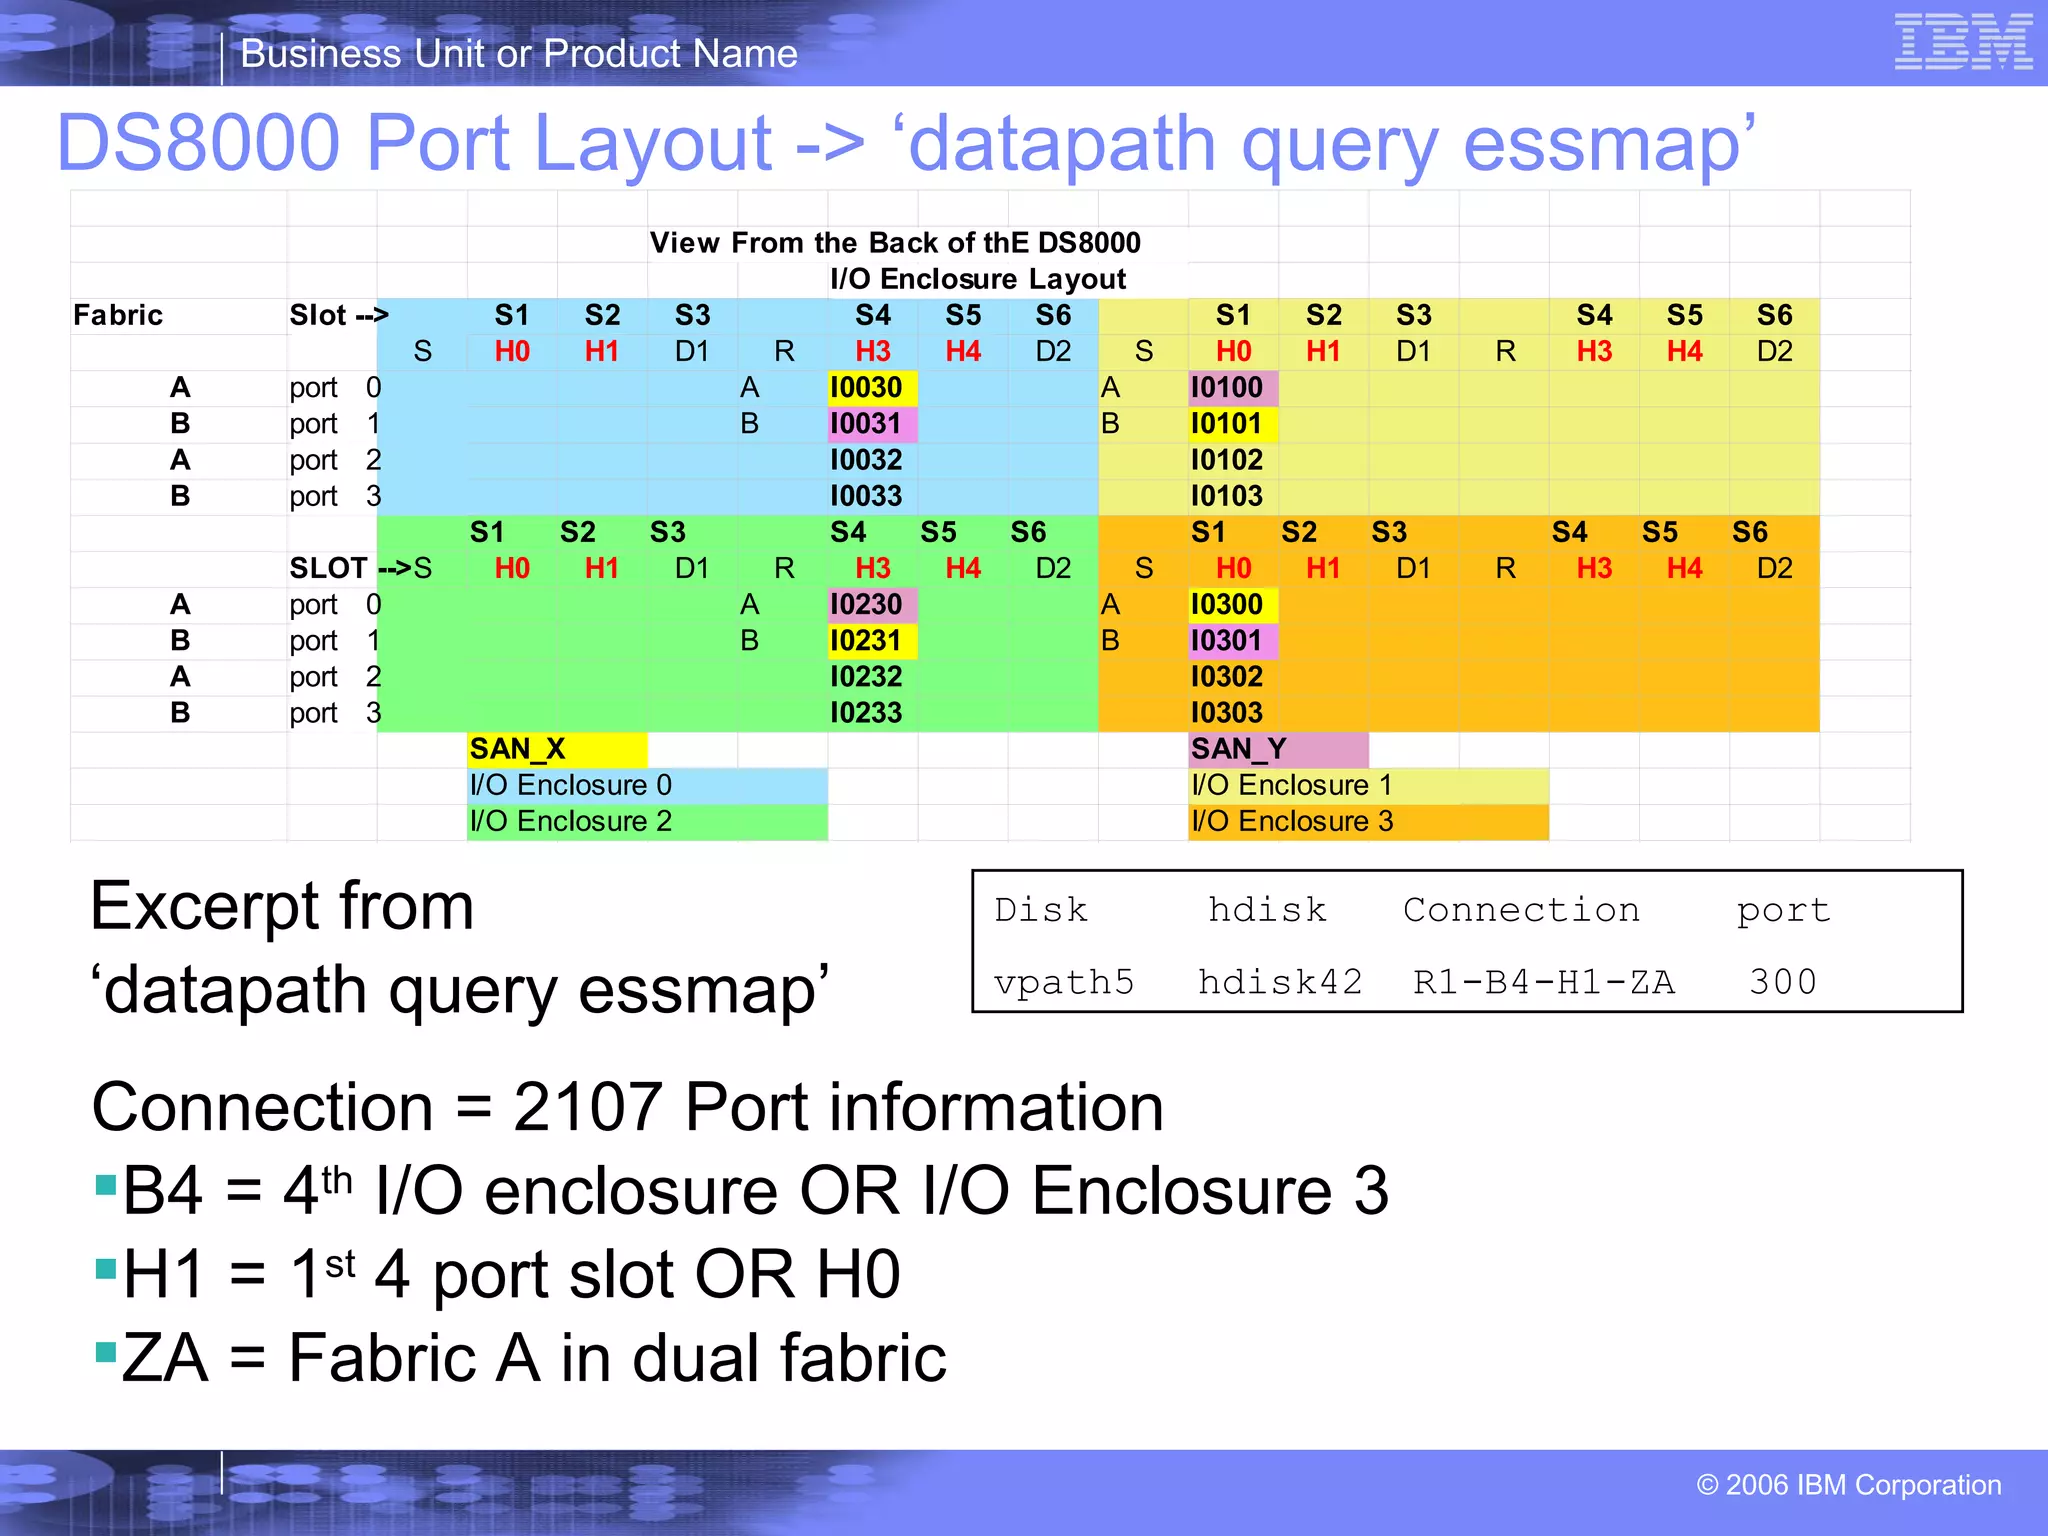
DS8000 Port Layout -> ‘datapath query essmap’ Disk  hdisk  Connection  port vpath5 hdisk42  R1-B4-H1-ZA  300 Excerpt from  ‘ datapath query essmap’ ,[object Object],[object Object],[object Object],[object Object]
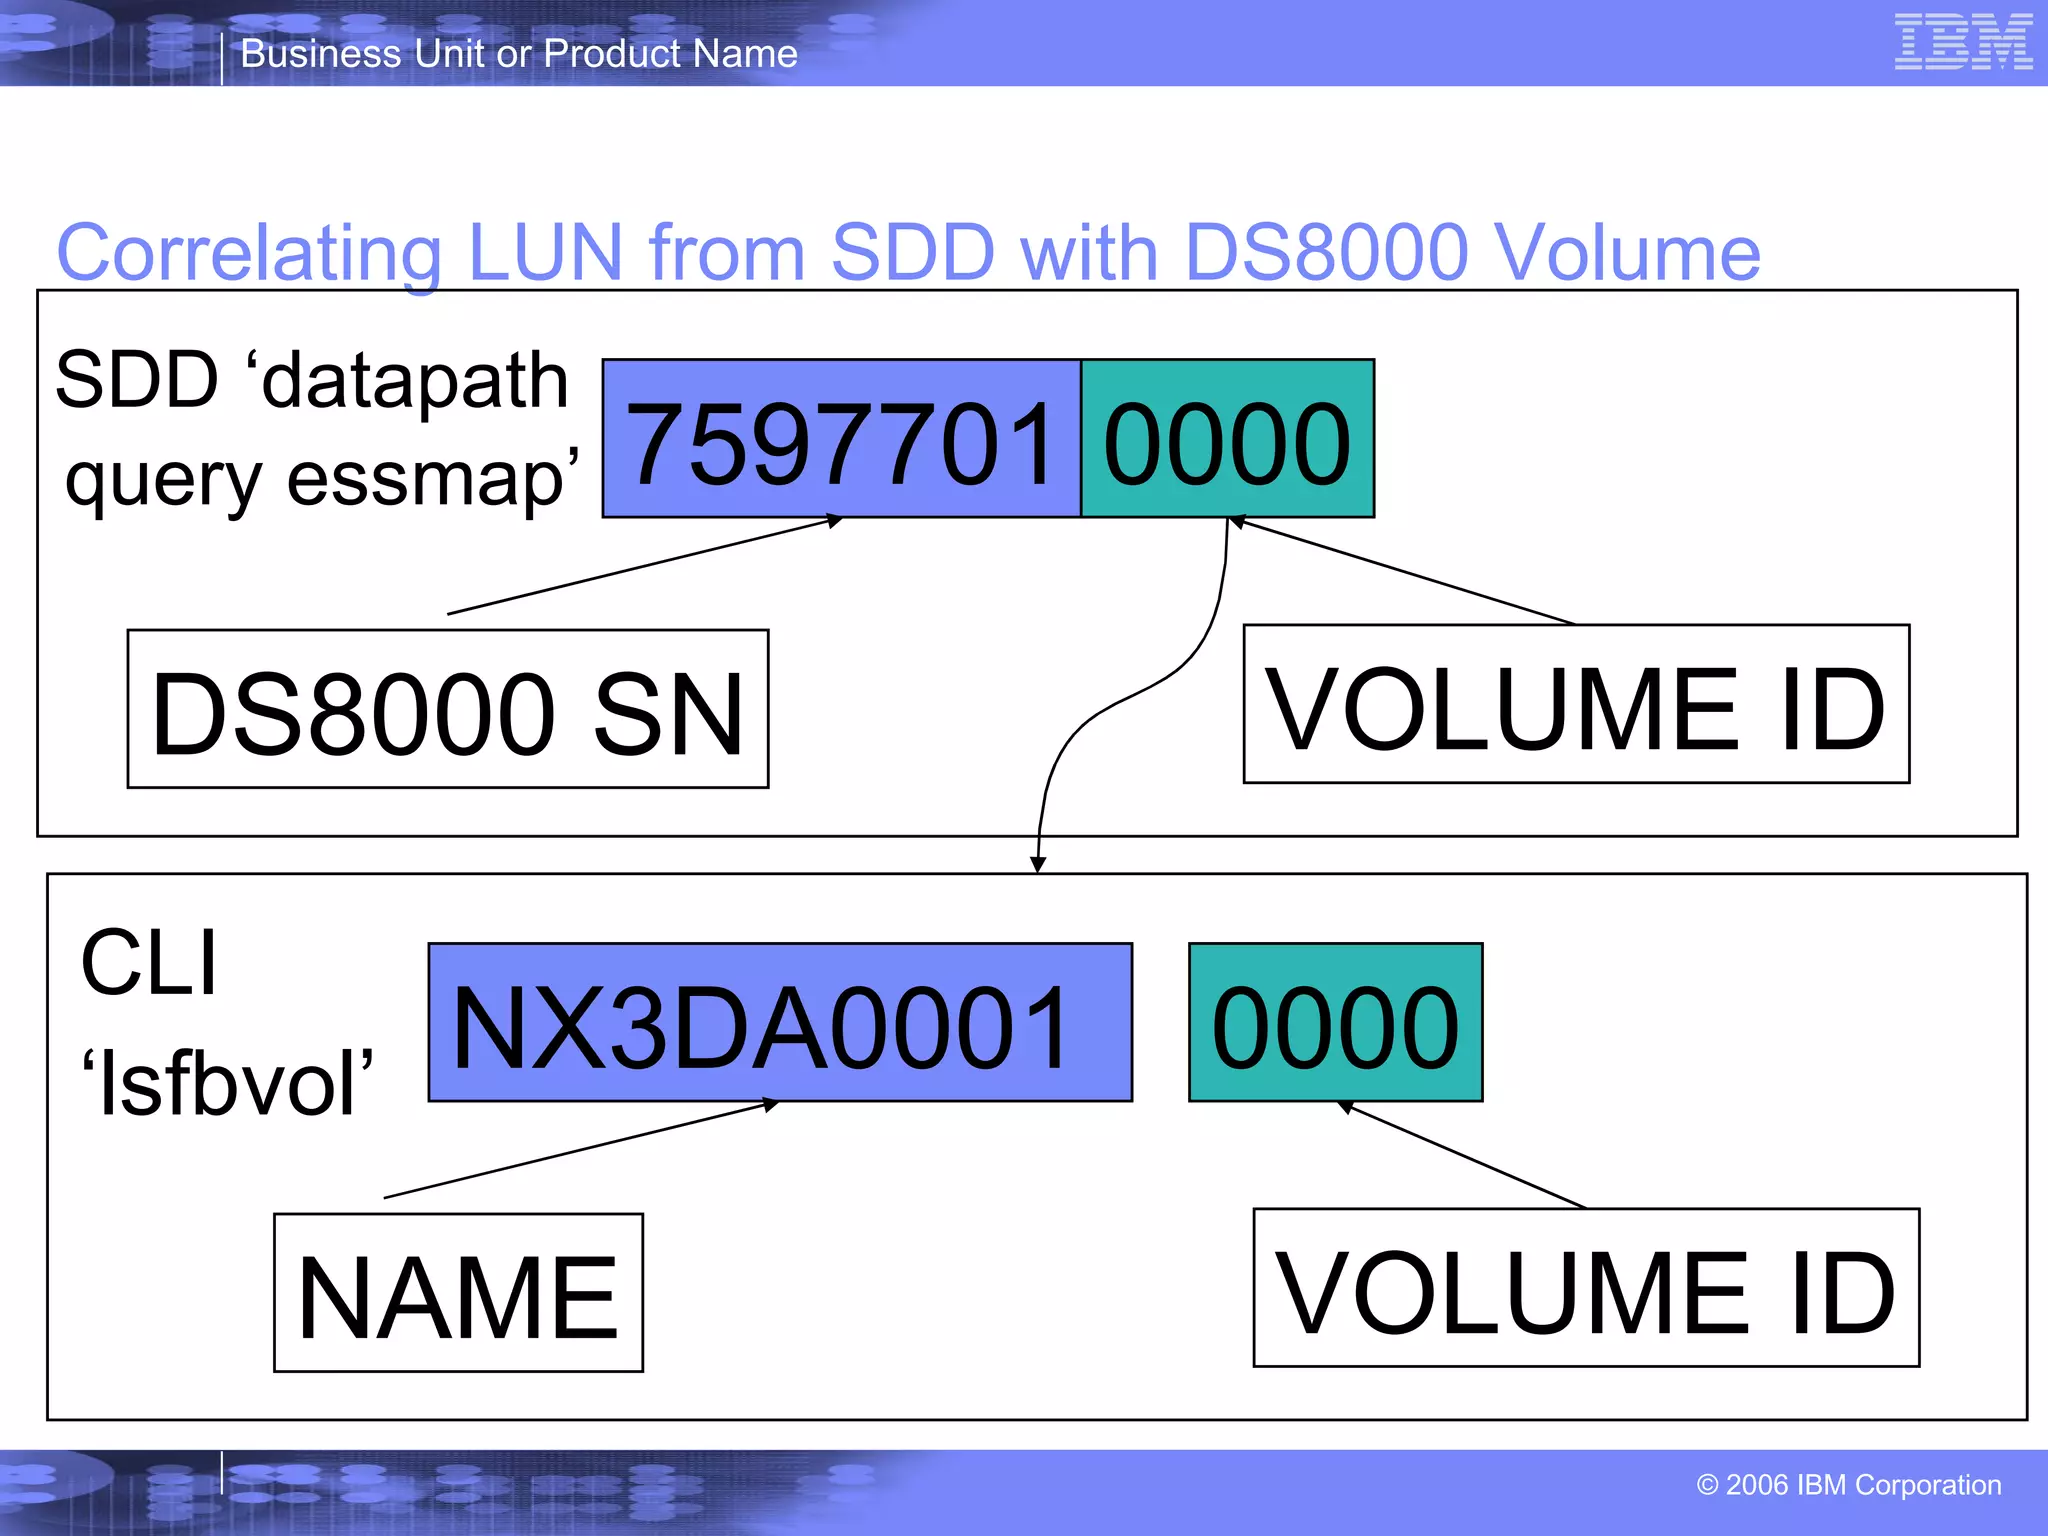
Correlating LUN from SDD with DS8000 Volume DS8000 SN VOLUME ID SDD ‘datapath  query essmap’ NX3DA0001  0000 NAME VOLUME ID CLI ‘ lsfbvol’ 7597701 0000
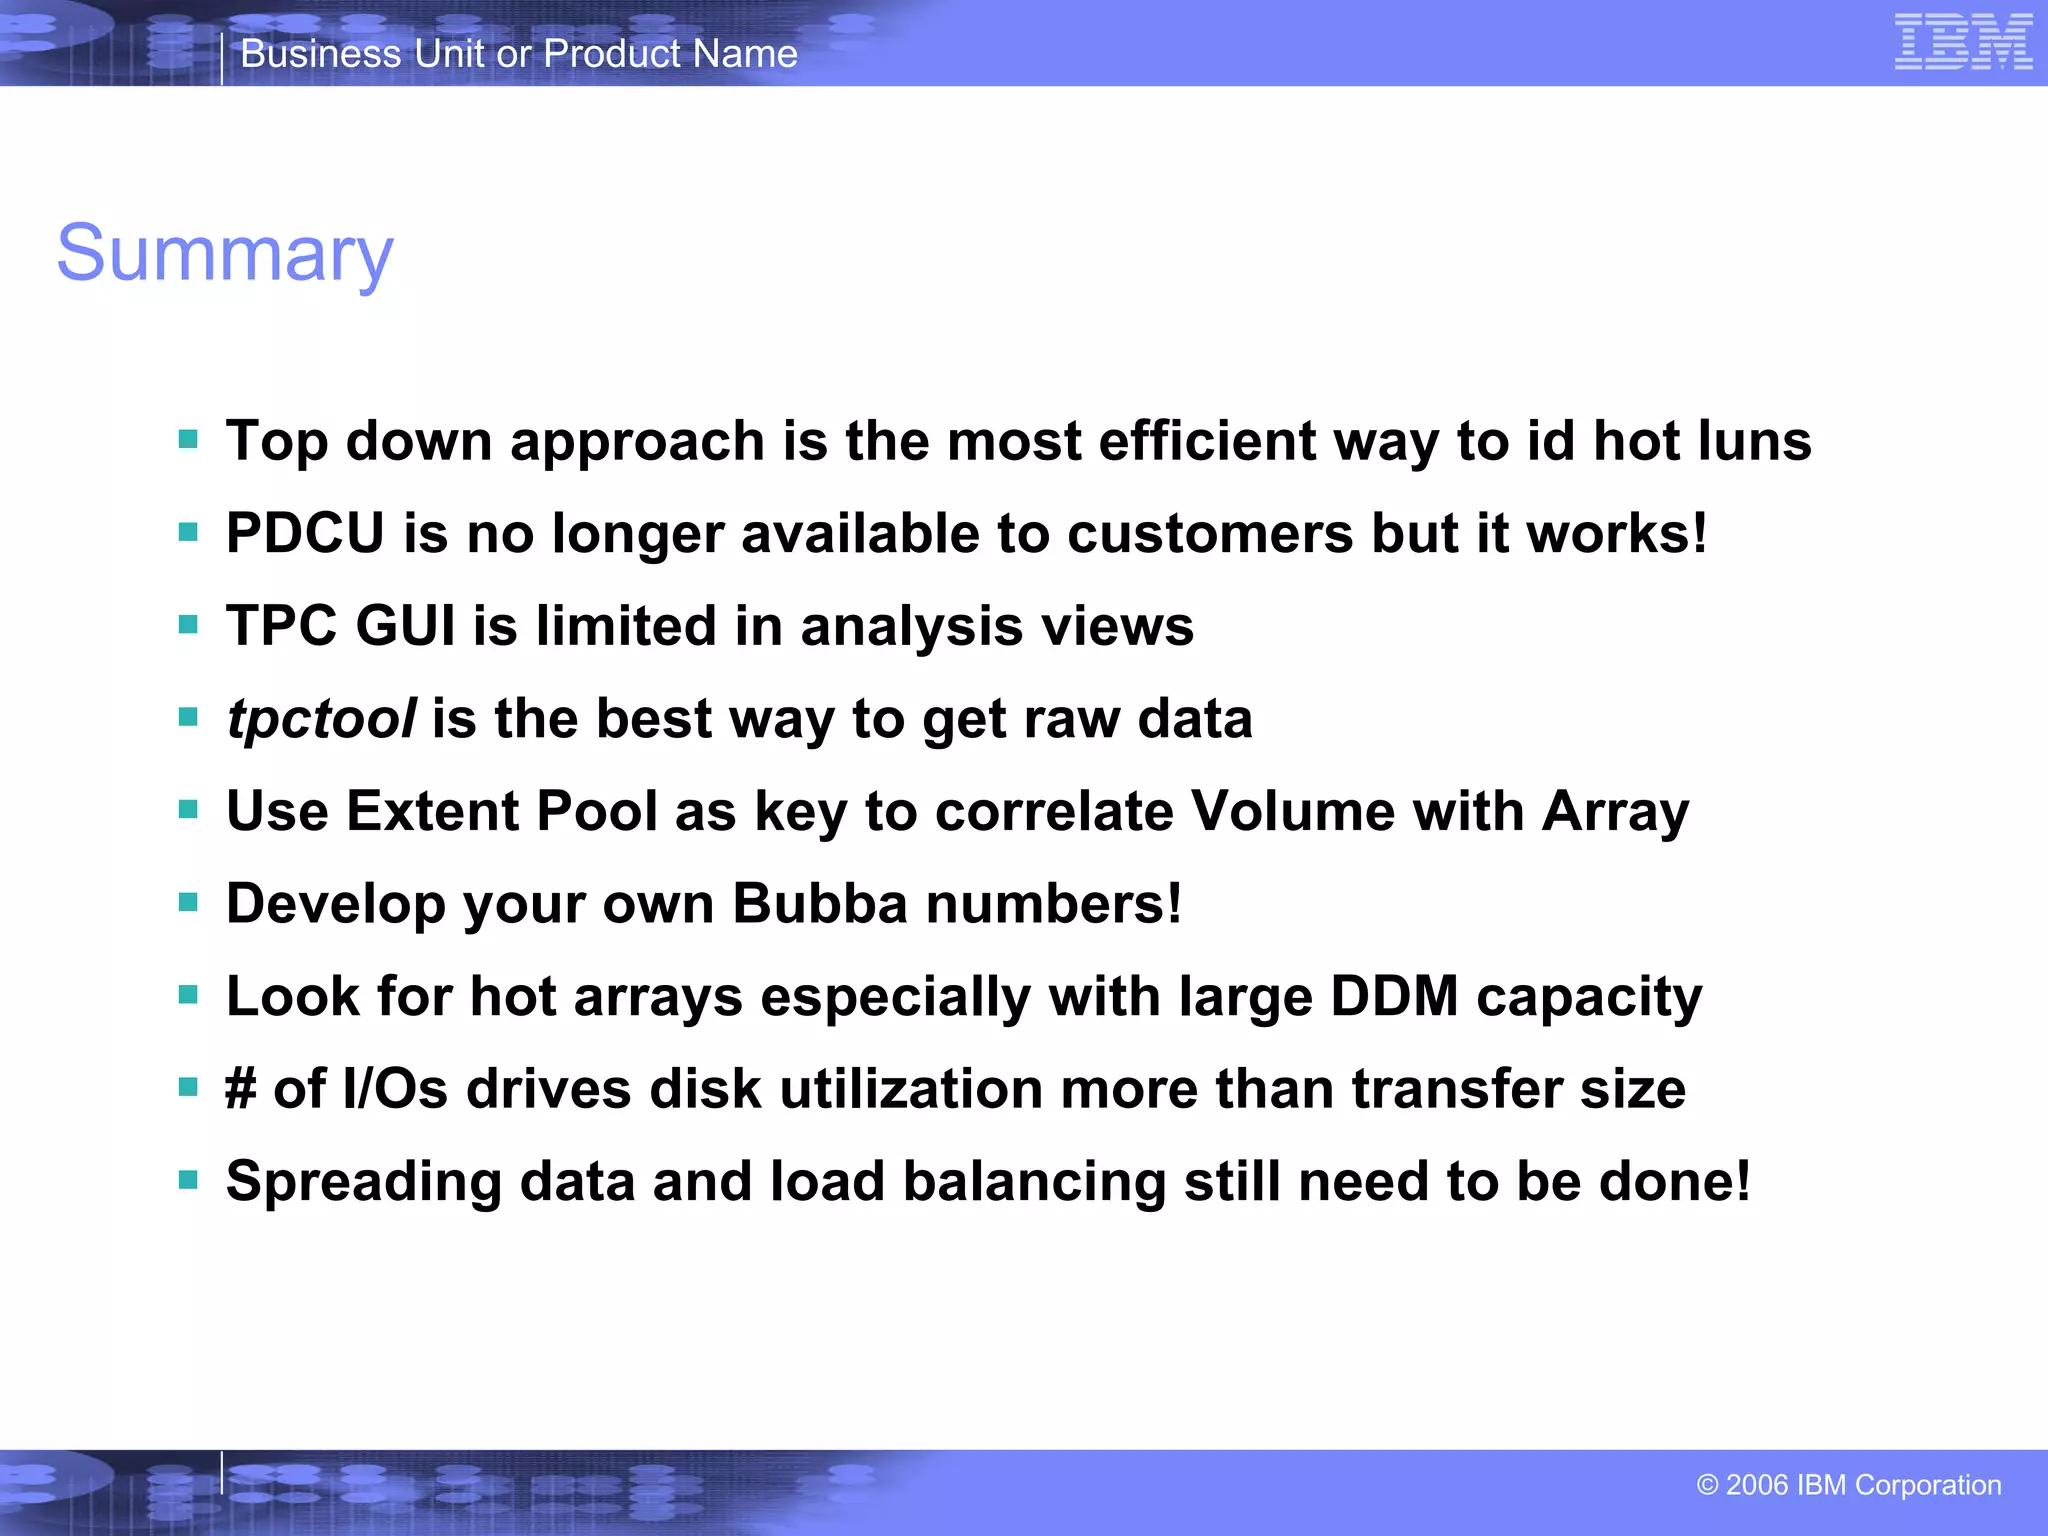
Summary ,[object Object],[object Object],[object Object],[object Object],[object Object],[object Object],[object Object],[object Object],[object Object]
Appendix A:  Configuration - Getting LUN Serial Numbers for DS8000 Devices LCU ID, ChPID, devnum VOLSER RMF PP and online displays RMF zOS VG, hostname, Connection, hdisk,LSS LUN SN datapath query DS8000map SDD 1.6.X AIX Device Name, vpath LUN SN datapath query device SDD Linux SDD SDD Tool Device Name Serial datapath query device Wintel Device Name LUN SN datapath query device HP-UX, Solaris Other Metrics Key Command OS
Appendix B - Measure End-to-End Host Disk I/O Response Time RespTime, ActRate RMF Mon3 DEVR, etc. RMF zOS avgserv  iostat -D iostat  AIX 5.3 Avg. Disk sec/Read Physical Disk perfmon NT/Wintel svctm (ms) iostat –d 2 5 *iostat Linux iostat –xcn 2 5 sar –d  filemon -o /tmp/filemon.log -O all  Command/Object iostat sar filemon Native Tool svc_t (ms) Solaris avserv (ms) HP-UX read time (ms) write time (ms) AIX 5.x – 5.2 Metric(s) OS
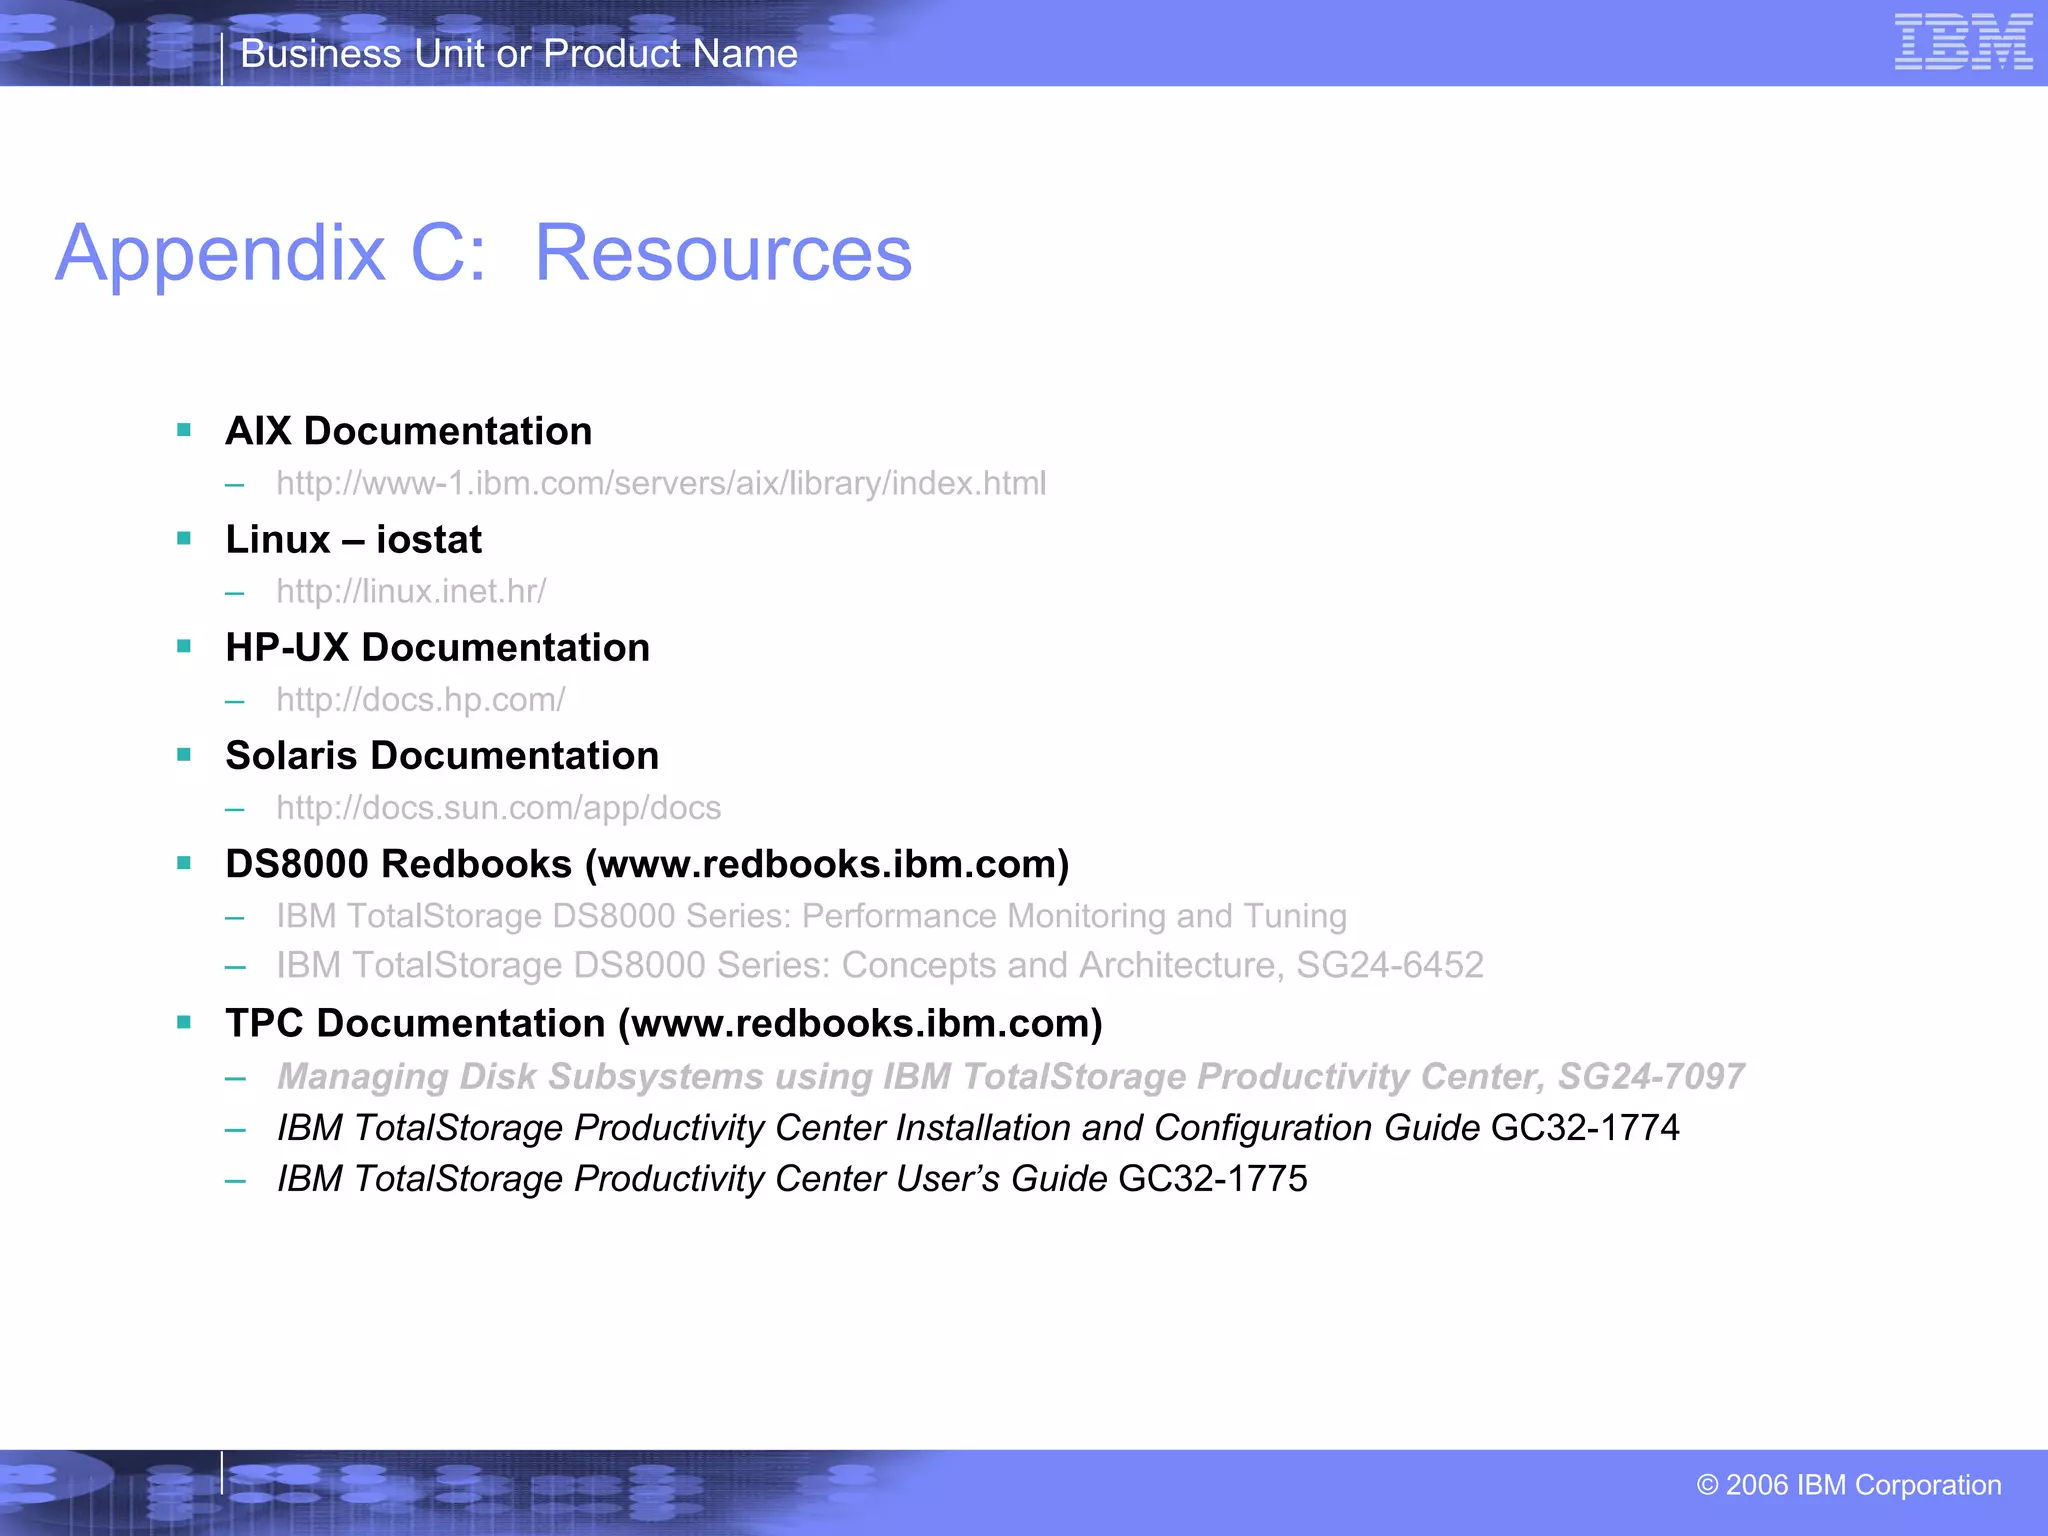
Appendix C:  Resources ,[object Object],[object Object],[object Object],[object Object],[object Object],[object Object],[object Object],[object Object],[object Object],[object Object],[object Object],[object Object],[object Object],[object Object],[object Object]
Biography Brett Allison has been doing distributed systems performance related work since 1997 including J2EE application analysis, UNIX/NT, and Storage technologies.  His current role is Performance and Capacity Management team lead ITDS.  He has developed tools, processes, and service offerings to support storage performance and capacity.  He has spoken at a number of conferences and is the author of several White Papers on performance

More Related Content

What's hot

Student guide power systems for aix - virtualization i implementing virtual...
Student guide   power systems for aix - virtualization i implementing virtual...Student guide   power systems for aix - virtualization i implementing virtual...
Student guide power systems for aix - virtualization i implementing virtual...solarisyougood
 
Spectrum Scale Best Practices by Olaf Weiser
Spectrum Scale Best Practices by Olaf WeiserSpectrum Scale Best Practices by Olaf Weiser
Spectrum Scale Best Practices by Olaf WeiserSandeep Patil
 
AIX Advanced Administration Knowledge Share
AIX Advanced Administration Knowledge ShareAIX Advanced Administration Knowledge Share
AIX Advanced Administration Knowledge Share.Gastón. .Bx.
 
Storage Area Networking: SAN Technology Update & Best Practice Deep Dive for ...
Storage Area Networking: SAN Technology Update & Best Practice Deep Dive for ...Storage Area Networking: SAN Technology Update & Best Practice Deep Dive for ...
Storage Area Networking: SAN Technology Update & Best Practice Deep Dive for ...EMC
 
Enterprise class storage & san
Enterprise class storage & sanEnterprise class storage & san
Enterprise class storage & sanAishwarya wankhade
 
Presentation vmax hardware deep dive
Presentation   vmax hardware deep divePresentation   vmax hardware deep dive
Presentation vmax hardware deep divesolarisyougood
 
JetStor portfolio update final_2020-2021
JetStor portfolio update final_2020-2021JetStor portfolio update final_2020-2021
JetStor portfolio update final_2020-2021Gene Leyzarovich
 
Impact of Intel Optane Technology on HPC
Impact of Intel Optane Technology on HPCImpact of Intel Optane Technology on HPC
Impact of Intel Optane Technology on HPCMemVerge
 
Moving to PCI Express based SSD with NVM Express
Moving to PCI Express based SSD with NVM ExpressMoving to PCI Express based SSD with NVM Express
Moving to PCI Express based SSD with NVM ExpressOdinot Stanislas
 
Virtualisation overview
Virtualisation overviewVirtualisation overview
Virtualisation overviewsagaroceanic11
 
EMC Data domain advanced features and functions
EMC Data domain advanced features and functionsEMC Data domain advanced features and functions
EMC Data domain advanced features and functionssolarisyougood
 
EMC Dteata domain advanced command troubleshoot
EMC Dteata domain advanced command troubleshootEMC Dteata domain advanced command troubleshoot
EMC Dteata domain advanced command troubleshootsolarisyougood
 
Accel - EMC - Data Domain Series
Accel - EMC - Data Domain SeriesAccel - EMC - Data Domain Series
Accel - EMC - Data Domain Seriesaccelfb
 
Brocade Administration & troubleshooting
Brocade Administration & troubleshootingBrocade Administration & troubleshooting
Brocade Administration & troubleshootingprakashjjaya
 
Ibm spectrum scale fundamentals workshop for americas part 4 spectrum scale_r...
Ibm spectrum scale fundamentals workshop for americas part 4 spectrum scale_r...Ibm spectrum scale fundamentals workshop for americas part 4 spectrum scale_r...
Ibm spectrum scale fundamentals workshop for americas part 4 spectrum scale_r...xKinAnx
 
HP Storage pre virtuálne systémy (Prehľad riešení na zálohovanie a ukladanie ...
HP Storage pre virtuálne systémy (Prehľad riešení na zálohovanie a ukladanie ...HP Storage pre virtuálne systémy (Prehľad riešení na zálohovanie a ukladanie ...
HP Storage pre virtuálne systémy (Prehľad riešení na zálohovanie a ukladanie ...ASBIS SK
 

What's hot (20)

Student guide power systems for aix - virtualization i implementing virtual...
Student guide   power systems for aix - virtualization i implementing virtual...Student guide   power systems for aix - virtualization i implementing virtual...
Student guide power systems for aix - virtualization i implementing virtual...
 
Spectrum Scale Best Practices by Olaf Weiser
Spectrum Scale Best Practices by Olaf WeiserSpectrum Scale Best Practices by Olaf Weiser
Spectrum Scale Best Practices by Olaf Weiser
 
AIX Advanced Administration Knowledge Share
AIX Advanced Administration Knowledge ShareAIX Advanced Administration Knowledge Share
AIX Advanced Administration Knowledge Share
 
Storage Area Networking: SAN Technology Update & Best Practice Deep Dive for ...
Storage Area Networking: SAN Technology Update & Best Practice Deep Dive for ...Storage Area Networking: SAN Technology Update & Best Practice Deep Dive for ...
Storage Area Networking: SAN Technology Update & Best Practice Deep Dive for ...
 
Enterprise class storage & san
Enterprise class storage & sanEnterprise class storage & san
Enterprise class storage & san
 
Time finder
Time finderTime finder
Time finder
 
Presentation vmax hardware deep dive
Presentation   vmax hardware deep divePresentation   vmax hardware deep dive
Presentation vmax hardware deep dive
 
JetStor portfolio update final_2020-2021
JetStor portfolio update final_2020-2021JetStor portfolio update final_2020-2021
JetStor portfolio update final_2020-2021
 
Impact of Intel Optane Technology on HPC
Impact of Intel Optane Technology on HPCImpact of Intel Optane Technology on HPC
Impact of Intel Optane Technology on HPC
 
Moving to PCI Express based SSD with NVM Express
Moving to PCI Express based SSD with NVM ExpressMoving to PCI Express based SSD with NVM Express
Moving to PCI Express based SSD with NVM Express
 
Virtualisation overview
Virtualisation overviewVirtualisation overview
Virtualisation overview
 
Commercial track 1_The Power of UDP
Commercial track 1_The Power of UDPCommercial track 1_The Power of UDP
Commercial track 1_The Power of UDP
 
EMC Data domain advanced features and functions
EMC Data domain advanced features and functionsEMC Data domain advanced features and functions
EMC Data domain advanced features and functions
 
EMC Dteata domain advanced command troubleshoot
EMC Dteata domain advanced command troubleshootEMC Dteata domain advanced command troubleshoot
EMC Dteata domain advanced command troubleshoot
 
Accel - EMC - Data Domain Series
Accel - EMC - Data Domain SeriesAccel - EMC - Data Domain Series
Accel - EMC - Data Domain Series
 
Brocade Administration & troubleshooting
Brocade Administration & troubleshootingBrocade Administration & troubleshooting
Brocade Administration & troubleshooting
 
HP 3PAR SSMC 2.1
HP 3PAR SSMC 2.1HP 3PAR SSMC 2.1
HP 3PAR SSMC 2.1
 
Ibm spectrum scale fundamentals workshop for americas part 4 spectrum scale_r...
Ibm spectrum scale fundamentals workshop for americas part 4 spectrum scale_r...Ibm spectrum scale fundamentals workshop for americas part 4 spectrum scale_r...
Ibm spectrum scale fundamentals workshop for americas part 4 spectrum scale_r...
 
HP Storage pre virtuálne systémy (Prehľad riešení na zálohovanie a ukladanie ...
HP Storage pre virtuálne systémy (Prehľad riešení na zálohovanie a ukladanie ...HP Storage pre virtuálne systémy (Prehľad riešení na zálohovanie a ukladanie ...
HP Storage pre virtuálne systémy (Prehľad riešení na zálohovanie a ukladanie ...
 
FAST VP Deep Dive
FAST VP Deep DiveFAST VP Deep Dive
FAST VP Deep Dive
 

Viewers also liked

Ibm flash system v9000 technical deep dive workshop
Ibm flash system v9000 technical deep dive workshopIbm flash system v9000 technical deep dive workshop
Ibm flash system v9000 technical deep dive workshopsolarisyougood
 
What's new in XenDesktop and XenApp
What's new in XenDesktop and XenAppWhat's new in XenDesktop and XenApp
What's new in XenDesktop and XenAppCitrix
 
SVC / Storwize: cache partition analysis (BVQ howto)
SVC / Storwize: cache partition analysis  (BVQ howto)   SVC / Storwize: cache partition analysis  (BVQ howto)
SVC / Storwize: cache partition analysis (BVQ howto) Michael Pirker
 
Impacto de las tic en el aula
Impacto de las tic en el aulaImpacto de las tic en el aula
Impacto de las tic en el aulaBladimir Hoyos
 
Rubrica del proyecto tarea 5
Rubrica del proyecto tarea 5Rubrica del proyecto tarea 5
Rubrica del proyecto tarea 5Bladimir Hoyos
 
Presentación curso itsm cap11
Presentación curso itsm cap11Presentación curso itsm cap11
Presentación curso itsm cap11Bladimir Hoyos
 
Presentación curso itsm cap4
Presentación curso itsm cap4Presentación curso itsm cap4
Presentación curso itsm cap4Bladimir Hoyos
 
Presentación curso itsm cap8
Presentación curso itsm cap8Presentación curso itsm cap8
Presentación curso itsm cap8Bladimir Hoyos
 
Presentación curso itsm cap10
Presentación curso itsm cap10Presentación curso itsm cap10
Presentación curso itsm cap10Bladimir Hoyos
 
IBM FlashSystems A9000/R presentation
IBM FlashSystems A9000/R presentation IBM FlashSystems A9000/R presentation
IBM FlashSystems A9000/R presentation Joe Krotz
 
IBM Flash System® Family webinar 9 de noviembre de 2016
IBM Flash System® Family   webinar 9 de noviembre de 2016 IBM Flash System® Family   webinar 9 de noviembre de 2016
IBM Flash System® Family webinar 9 de noviembre de 2016 Diego Alberto Tamayo
 
Storage Spectrum and Cloud deck late 2016
Storage Spectrum and Cloud deck late 2016Storage Spectrum and Cloud deck late 2016
Storage Spectrum and Cloud deck late 2016Joe Krotz
 
XIV Storage deck final
XIV Storage deck finalXIV Storage deck final
XIV Storage deck finalJoe Krotz
 
Ibm tivoli storage manager bare machine recovery for aix with sysback - red...
Ibm tivoli storage manager   bare machine recovery for aix with sysback - red...Ibm tivoli storage manager   bare machine recovery for aix with sysback - red...
Ibm tivoli storage manager bare machine recovery for aix with sysback - red...Banking at Ho Chi Minh city
 
Ibm tivoli storage manager in a clustered environment sg246679
Ibm tivoli storage manager in a clustered environment sg246679Ibm tivoli storage manager in a clustered environment sg246679
Ibm tivoli storage manager in a clustered environment sg246679Banking at Ho Chi Minh city
 

Viewers also liked (20)

IBM XIV Gen3 Storage System
IBM XIV Gen3 Storage SystemIBM XIV Gen3 Storage System
IBM XIV Gen3 Storage System
 
Ibm flash system v9000 technical deep dive workshop
Ibm flash system v9000 technical deep dive workshopIbm flash system v9000 technical deep dive workshop
Ibm flash system v9000 technical deep dive workshop
 
Linux on System z – disk I/O performance
Linux on System z – disk I/O performanceLinux on System z – disk I/O performance
Linux on System z – disk I/O performance
 
Ibm ds8880 product guide redp5344
Ibm ds8880 product guide redp5344Ibm ds8880 product guide redp5344
Ibm ds8880 product guide redp5344
 
What's new in XenDesktop and XenApp
What's new in XenDesktop and XenAppWhat's new in XenDesktop and XenApp
What's new in XenDesktop and XenApp
 
SVC / Storwize: cache partition analysis (BVQ howto)
SVC / Storwize: cache partition analysis  (BVQ howto)   SVC / Storwize: cache partition analysis  (BVQ howto)
SVC / Storwize: cache partition analysis (BVQ howto)
 
Impacto de las tic en el aula
Impacto de las tic en el aulaImpacto de las tic en el aula
Impacto de las tic en el aula
 
Linux on System z disk I/O performance
Linux on System z disk I/O performanceLinux on System z disk I/O performance
Linux on System z disk I/O performance
 
Rubrica del proyecto tarea 5
Rubrica del proyecto tarea 5Rubrica del proyecto tarea 5
Rubrica del proyecto tarea 5
 
3487570
34875703487570
3487570
 
Presentación curso itsm cap11
Presentación curso itsm cap11Presentación curso itsm cap11
Presentación curso itsm cap11
 
Presentación curso itsm cap4
Presentación curso itsm cap4Presentación curso itsm cap4
Presentación curso itsm cap4
 
Presentación curso itsm cap8
Presentación curso itsm cap8Presentación curso itsm cap8
Presentación curso itsm cap8
 
Presentación curso itsm cap10
Presentación curso itsm cap10Presentación curso itsm cap10
Presentación curso itsm cap10
 
IBM FlashSystems A9000/R presentation
IBM FlashSystems A9000/R presentation IBM FlashSystems A9000/R presentation
IBM FlashSystems A9000/R presentation
 
IBM Flash System® Family webinar 9 de noviembre de 2016
IBM Flash System® Family   webinar 9 de noviembre de 2016 IBM Flash System® Family   webinar 9 de noviembre de 2016
IBM Flash System® Family webinar 9 de noviembre de 2016
 
Storage Spectrum and Cloud deck late 2016
Storage Spectrum and Cloud deck late 2016Storage Spectrum and Cloud deck late 2016
Storage Spectrum and Cloud deck late 2016
 
XIV Storage deck final
XIV Storage deck finalXIV Storage deck final
XIV Storage deck final
 
Ibm tivoli storage manager bare machine recovery for aix with sysback - red...
Ibm tivoli storage manager   bare machine recovery for aix with sysback - red...Ibm tivoli storage manager   bare machine recovery for aix with sysback - red...
Ibm tivoli storage manager bare machine recovery for aix with sysback - red...
 
Ibm tivoli storage manager in a clustered environment sg246679
Ibm tivoli storage manager in a clustered environment sg246679Ibm tivoli storage manager in a clustered environment sg246679
Ibm tivoli storage manager in a clustered environment sg246679
 

Similar to IBM GLOBAL SERVICES Las Vegas Performance Analysis of DS8000 Storage Subsystems

Leveraging Open Source to Manage SAN Performance
Leveraging Open Source to Manage SAN PerformanceLeveraging Open Source to Manage SAN Performance
Leveraging Open Source to Manage SAN Performancebrettallison
 
Oracle RAC Presentation at Oracle Open World
Oracle RAC Presentation at Oracle Open WorldOracle RAC Presentation at Oracle Open World
Oracle RAC Presentation at Oracle Open WorldPaul Marden
 
Storage Consumption and Chargeback
Storage Consumption and ChargebackStorage Consumption and Chargeback
Storage Consumption and Chargebackbrettallison
 
16aug06.ppt
16aug06.ppt16aug06.ppt
16aug06.pptzagreb2
 
Building a high-performance data lake analytics engine at Alibaba Cloud with ...
Building a high-performance data lake analytics engine at Alibaba Cloud with ...Building a high-performance data lake analytics engine at Alibaba Cloud with ...
Building a high-performance data lake analytics engine at Alibaba Cloud with ...Alluxio, Inc.
 
IMCSummit 2015 - Day 1 Developer Track - Evolution of non-volatile memory exp...
IMCSummit 2015 - Day 1 Developer Track - Evolution of non-volatile memory exp...IMCSummit 2015 - Day 1 Developer Track - Evolution of non-volatile memory exp...
IMCSummit 2015 - Day 1 Developer Track - Evolution of non-volatile memory exp...In-Memory Computing Summit
 
Технологии работы с дисковыми хранилищами и файловыми системами Windows Serve...
Технологии работы с дисковыми хранилищами и файловыми системами Windows Serve...Технологии работы с дисковыми хранилищами и файловыми системами Windows Serve...
Технологии работы с дисковыми хранилищами и файловыми системами Windows Serve...Виталий Стародубцев
 
What we unlearned_and_learned_by_moving_from_m9000_to_ssc_ukoug2014
What we unlearned_and_learned_by_moving_from_m9000_to_ssc_ukoug2014What we unlearned_and_learned_by_moving_from_m9000_to_ssc_ukoug2014
What we unlearned_and_learned_by_moving_from_m9000_to_ssc_ukoug2014Philippe Fierens
 
Thomas+Niewel+ +Oracletuning
Thomas+Niewel+ +OracletuningThomas+Niewel+ +Oracletuning
Thomas+Niewel+ +Oracletuningafa reg
 
Data Protection Manager – Soluţie Enterprise pentru Backup-Microsoft -8sept2010
Data Protection Manager – Soluţie Enterprise pentru Backup-Microsoft -8sept2010Data Protection Manager – Soluţie Enterprise pentru Backup-Microsoft -8sept2010
Data Protection Manager – Soluţie Enterprise pentru Backup-Microsoft -8sept2010Agora Group
 
HP Virtualization Solutions: Making the Virtual Real
HP Virtualization Solutions: Making the Virtual RealHP Virtualization Solutions: Making the Virtual Real
HP Virtualization Solutions: Making the Virtual Realelliando dias
 
SHARE.ORG in Boston Aug 2013 RHEL update for IBM System z
SHARE.ORG in Boston Aug 2013 RHEL update for IBM System zSHARE.ORG in Boston Aug 2013 RHEL update for IBM System z
SHARE.ORG in Boston Aug 2013 RHEL update for IBM System zFilipe Miranda
 
3PAR and VMWare
3PAR and VMWare3PAR and VMWare
3PAR and VMWarevmug
 
958 and 959 sales exam prep
958 and 959 sales exam prep958 and 959 sales exam prep
958 and 959 sales exam prepJason Wong
 
[db tech showcase Tokyo 2018] #dbts2018 #B17 『オラクル パフォーマンス チューニング - 神話、伝説と解決策』
[db tech showcase Tokyo 2018] #dbts2018 #B17 『オラクル パフォーマンス チューニング - 神話、伝説と解決策』[db tech showcase Tokyo 2018] #dbts2018 #B17 『オラクル パフォーマンス チューニング - 神話、伝説と解決策』
[db tech showcase Tokyo 2018] #dbts2018 #B17 『オラクル パフォーマンス チューニング - 神話、伝説と解決策』Insight Technology, Inc.
 

Similar to IBM GLOBAL SERVICES Las Vegas Performance Analysis of DS8000 Storage Subsystems (20)

Leveraging Open Source to Manage SAN Performance
Leveraging Open Source to Manage SAN PerformanceLeveraging Open Source to Manage SAN Performance
Leveraging Open Source to Manage SAN Performance
 
Oracle RAC Presentation at Oracle Open World
Oracle RAC Presentation at Oracle Open WorldOracle RAC Presentation at Oracle Open World
Oracle RAC Presentation at Oracle Open World
 
Storage Consumption and Chargeback
Storage Consumption and ChargebackStorage Consumption and Chargeback
Storage Consumption and Chargeback
 
Dpdk applications
Dpdk applicationsDpdk applications
Dpdk applications
 
16aug06.ppt
16aug06.ppt16aug06.ppt
16aug06.ppt
 
CSL_Cochin_c
CSL_Cochin_cCSL_Cochin_c
CSL_Cochin_c
 
Building a high-performance data lake analytics engine at Alibaba Cloud with ...
Building a high-performance data lake analytics engine at Alibaba Cloud with ...Building a high-performance data lake analytics engine at Alibaba Cloud with ...
Building a high-performance data lake analytics engine at Alibaba Cloud with ...
 
IMCSummit 2015 - Day 1 Developer Track - Evolution of non-volatile memory exp...
IMCSummit 2015 - Day 1 Developer Track - Evolution of non-volatile memory exp...IMCSummit 2015 - Day 1 Developer Track - Evolution of non-volatile memory exp...
IMCSummit 2015 - Day 1 Developer Track - Evolution of non-volatile memory exp...
 
Технологии работы с дисковыми хранилищами и файловыми системами Windows Serve...
Технологии работы с дисковыми хранилищами и файловыми системами Windows Serve...Технологии работы с дисковыми хранилищами и файловыми системами Windows Serve...
Технологии работы с дисковыми хранилищами и файловыми системами Windows Serve...
 
The Cell Processor
The Cell ProcessorThe Cell Processor
The Cell Processor
 
What we unlearned_and_learned_by_moving_from_m9000_to_ssc_ukoug2014
What we unlearned_and_learned_by_moving_from_m9000_to_ssc_ukoug2014What we unlearned_and_learned_by_moving_from_m9000_to_ssc_ukoug2014
What we unlearned_and_learned_by_moving_from_m9000_to_ssc_ukoug2014
 
Thomas+Niewel+ +Oracletuning
Thomas+Niewel+ +OracletuningThomas+Niewel+ +Oracletuning
Thomas+Niewel+ +Oracletuning
 
Data Protection Manager – Soluţie Enterprise pentru Backup-Microsoft -8sept2010
Data Protection Manager – Soluţie Enterprise pentru Backup-Microsoft -8sept2010Data Protection Manager – Soluţie Enterprise pentru Backup-Microsoft -8sept2010
Data Protection Manager – Soluţie Enterprise pentru Backup-Microsoft -8sept2010
 
HP Virtualization Solutions: Making the Virtual Real
HP Virtualization Solutions: Making the Virtual RealHP Virtualization Solutions: Making the Virtual Real
HP Virtualization Solutions: Making the Virtual Real
 
IO Dubi Lebel
IO Dubi LebelIO Dubi Lebel
IO Dubi Lebel
 
SHARE.ORG in Boston Aug 2013 RHEL update for IBM System z
SHARE.ORG in Boston Aug 2013 RHEL update for IBM System zSHARE.ORG in Boston Aug 2013 RHEL update for IBM System z
SHARE.ORG in Boston Aug 2013 RHEL update for IBM System z
 
3PAR and VMWare
3PAR and VMWare3PAR and VMWare
3PAR and VMWare
 
958 and 959 sales exam prep
958 and 959 sales exam prep958 and 959 sales exam prep
958 and 959 sales exam prep
 
Introduction to z/OS
Introduction to z/OSIntroduction to z/OS
Introduction to z/OS
 
[db tech showcase Tokyo 2018] #dbts2018 #B17 『オラクル パフォーマンス チューニング - 神話、伝説と解決策』
[db tech showcase Tokyo 2018] #dbts2018 #B17 『オラクル パフォーマンス チューニング - 神話、伝説と解決策』[db tech showcase Tokyo 2018] #dbts2018 #B17 『オラクル パフォーマンス チューニング - 神話、伝説と解決策』
[db tech showcase Tokyo 2018] #dbts2018 #B17 『オラクル パフォーマンス チューニング - 神話、伝説と解決策』
 

IBM GLOBAL SERVICES Las Vegas Performance Analysis of DS8000 Storage Subsystems

  • 1. IBM GLOBAL SERVICES Las Vegas, NV P04 Brett Allison Practical Performance Analysis of DS8000 Storage Subsystems July 24 - 28, 2006 ® © IBM Corporation 2006
  • 2.
  • 3.
  • 4.
  • 5.
  • 6. Disk Magic Observations – 70/30/50 – Varying Block Size
  • 7. Disk Magic Observations – 70/30/50 – Varying # I/Os
  • 8. Performance Analysis Process – I/O – Bottom Up Host resource issue? Fix it ID hot/slow Host disks ID hot/slow Host disks Host Analysis – Phase 1 Storage server Analysis – Phase 2 Storage Srvr perf data Fix it N Y
  • 9. Storage Subsystem Performance Analysis Process Always Collect Performance Data! Application Problem? Disk Contention? Yes Fix ! No Look at Performance Data No Identify other resource Identify Ripest Fruit and Harvest
  • 10. Collecting Performance Data – Storage Subsystem Requires Infrastructure Scalable Complicated Documented Expensive Supported Limited views/analysis Broad range of data collected TPC 3.1 No longer available for customer download Free Excel macro for post-processing provided Low collection system overhead Limited performance data Collects Port, Array, Volume data Limited documentation Easy installation/Usage Performance Data Collection Utility (PDCU) Cons Pros Tool
  • 11.
  • 12. Read Response Time by Port - PDCU
  • 13. All Volume Read Response Time - PDCU
  • 14. Analyzing Volume Data – PDCU/Excel Pivot Table Volume Data Summary Table
  • 15. Analyzing Volume Data – PDCU/Excel Continued 99% 19% 759.37 93.23 8.14 0x5001 80% 19% 780.99 96.86 8.06 0x4e0b 61% 20% 796.91 97.87 8.14 0x4e02 41% 20% 826.57 101.84 8.12 0x4f0b 21% 21% 828.30 102.32 8.10 0x5000 Cumulative % % Total Total I/O RT Avg Read I/O Rate Avg R RT Volume ID
  • 16.
  • 17. Analyze the Arrays Associated with the Hot Volumes - PDCU
  • 18. Performing Bottom Up Analysis using TPC for Disk – Array Utilization Report
  • 19. Drill Down from the Array Table - TPC Select the magnifying glass icon to drill down to volumes From the volumes table you can chart all volumes volume
  • 20.
  • 21. Performance Analysis Process – I/O – Top Down Host resource issue? Fix it ID hot/slow Host disks ID hot/slow Host disks Host Analysis – Phase 1 Storage server Analysis – Phase 2 Storage Srvr perf data Fix it N Y
  • 22. Host I/O Analysis - Example of AIX Server Gather LUN ->hdisk information See Appendix A) Disk Path P Location adapter LUN SN Type vpath197 hdisk42 09-08-01[FC] fscsi0 75977014E01 IBM 2107-900 Format the data (email me for the filemon-DS8000map.pl script) Note: The formatted data can be used in Excel pivot tables to perform top-down examination of I/O subsystem performance ------------------------------------------------------------------------ Detailed Physical Volume Stats (512 byte blocks) ------------------------------------------------------------------------ VOLUME: /dev/hdisk42 description: IBM FC 2107 reads: 1723 (0 errs) read sizes (blks): avg 180.9 min 8 max 512 sdev 151.0 read times (msec): avg 4.058 min 0.163 max 39.335 sdev 4.284 Gather Response Time Data ‘filemon’ (See Appendix B) 91.8 2.868 1978 hdisk1278 75977010604 7597701 test1 18:04:05 May/30/2006 93.3 3.832 1605 hdisk42 75977014E01 7597701 test1 18:04:05 May/30/2006 AVG_READ_KB READ_TIMES #READS HDISK LUN DS8000 SERVER TIME DATE
  • 23. Host I/O Analysis – Helpful Views – Pivot tables from filemon data and ‘datapath query essmap’ LSS 7 & 10 I/Os make up 47% of total RT LSS View Rank View Rank ‘ffff’ LUNs ‘0703’ & ‘0709’ make up 46% of total RT to LSS 7 & 10
  • 24.
  • 25. Correlating LUN from SDD with DS8000 Volume DS8000 SN VOLUME ID SDD ‘datapath query essmap’ NX3DA0001 0000 NAME VOLUME ID CLI ‘ lsfbvol’ 7597701 0000
  • 26.
  • 27. Appendix A: Configuration - Getting LUN Serial Numbers for DS8000 Devices LCU ID, ChPID, devnum VOLSER RMF PP and online displays RMF zOS VG, hostname, Connection, hdisk,LSS LUN SN datapath query DS8000map SDD 1.6.X AIX Device Name, vpath LUN SN datapath query device SDD Linux SDD SDD Tool Device Name Serial datapath query device Wintel Device Name LUN SN datapath query device HP-UX, Solaris Other Metrics Key Command OS
  • 28. Appendix B - Measure End-to-End Host Disk I/O Response Time RespTime, ActRate RMF Mon3 DEVR, etc. RMF zOS avgserv iostat -D iostat AIX 5.3 Avg. Disk sec/Read Physical Disk perfmon NT/Wintel svctm (ms) iostat –d 2 5 *iostat Linux iostat –xcn 2 5 sar –d filemon -o /tmp/filemon.log -O all Command/Object iostat sar filemon Native Tool svc_t (ms) Solaris avserv (ms) HP-UX read time (ms) write time (ms) AIX 5.x – 5.2 Metric(s) OS
  • 29.
  • 30. Biography Brett Allison has been doing distributed systems performance related work since 1997 including J2EE application analysis, UNIX/NT, and Storage technologies. His current role is Performance and Capacity Management team lead ITDS. He has developed tools, processes, and service offerings to support storage performance and capacity. He has spoken at a number of conferences and is the author of several White Papers on performance

Editor's Notes

  1. The purpose of this presentation is to help storage administrators by providing a high level over view of the DS8000 performance characteristics, storage performance analysis processes, and storage tools.
  2. The Goal of this Presentation is to provide some practical tips for storage administrators Author intro: End to End Performance Support for Managed Storage Service – 17 DS8000 Systems as of 5/25 Over 125 ESS Model 800 Over 2 Petabytes of Managed Storage Proactive, Reactive support for all customers
  3. DS8000 not likely to have Backend DA saturation as looped SSA architecture is gone! Backend access is 2 GB/sec switched fibre! The back end DA saturation on the 200MB fiber will happen at rates not attainable by 40MB SSA. Since it is easier to generate disk load than it is to create faster disks, there will still be contention. Disk contention on arrays can and will exist. Port contention can still occur LPAR isolation is limited to model 9A2 New cache algorithm (SARC) is faster but perceived performance improvements will vary depending on actual workload. SARC provides up to a 25% improvement of the I/O response time in comparison to the LRU algorithm. It provides some batch/online isolation and is a platform for more isolation. %SARC improvement is more a description of the talent of the person who ran the measurements than it is a description of the product. People want a number, 25% is okay. I'm glad to have 256GB.
  4. Various tests were ran with differing block sizes, and same number of I/Os, disk size, disk speed and workload 70/30 50% Read Hit For any given number of I/Os per second, the block size only seems to affect the utilization of the host adapters and the I/O bus. It doesn't appear to affect the utilization of the disk or the processors A mixed size workload (4k, 8k, 16k, 32k,) will perform exactly the same as a fixed size workload of, say all 16k blocks for the same number of IO/s and the same storage configuration. Don't worry about a mixture of large and small block sizes; worry about mixing large and small block sizes. Overall I/O throughput (MB/s) seems to be limited by the number of transactions, not the block size (up to a point!)
  5. Various tests were ran with the same block size and differing number of I/Os. Disk size, disk speed and same workload 70/30 50% Read Hit Increasing the number of I/Os per second with a fixed block size does impact the utilization of disk together with SMP utilization Side note…other tests showed: Cache hit service time = .5 ms Disk size affects capacity not necessarily performance! Per Siebo, I did 18-36 GB comparisons on DS4000 for various workloads. There is not a difference due to disk size. If they seek the same, spin the same, and transfer the same, you get the same response for any I/O rate.
  6. Gather Storage Server performance and configuration data Gather SAN fabric configuration and exception data If port saturation then contact SAN design team Analyze storage server configuration and performance data If DS8000 issue exists then recommend corrective actions Why do we use I/O response time? On most systems with virtualized storage with multiple paths the disk utilization numbers are misleading. You might have a device that shows 100% busy but it could have excellent response time. The device is not actually 100% busy because it is not really a device but a path to a logical storage unit located on multiple devices. The most telling type of I/O metric is the I/O response time. The I/O response time should be viewed in conjunction with activity rates to provide an understanding of the impact to the response time on the overall performance. There is a need to limit analysis to only the disks used by the application having a problem. LUN Serial Numbers can be used to correlate the Storage Server performance data with the server physical device information.
  7. Different people have different ways of identifying the ripest fruit to harvest. The key is to make sure that the resource you identify and eventually take action upon is the resource the one that has the best balance between providing the biggest performance benefit and minimizing the impact of the change
  8. PDCU Requires Root (AIX, Linux) or Administrator (Windows) privileges are not required for installation or execution of PDCU Note: File sizes are large (40-60MB) Windows note: Do not install PDCU into a path that contains the character sequence "pd“ (a common choice!). Open a Tech Support Request to engage a specialist http://dalnotes1.sl.dfw.ibm.com/atss/techxpress.nsf/request?OpenForm There are ways to gather performance data about I/Os issued to Volumes residing on external storage subsystems from a server perspective. MVS probably has the most comprehensive set of measurements available. Distributed systems have information also and it varies from platform to platform.
  9. With utilizations > 50% the response time starts to increase noticeably Port Weirdness…You can attach 4 channels(ports) to a Host Adapter. With one channel, you can get 200 MB/second; 2 channels, 400 MB/sec; 3 Channels 540 MB /sec, and 4 channels 540 MB/sec The response times are not completely arbitrary. For Ports, the write response time should be < 1 ms as it should be write hits 100% of time. Another measurement that is available for ports is the population. Busy = Population / (1+Population) For volume response time, it is my experience that the customers will not typically complain if the avg response time is < 6 ms for volume I/Os…this includes cache hits/cache misses. If the avg response times are > 6 ms it typically indicates contention on the backend at DA or DDM. Typically DDM for high I/Os small size transfer & DA if transfer size is > 256 KB For array response times > 6 ms is where you see the ddm utilization start to go beyond 50 % although 10ms is a more reasonable number.
  10. In this case the read response times for several of the ports were > 6 ms…this could be an issue where 1 or more servers zoned to the hba is accessing a volume or set of volumes that are on a constrained array During this period there was no corresponding spikes in read i/o rate or throughput. Drill down to volume to see if there is any correlation
  11. There appears to be correlation in the average read response time for all volumes and the average read response time for ports The next step is to drill down to the volumes that had high avg read response times during the point 7 – 16 on the x-axis
  12. Put the Volume Statistics in Excel Table Create a pivot with Volumes in the row fields and time in the column field (Limit time to desired range) Place Average Read Response Time in Data Field! Create an average in the grand total field Copy volume ID to a new analysis table along with avg response times
  13. In the pivot table add the summary of read i/o rate and copy to analysis table Create a Total I/O Response Time field (=sum (Avg Read RT * sum Read I/O Rate) + sum(Avg Write RT* SUM(Write I/O Rate). In this example I did not include the writes as they were neglible. I like to create a % Total colum which is the Total I/O RT for an individual Volume / the sum of the total response time for all Volumes. This provides an I/O metric that gives a sense of the overall impact and is a good metric to sort on.
  14. In order to issue the CLI commands you must have installed the DSCLI component on a system with connectivity to the DS8000 management console (HMC) and you must have a userid with read privileges The column headers provide a sample of the output. In this case we are looking to ID the extpool (extent pool) id of the hot volumes previously identified and use the extent pool ID to identify the arrays in the lsarray output Drop the first character of the Rank ID and convert the rank to hex to match the output of ‘lsarray’ with that gathered in SDD output.
  15. Now you that you have identified the arrays in question, look at the array response time and see if there is any correlation between the array response time and the volume response time. In this case there is a slight correlation between the spike in vol read response time and the response time on the array In reality you should look at the other metrics available for the array including I/O rates, transfer sizes, etc.
  16. TPC 3.1.1 – The current GA version has several views that may be useful in the bottom up approach. Graph the array utilization for the subsystem you are interested in… By hovering over the spikes in the array utilization you can determine the time of the spikes. By referencing the legend, you can identify the array with the spike. In this case, the spikes were on array 18 at: 2:35pm, 4:18pm, 7:05pm, 11:32pm, 1:14 am,5:22 am,12:24 pm. By going back to the list of arrays you can drill down on the array to see the volumes stored on the array The first view is the Array view. This allows you to historically chart an array metric for up to 10 arrays within a single view. You can export the data to CSV. You can view additional arrays by selecting Next You can also modify the time window by checking the Limit days check box and specifying a start and stop time The array provides information on the lowest level of the disk storage subsystem (the physical disks) and can be very useful in PD. A list of metrics can be found in the following publication: IBM TotalStorage Productivity Center User’s Guide GC32-1775
  17. After you drill down from the array to the volumes you are provided a list of volumes. At this point you can either chart the volume performance data (10 per chart) or export the data.
  18. Requires that the CLI component gets installed either locally on the TPC server or remotely If remote, then access will need to be set up and you will need a userid/password. The userid/pwd you have to access the GUI works In order to gather stats for more than 1 component you need to issue the command multiple times
  19. Confirm that the issue is NOT with server resources Verify that host CPU utilization, Paging I/O, and local HBA saturation are not source of performance issues Identify any host disks with high I/O response time Map the host disk to Storage Server device name Gather Storage Server performance and configuration data Gather SAN fabric configuration and exception data If port saturation then contact SAN design team Analyze storage server configuration and performance data If DS8000 issue exists then recommend corrective actions Why do we use I/O response time? On most systems with virtualized storage with multiple paths the disk utilization numbers are misleading. You might have a device that shows 100% busy but it could have excellent response time. The device is not actually 100% busy because it is not really a device but a path to a logical storage unit located on multiple devices. The most telling type of I/O metric is the I/O response time. LUN Serial Numbers can be used to correlate the Storage Server performance data with the server physical device information.
  20. The AIX filemon tool is a trace based facility and should only be ran for a couple of minutes at a time. The other UNIX flavors provide I/O response time data that can be gathered continuously at reasonable intervals as they are not trace based (See Appendix C for other flavors). The read size is always in 512 byte blocks chunks. So in this case there were 620 reads. The avg read size was 8 Blocks (512 Byte blocks) or 4096 Bytes (4 KB) chunks. These are random I/Os as the number of read sequences is the same as the number of I/Os. The minimal information that you need to pull from this is: Time When filemon started, Volume, Reads, Avg Read Time, Writes, Avg Write Time. I would filter out any records that have 1 I/O or less. For the LUN >hdisk mapping, run the SDD command ‘datapath query essmap’ command. Minimally you will want to pull the Hostname and the hdisk information on a daily basis if you have access to the servers or install an agent that ftp’s the information to somewhere where you can load it in a configuration database. After the data has been formatted, sort by the highest average response time. It is helpful to create a pivot table and average the I/O response times for each of the LUNs and create a sorted list of the LUNs with the highest response time.
  21. The first view sorts and sums the total Response Time (RT) for all I/Os associated with each LSS. In this case I/Os to volumes on LSS 7,10,8,9 & 12 make up 81% of the total I/O RT. These are the ones you should drill down on. I/Os are evenly distributed across the volumes on Rank ‘ffff’ – By sorting on different DS8000 components you can drill down to different physical levels. This is a good method to find saturated components when the components are consistently saturated. Another potentially beneficial view is that of the hot Ranks/Volumes over time. This can show the spikes that would not otherwise get observed in the summary tables.
  22. In addition to the host Connection information, the output of the ‘datapath query essmap’ command contains the Rank and LSS. While there is no fixed association between LSS’s and physical placement on the DS8000, it is helpful in knowing that LUNs reside on different Server (Even numbered LSS’s belong to server0 and odd to server1) and on different ranks. Knowing the rank-> LUN association can help in determining which LUNs should be chosen for striped lvs or spread lvs.
  23. The LUN ID provided in SDD is 11 Chars. The first 7 are the SN of the DS8000 image and the last 4 chars are the volume ID The first 2 columns of the ‘lsfbvol’ command are Name ID – The ID will correlate to the volume ID. There is also an Extent Pool Column The name is used in TPC for Data to identify the Volume The volume ID is used in PDCU and the Extent Pool can be used to identify the rank – using the Extent Pool as a key
  24. VG = Volume Group Connection = The shark hba location Device Name = OS device LCU = Logical Control Unit ChPID = Channel Path ID =~ HBA or Path
  25. Generally speaking the I/O response time is the amount of time it takes from the point where the I/O request hits the device driver until the I/O is returned from the device driver The iostat package for Linux is only valid with a 2.4 & 2.6 kernel