SlideShare a Scribd company logo
1 of 2
Download to read offline
Comp. Biochem. Physiol., 1975, Vol. 52A, pp, 19 to 20, Pergamon Press. Printed in Great Britain


                       ANALYSIS OF POLYNOMIAL FUNCTIONS FOR
                         DETERMINING MAXIMUM OR M I N I M U M
                          CONDITIONS IN BIOLOGICAL SYSTEMS

                               EUGENE H. STUDIER, RICHARD W. DAPSON AND ROGER E. BIGELOW
                               Department of Biology, University of Michigan, Flint, Flint, MI 48503, U.S.A.

                                                                (Received 31 July 1974)

            Abstract--1. When physiological condition is curvilinearly related to environmental conditions, the "op-
            timum" environmental condition is frequently determined by intersecting two straight lines.
               2. Errors in this method are discussed, and a more precise method is suggested.
               3. The curvilinear function is described by polynomial regression.
               4. Optimum values of the independent variable (i.e. those resulting in maximum or minimum physio-
            logical responses) are found where the slope is zero, and can be calculated easily from the first derivative
            of the regression line.
               5. Two examples are given: heart rate-temperature and oxygen consumption-pH.


MANY curvilinear functions are studied in a wide var-                             for maxima and underestimates for minima. Further-
iety of biological systems. Examples include enzyme                               more, the error in estimating X is proportional to the
reaction rates as affected by temperature or pH, meta-                            degree of skewness and inversely related to the direc-
bolic rates or heart rates as affected by temperature,                            tion of skewness.
etc. It is often desirable to determine maximum states                               At the risk of sounding trivial, we propose a more
for the dependent variable, such conditions often char-                           precise method, which is seldom used despite its ele-
acterizing physiological optima: e.g. pH optima, tem-                             mentary nature. Ideally, one would like an estimate of
perature optima, thermal neutral point. Frequently,                               the variables at the point where the slope of the curve
the optimal level of the independent variable is esti-                            is zero. This requires one equation for the entire curve,
mated from the intersection of two straight lines (Fig.                           and some means of locating points where the slope is
1). These lines are derived by least squares regression                           zero. The ready availability of computers now allows
analysis on data above and below the optimal level.                               for practical calculation of least squares polynomial
However, the shape of the curvilinear function affects                            regression lines of the form
the accuracy of the estimate. Error in the estimate of
Y is proportional to the difference between the slopes                                                ~'i=a+  Z bjXi
of the two straight lines, and produces overestimates                                                        j=t
                                                                                  where j is any exponent from I to m (Zar, 1974:
      I00                                                                         269). Procedures for fitting polynomial curves to
                                                                                  data are available from several standard biostatistics
                                                                                  texts (Steel & Torrie, 1960; Sokol & Rohlf, 1969;
                                                                                  and Zar, 1974); confidence limits are discussed by
 .E   90                                                                          Bliss (1970). The first derivative of a polynomial
  E                                                                               regression line is set equal to zero, using the equa-
                                                                                  tion:
 o
 o                                                                                                 dY/dX = 0 = Z (bj)(j)tX~-')
      80                                                                                                        j=l
                                                                                  Solved for X, the roots of this equation are the values
                                                                                  at which the slope is zero. However, not all will be
fie                                                                               optima, and visual inspection of the graph is needed to
      70                                                                          identify important values.
                                                                                     As an example (Fig. 1), we recently collected data on
                                                                                  heart beat rate (R in beats/min) of 18 college-aged men
-r-                                                                               and women at 5, 15, 25, 35 and 40°C ambient tempera-
      60                   i       /       i               I              I       tures (T). The second order regression line which best
            0        I0                  20      30     40                        describes the relationship of heart beat rate to ambient
                 Ambient               Temperolure ('C)                           temperature is:
Fig. 1. Linear and polynomial regression lines describing                                         R = 93.76 - 1.89 T + 0-04 T 2
heart beat rate of humans at different temperatures. Dashed
lines illustrate how optimum temperature is estimated with                          The first derivative of this equation is:
intersecting straight lines. Solid curve represents polynomial
                         regression line.                                                           dR/dT = - 1-89 + 0.08 T
                                                                               19
20                        EUGENE H. STUDIER, RICHARD W. DAPSON AND ROGER E. BIGELOW


           O.lO                                                 ima apparent, a n d polynomial regression analysis is
                                                                the only practical way to estimate their values. The
                                                                equation is:
      t.
           0.08                                                 Y = - 2 3 . 5 6 8 9 + 11.7874X - 2-1942X 2
                                                                                                + 0"1808X 3 - 0'0056X*
     c                                                          a n d its first derivative is:
     .2 0 . 0 6

                                                                dY/dX = 11.7874 - 4.3885X + 0'5423X 2 - 0"0222X 3
           0.04                                                 Solving for X when dY/dX = 0 produces three real
     0
                                                                roots corresponding to the p H values at which the
     g                                                          slope is zero: 7'2, 8'2 a n d 9-0. The first a n d last values
     ~-~0.02                                                    represent maxima. The polynomial equation can now
     0                                                          be solved with these X values to give corresponding
                                                                metabolic rates: 0.076 a n d 0'075 cc/hr at p H 7.2 a n d
           O.OC       I          I        I          I
                                                                9.0 respectively.
                  6   7         8         9         I0
                                 pH                               Acknowledgement--We thank Dr. Jerrold H. Zar for his
                                                                comments on an earlier draft of this paper.
Fig. 2. Oxygen consumption in snails as a function of pH.
For each pH value studied, mean oxygen comsumption _+2
               standard errors are shown.
                                                                                         REFERENCES

W h e n dR/dT equals zero, T = 23.6°C. The corre-               BLISS C. I. (1970) Statistics in Biology, Vol. II, p 639.
sponding value of heart beat rate, derived from the               McGraw-Hill, New York.
regression equation, is 71.5 beats/min. Solving two             SOKOL R. R. & ROHLF F. J. (1969) Biometry. W. H. Freeman,
straight line equations generated from the data at 5, 15          San Francisco. p 776.
a n d 25 ° a n d at 25, 35 a n d 40°C yields a n optimal T      STEEL R. G. D. & TORRm J. H. (1960) Principles and pro-
value of 25"8°C at a n estimated m i n i m u m of 69.9 beats/     cedures of statistics. McGraw-Hill, New York. p 481.
min.                                                            ZAR J. H. 0974) Biostatistical Analysis. Prentice-Hall,
    A more complex case using higher order polynom-               Englewood Cliffs, N.J. p 620.
ials is shown in Fig. 2. Metabolic rate (cm a O2/hr ) of
snails (Viviparus contectoides) was measured at various            Key Word Index--Polynomial functions; optimum con-
p H values ranging from 6.1 to 10.1. There are two max-         ditions; heart rate; oxygen consumption.

More Related Content

What's hot

Lecture.3.regression.all
Lecture.3.regression.allLecture.3.regression.all
Lecture.3.regression.allKUBUKE JACKSON
 
A comparative analysis of predictve data mining techniques3
A comparative analysis of predictve data mining techniques3A comparative analysis of predictve data mining techniques3
A comparative analysis of predictve data mining techniques3Mintu246
 
Query optimization in database
Query optimization in databaseQuery optimization in database
Query optimization in databaseRakesh Kumar
 
Diagnostic methods for Building the regression model
Diagnostic methods for Building the regression modelDiagnostic methods for Building the regression model
Diagnostic methods for Building the regression modelMehdi Shayegani
 
Spectral divide-and-conquer algorithms for eigenvalue problems and the SVD
Spectral divide-and-conquer algorithms for eigenvalue problems and the SVDSpectral divide-and-conquer algorithms for eigenvalue problems and the SVD
Spectral divide-and-conquer algorithms for eigenvalue problems and the SVDyuji_nakatsukasa
 
Uji liliefors
Uji lilieforsUji liliefors
Uji lilieforsjojun
 
Boolean variables r010
Boolean variables   r010Boolean variables   r010
Boolean variables r010arunachalamr16
 
Impact of Linear Homogeneous Recurrent Relation Analysis
Impact of Linear Homogeneous Recurrent Relation AnalysisImpact of Linear Homogeneous Recurrent Relation Analysis
Impact of Linear Homogeneous Recurrent Relation Analysisijtsrd
 

What's hot (12)

Lecture.3.regression.all
Lecture.3.regression.allLecture.3.regression.all
Lecture.3.regression.all
 
A comparative analysis of predictve data mining techniques3
A comparative analysis of predictve data mining techniques3A comparative analysis of predictve data mining techniques3
A comparative analysis of predictve data mining techniques3
 
2018 Modern Math Workshop - Contact Invariants and Reeb Dynamics - Jo Nelson,...
2018 Modern Math Workshop - Contact Invariants and Reeb Dynamics - Jo Nelson,...2018 Modern Math Workshop - Contact Invariants and Reeb Dynamics - Jo Nelson,...
2018 Modern Math Workshop - Contact Invariants and Reeb Dynamics - Jo Nelson,...
 
Query optimization in database
Query optimization in databaseQuery optimization in database
Query optimization in database
 
Diagnostic methods for Building the regression model
Diagnostic methods for Building the regression modelDiagnostic methods for Building the regression model
Diagnostic methods for Building the regression model
 
Spectral divide-and-conquer algorithms for eigenvalue problems and the SVD
Spectral divide-and-conquer algorithms for eigenvalue problems and the SVDSpectral divide-and-conquer algorithms for eigenvalue problems and the SVD
Spectral divide-and-conquer algorithms for eigenvalue problems and the SVD
 
paper
paperpaper
paper
 
Uji liliefors
Uji lilieforsUji liliefors
Uji liliefors
 
Presentation2 stats
Presentation2 statsPresentation2 stats
Presentation2 stats
 
Larson 4.3
Larson 4.3Larson 4.3
Larson 4.3
 
Boolean variables r010
Boolean variables   r010Boolean variables   r010
Boolean variables r010
 
Impact of Linear Homogeneous Recurrent Relation Analysis
Impact of Linear Homogeneous Recurrent Relation AnalysisImpact of Linear Homogeneous Recurrent Relation Analysis
Impact of Linear Homogeneous Recurrent Relation Analysis
 

Similar to DOC a a dsfzxgsdfzgx

Chapter 6 simple regression and correlation
Chapter 6 simple regression and correlationChapter 6 simple regression and correlation
Chapter 6 simple regression and correlationRione Drevale
 
REGRESSION ANALYSIS THEORY EXPLAINED HERE
REGRESSION ANALYSIS THEORY EXPLAINED HEREREGRESSION ANALYSIS THEORY EXPLAINED HERE
REGRESSION ANALYSIS THEORY EXPLAINED HEREShriramKargaonkar
 
Linear regression [Theory and Application (In physics point of view) using py...
Linear regression [Theory and Application (In physics point of view) using py...Linear regression [Theory and Application (In physics point of view) using py...
Linear regression [Theory and Application (In physics point of view) using py...ANIRBANMAJUMDAR18
 
Pearson product moment correlation
Pearson product moment correlationPearson product moment correlation
Pearson product moment correlationSharlaine Ruth
 
Correlation by Neeraj Bhandari ( Surkhet.Nepal )
Correlation by Neeraj Bhandari ( Surkhet.Nepal )Correlation by Neeraj Bhandari ( Surkhet.Nepal )
Correlation by Neeraj Bhandari ( Surkhet.Nepal )Neeraj Bhandari
 
Applied Numerical Methods Curve Fitting: Least Squares Regression, Interpolation
Applied Numerical Methods Curve Fitting: Least Squares Regression, InterpolationApplied Numerical Methods Curve Fitting: Least Squares Regression, Interpolation
Applied Numerical Methods Curve Fitting: Least Squares Regression, InterpolationBrian Erandio
 
Chapter 2 part3-Least-Squares Regression
Chapter 2 part3-Least-Squares RegressionChapter 2 part3-Least-Squares Regression
Chapter 2 part3-Least-Squares Regressionnszakir
 
Exact Sum Rules for Vector Channel at Finite Temperature and its Applications...
Exact Sum Rules for Vector Channel at Finite Temperature and its Applications...Exact Sum Rules for Vector Channel at Finite Temperature and its Applications...
Exact Sum Rules for Vector Channel at Finite Temperature and its Applications...Daisuke Satow
 
Born oppenheimer p1 7
Born oppenheimer p1 7Born oppenheimer p1 7
Born oppenheimer p1 7Lim Wei
 
PCB_Lect02_Pairwise_allign (1).pdf
PCB_Lect02_Pairwise_allign (1).pdfPCB_Lect02_Pairwise_allign (1).pdf
PCB_Lect02_Pairwise_allign (1).pdfssusera1eccd
 
great-150816134029-lva1-app6892.pdf
great-150816134029-lva1-app6892.pdfgreat-150816134029-lva1-app6892.pdf
great-150816134029-lva1-app6892.pdfCAishwarya4
 
Biostats coorelation vs rREGRESSION.DIFFERENCE BETWEEN CORRELATION AND REGRES...
Biostats coorelation vs rREGRESSION.DIFFERENCE BETWEEN CORRELATION AND REGRES...Biostats coorelation vs rREGRESSION.DIFFERENCE BETWEEN CORRELATION AND REGRES...
Biostats coorelation vs rREGRESSION.DIFFERENCE BETWEEN CORRELATION AND REGRES...Payaamvohra1
 
Application of Pi
Application of PiApplication of Pi
Application of Pimonil shah
 

Similar to DOC a a dsfzxgsdfzgx (20)

Chapter 6 simple regression and correlation
Chapter 6 simple regression and correlationChapter 6 simple regression and correlation
Chapter 6 simple regression and correlation
 
REGRESSION ANALYSIS THEORY EXPLAINED HERE
REGRESSION ANALYSIS THEORY EXPLAINED HEREREGRESSION ANALYSIS THEORY EXPLAINED HERE
REGRESSION ANALYSIS THEORY EXPLAINED HERE
 
Simple linear regressionn and Correlation
Simple linear regressionn and CorrelationSimple linear regressionn and Correlation
Simple linear regressionn and Correlation
 
Linear regression [Theory and Application (In physics point of view) using py...
Linear regression [Theory and Application (In physics point of view) using py...Linear regression [Theory and Application (In physics point of view) using py...
Linear regression [Theory and Application (In physics point of view) using py...
 
Pearson product moment correlation
Pearson product moment correlationPearson product moment correlation
Pearson product moment correlation
 
Chapter13
Chapter13Chapter13
Chapter13
 
Correlation by Neeraj Bhandari ( Surkhet.Nepal )
Correlation by Neeraj Bhandari ( Surkhet.Nepal )Correlation by Neeraj Bhandari ( Surkhet.Nepal )
Correlation by Neeraj Bhandari ( Surkhet.Nepal )
 
landau-zener-tunneling
landau-zener-tunnelinglandau-zener-tunneling
landau-zener-tunneling
 
Applied Numerical Methods Curve Fitting: Least Squares Regression, Interpolation
Applied Numerical Methods Curve Fitting: Least Squares Regression, InterpolationApplied Numerical Methods Curve Fitting: Least Squares Regression, Interpolation
Applied Numerical Methods Curve Fitting: Least Squares Regression, Interpolation
 
Correlation and Regression
Correlation and Regression Correlation and Regression
Correlation and Regression
 
Chapter 2 part3-Least-Squares Regression
Chapter 2 part3-Least-Squares RegressionChapter 2 part3-Least-Squares Regression
Chapter 2 part3-Least-Squares Regression
 
CLIM Fall 2017 Course: Statistics for Climate Research, Detection & Attributi...
CLIM Fall 2017 Course: Statistics for Climate Research, Detection & Attributi...CLIM Fall 2017 Course: Statistics for Climate Research, Detection & Attributi...
CLIM Fall 2017 Course: Statistics for Climate Research, Detection & Attributi...
 
M green
M greenM green
M green
 
Exact Sum Rules for Vector Channel at Finite Temperature and its Applications...
Exact Sum Rules for Vector Channel at Finite Temperature and its Applications...Exact Sum Rules for Vector Channel at Finite Temperature and its Applications...
Exact Sum Rules for Vector Channel at Finite Temperature and its Applications...
 
Born oppenheimer p1 7
Born oppenheimer p1 7Born oppenheimer p1 7
Born oppenheimer p1 7
 
ResearchPaper
ResearchPaperResearchPaper
ResearchPaper
 
PCB_Lect02_Pairwise_allign (1).pdf
PCB_Lect02_Pairwise_allign (1).pdfPCB_Lect02_Pairwise_allign (1).pdf
PCB_Lect02_Pairwise_allign (1).pdf
 
great-150816134029-lva1-app6892.pdf
great-150816134029-lva1-app6892.pdfgreat-150816134029-lva1-app6892.pdf
great-150816134029-lva1-app6892.pdf
 
Biostats coorelation vs rREGRESSION.DIFFERENCE BETWEEN CORRELATION AND REGRES...
Biostats coorelation vs rREGRESSION.DIFFERENCE BETWEEN CORRELATION AND REGRES...Biostats coorelation vs rREGRESSION.DIFFERENCE BETWEEN CORRELATION AND REGRES...
Biostats coorelation vs rREGRESSION.DIFFERENCE BETWEEN CORRELATION AND REGRES...
 
Application of Pi
Application of PiApplication of Pi
Application of Pi
 

More from robcar1986

knàlùòplùèà
knàlùòplùèàknàlùòplùèà
knàlùòplùèàrobcar1986
 
DOC a a dsfzxgsdfzgx
DOC  a a dsfzxgsdfzgxDOC  a a dsfzxgsdfzgx
DOC a a dsfzxgsdfzgxrobcar1986
 
DOC a a sedfgsdfg
DOC  a a  sedfgsdfgDOC  a a  sedfgsdfg
DOC a a sedfgsdfgrobcar1986
 
Bar e Ristoranti cazzi e mazzi Questo e' il titolo.
Bar e Ristoranti cazzi e mazzi Questo e' il titolo.Bar e Ristoranti cazzi e mazzi Questo e' il titolo.
Bar e Ristoranti cazzi e mazzi Questo e' il titolo.robcar1986
 
Bar e Ristoranti ..... Questo e' il titolo.
Bar e Ristoranti ..... Questo e' il titolo.Bar e Ristoranti ..... Questo e' il titolo.
Bar e Ristoranti ..... Questo e' il titolo.robcar1986
 
DOC Cubeyou Milano' presentazione
DOC  Cubeyou  Milano' presentazioneDOC  Cubeyou  Milano' presentazione
DOC Cubeyou Milano' presentazionerobcar1986
 
DOC Cubeyou Milano' La mia offerta
DOC  Cubeyou  Milano' La mia offertaDOC  Cubeyou  Milano' La mia offerta
DOC Cubeyou Milano' La mia offertarobcar1986
 
Giada profumeria
Giada profumeriaGiada profumeria
Giada profumeriarobcar1986
 
[intestazione] [titolo]
[intestazione] [titolo][intestazione] [titolo]
[intestazione] [titolo]robcar1986
 
intestazione CYOA
intestazione CYOAintestazione CYOA
intestazione CYOArobcar1986
 
null la mia presentazione
null la mia presentazionenull la mia presentazione
null la mia presentazionerobcar1986
 
fdt.getIntestazione()[non pronto]
fdt.getIntestazione()[non pronto]fdt.getIntestazione()[non pronto]
fdt.getIntestazione()[non pronto]robcar1986
 

More from robcar1986 (19)

sdfghjk
sdfghjksdfghjk
sdfghjk
 
knàlùòplùèà
knàlùòplùèàknàlùòplùèà
knàlùòplùèà
 
Presentation2
Presentation2Presentation2
Presentation2
 
DOC a a dsfzxgsdfzgx
DOC  a a dsfzxgsdfzgxDOC  a a dsfzxgsdfzgx
DOC a a dsfzxgsdfzgx
 
DOC a a sedfgsdfg
DOC  a a  sedfgsdfgDOC  a a  sedfgsdfg
DOC a a sedfgsdfg
 
DOC a a fede
DOC  a a fedeDOC  a a fede
DOC a a fede
 
DOC a a fede
DOC  a a fedeDOC  a a fede
DOC a a fede
 
Bar e Ristoranti cazzi e mazzi Questo e' il titolo.
Bar e Ristoranti cazzi e mazzi Questo e' il titolo.Bar e Ristoranti cazzi e mazzi Questo e' il titolo.
Bar e Ristoranti cazzi e mazzi Questo e' il titolo.
 
null cciacoa
null cciacoanull cciacoa
null cciacoa
 
Bar e Ristoranti ..... Questo e' il titolo.
Bar e Ristoranti ..... Questo e' il titolo.Bar e Ristoranti ..... Questo e' il titolo.
Bar e Ristoranti ..... Questo e' il titolo.
 
DOC Cubeyou Milano' presentazione
DOC  Cubeyou  Milano' presentazioneDOC  Cubeyou  Milano' presentazione
DOC Cubeyou Milano' presentazione
 
DOC Cubeyou Milano' La mia offerta
DOC  Cubeyou  Milano' La mia offertaDOC  Cubeyou  Milano' La mia offerta
DOC Cubeyou Milano' La mia offerta
 
Giada profumeria
Giada profumeriaGiada profumeria
Giada profumeria
 
null null
null nullnull null
null null
 
[intestazione] [titolo]
[intestazione] [titolo][intestazione] [titolo]
[intestazione] [titolo]
 
intestazione CYOA
intestazione CYOAintestazione CYOA
intestazione CYOA
 
null CYOA
null CYOAnull CYOA
null CYOA
 
null la mia presentazione
null la mia presentazionenull la mia presentazione
null la mia presentazione
 
fdt.getIntestazione()[non pronto]
fdt.getIntestazione()[non pronto]fdt.getIntestazione()[non pronto]
fdt.getIntestazione()[non pronto]
 

DOC a a dsfzxgsdfzgx

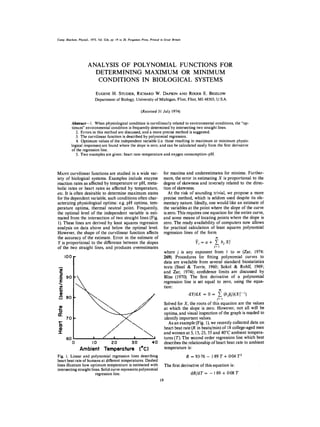
  • 1. Comp. Biochem. Physiol., 1975, Vol. 52A, pp, 19 to 20, Pergamon Press. Printed in Great Britain ANALYSIS OF POLYNOMIAL FUNCTIONS FOR DETERMINING MAXIMUM OR M I N I M U M CONDITIONS IN BIOLOGICAL SYSTEMS EUGENE H. STUDIER, RICHARD W. DAPSON AND ROGER E. BIGELOW Department of Biology, University of Michigan, Flint, Flint, MI 48503, U.S.A. (Received 31 July 1974) Abstract--1. When physiological condition is curvilinearly related to environmental conditions, the "op- timum" environmental condition is frequently determined by intersecting two straight lines. 2. Errors in this method are discussed, and a more precise method is suggested. 3. The curvilinear function is described by polynomial regression. 4. Optimum values of the independent variable (i.e. those resulting in maximum or minimum physio- logical responses) are found where the slope is zero, and can be calculated easily from the first derivative of the regression line. 5. Two examples are given: heart rate-temperature and oxygen consumption-pH. MANY curvilinear functions are studied in a wide var- for maxima and underestimates for minima. Further- iety of biological systems. Examples include enzyme more, the error in estimating X is proportional to the reaction rates as affected by temperature or pH, meta- degree of skewness and inversely related to the direc- bolic rates or heart rates as affected by temperature, tion of skewness. etc. It is often desirable to determine maximum states At the risk of sounding trivial, we propose a more for the dependent variable, such conditions often char- precise method, which is seldom used despite its ele- acterizing physiological optima: e.g. pH optima, tem- mentary nature. Ideally, one would like an estimate of perature optima, thermal neutral point. Frequently, the variables at the point where the slope of the curve the optimal level of the independent variable is esti- is zero. This requires one equation for the entire curve, mated from the intersection of two straight lines (Fig. and some means of locating points where the slope is 1). These lines are derived by least squares regression zero. The ready availability of computers now allows analysis on data above and below the optimal level. for practical calculation of least squares polynomial However, the shape of the curvilinear function affects regression lines of the form the accuracy of the estimate. Error in the estimate of Y is proportional to the difference between the slopes ~'i=a+ Z bjXi of the two straight lines, and produces overestimates j=t where j is any exponent from I to m (Zar, 1974: I00 269). Procedures for fitting polynomial curves to data are available from several standard biostatistics texts (Steel & Torrie, 1960; Sokol & Rohlf, 1969; and Zar, 1974); confidence limits are discussed by .E 90 Bliss (1970). The first derivative of a polynomial E regression line is set equal to zero, using the equa- tion: o o dY/dX = 0 = Z (bj)(j)tX~-') 80 j=l Solved for X, the roots of this equation are the values at which the slope is zero. However, not all will be fie optima, and visual inspection of the graph is needed to 70 identify important values. As an example (Fig. 1), we recently collected data on heart beat rate (R in beats/min) of 18 college-aged men -r- and women at 5, 15, 25, 35 and 40°C ambient tempera- 60 i / i I I tures (T). The second order regression line which best 0 I0 20 30 40 describes the relationship of heart beat rate to ambient Ambient Temperolure ('C) temperature is: Fig. 1. Linear and polynomial regression lines describing R = 93.76 - 1.89 T + 0-04 T 2 heart beat rate of humans at different temperatures. Dashed lines illustrate how optimum temperature is estimated with The first derivative of this equation is: intersecting straight lines. Solid curve represents polynomial regression line. dR/dT = - 1-89 + 0.08 T 19
  • 2. 20 EUGENE H. STUDIER, RICHARD W. DAPSON AND ROGER E. BIGELOW O.lO ima apparent, a n d polynomial regression analysis is the only practical way to estimate their values. The equation is: t. 0.08 Y = - 2 3 . 5 6 8 9 + 11.7874X - 2-1942X 2 + 0"1808X 3 - 0'0056X* c a n d its first derivative is: .2 0 . 0 6 dY/dX = 11.7874 - 4.3885X + 0'5423X 2 - 0"0222X 3 0.04 Solving for X when dY/dX = 0 produces three real 0 roots corresponding to the p H values at which the g slope is zero: 7'2, 8'2 a n d 9-0. The first a n d last values ~-~0.02 represent maxima. The polynomial equation can now 0 be solved with these X values to give corresponding metabolic rates: 0.076 a n d 0'075 cc/hr at p H 7.2 a n d O.OC I I I I 9.0 respectively. 6 7 8 9 I0 pH Acknowledgement--We thank Dr. Jerrold H. Zar for his comments on an earlier draft of this paper. Fig. 2. Oxygen consumption in snails as a function of pH. For each pH value studied, mean oxygen comsumption _+2 standard errors are shown. REFERENCES W h e n dR/dT equals zero, T = 23.6°C. The corre- BLISS C. I. (1970) Statistics in Biology, Vol. II, p 639. sponding value of heart beat rate, derived from the McGraw-Hill, New York. regression equation, is 71.5 beats/min. Solving two SOKOL R. R. & ROHLF F. J. (1969) Biometry. W. H. Freeman, straight line equations generated from the data at 5, 15 San Francisco. p 776. a n d 25 ° a n d at 25, 35 a n d 40°C yields a n optimal T STEEL R. G. D. & TORRm J. H. (1960) Principles and pro- value of 25"8°C at a n estimated m i n i m u m of 69.9 beats/ cedures of statistics. McGraw-Hill, New York. p 481. min. ZAR J. H. 0974) Biostatistical Analysis. Prentice-Hall, A more complex case using higher order polynom- Englewood Cliffs, N.J. p 620. ials is shown in Fig. 2. Metabolic rate (cm a O2/hr ) of snails (Viviparus contectoides) was measured at various Key Word Index--Polynomial functions; optimum con- p H values ranging from 6.1 to 10.1. There are two max- ditions; heart rate; oxygen consumption.