Download to read offline
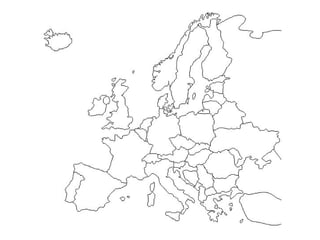


The document outlines 7 tasks related to analyzing population data and maps of European countries: 1) Shading countries on a map based on membership in economic alliance A8, 2) Completing a line graph showing world population growth by region, 3) Shading areas on a diagram to indicate natural increase/decrease and migration trends, 4) Creating lists ranking countries by total population change and life expectancy, 5) Highlighting key terms in italics and making a list, 6) Constructing a percentage bar graph from data, and 7) Annotating diagrams with two colors to identify impacts and solutions.


