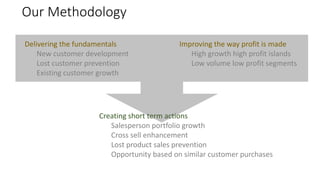
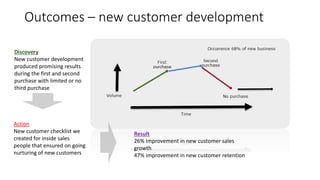
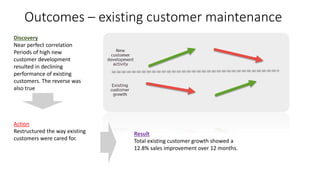
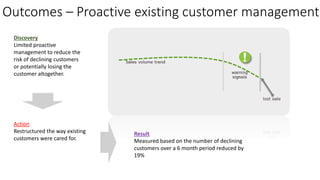
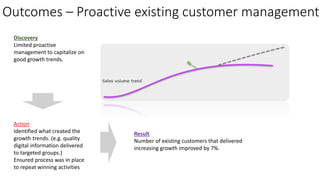
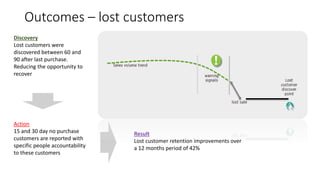
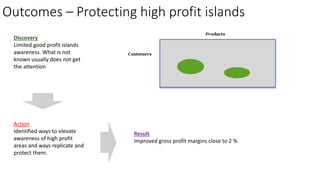
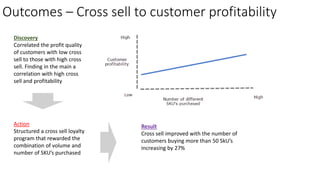
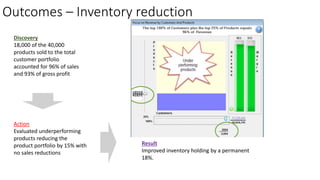
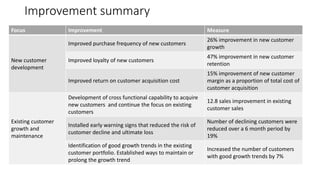
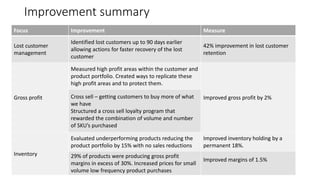
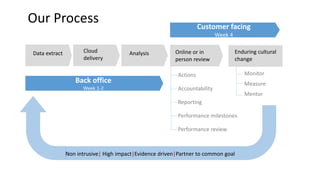
Distribution Sales Growth 
Story 
How 10% sales growth was created 
โ€œwith improved margins and reduced inventoriesโ€ 
Contact: Andre Gien agien@gfbridge.com 925 323 2802 www.gfbridge.com
We use known facts to grow 
sales in distribution companies
The challenge 
๏ถ 40,000 active products 
๏ถ 25 sales people 
๏ถ 1,800 active customers 
๏ถ 9 branch locations 
Behind the scene 
The business had no real burning platform. 
Sales were improving although below expectation. 
Operating profit was stagnant possibly in slight 
decline. 
Inconsistent operating cash flow 
Management was of the opinion that everything that 
could be done had been done or is being done. 
The last thing they wanted was a data driven coach 
to identify and guide growth.
New 
customer 
development 
Portfolio scorecard 
Existing 
customer 
growth and 
maintenance 
Lost customer 
management 
Gross profit Inventory Sales 
people 
Pipeline 
Prospect 
engagement 
Purchase 
frequency 
- Loyalty 
- Growth 
trends 
Customer 
retention 
- Profit islands 
- Cross sell 
performance 
payments 
Retention 
Non relevant SKUโ€™s 
Low performing vendors 
Acquisition cost Risk of decline Customer deflection
Our brief 
๏ฑ We are busy 
๏ฑ We want this to be fully self funding 
๏ฑ We donโ€™t want to learn new technologies 
๏ฑ We want a sales improvement of 5%-10% 
๏ฑ We want the process to form part of our monthly 
sales meeting with no further disruption 
๏ฑ We want the option that individual sales people 
can use your services to improve their sales 
๏ฑ We want immediate actionable tactics that will 
increase sales through 
๏ฑ Opportunity identification 
๏ฑ Risk reduction 
๏ฑ We want all recommendation to be supported by 
evidence 
๏ฑ We donโ€™t want some theoretical 
exercise 
๏ฑ We want minimal disruption 
๏ฑ We want to improve our free cash 
flow 
๏ฑ We feel our measures and 
disciplines could improve 
๏ฑ We want our sales people to be 
more strategic 
Stated 
Not stated
Starting place 
Where are we growing 
Where are we making money 
What are the immediate opportunities
Our Methodology 
Improving the way profit is made 
High growth high profit islands 
Low volume low profit segments 
Delivering the fundamentals 
New customer development 
Lost customer prevention 
Existing customer growth 
Creating short term actions 
Salesperson portfolio growth 
Cross sell enhancement 
Lost product sales prevention 
Opportunity based on similar customer purchases
Service delivery 
Online monthly meetings with sales VP 
Reporting structure 
Previous month performance assessment 
New risk assessment 
Delivering growth actions 
โ€ข Global growth actions 
โ€ข Salesperson individual growth actions 
โ€ข Product portfolio growth action 
Assessment of performance against previous actions
Outcomes โ€“ new customer development 
Discovery 
New customer development 
produced promising results 
during the first and second 
purchase with limited or no 
third purchase 
Action 
New customer checklist we 
created for inside sales 
people that ensured on going 
nurturing of new customers 
Result 
26% improvement in new customer sales 
growth 
47% improvement in new customer retention
Outcomes โ€“ existing customer maintenance 
Discovery 
Near perfect correlation 
Periods of high new 
customer development 
resulted in declining 
performance of existing 
customers. The reverse was 
also true 
Action 
Restructured the way existing 
customers were cared for. 
Result 
Total existing customer growth showed a 
12.8% sales improvement over 12 months.
Outcomes โ€“ Proactive existing customer management 
Discovery 
Limited proactive 
management to reduce the 
risk of declining customers 
or potentially losing the 
customer altogether. 
Action 
Restructured the way existing 
customers were cared for. 
Result 
Measured based on the number of declining 
customers over a 6 month period reduced by 
19%
Outcomes โ€“ Proactive existing customer management 
Discovery 
Limited proactive 
management to capitalize on 
good growth trends. 
Action 
Identified what created the 
growth trends. (e.g. quality 
digital information delivered 
to targeted groups.) 
Ensured process was in place 
to repeat winning activities 
Result 
Number of existing customers that delivered 
increasing growth improved by 7%.
Outcomes โ€“ lost customers 
Discovery 
Lost customers were 
discovered between 60 and 
90 after last purchase. 
Reducing the opportunity to 
recover 
Action 
15 and 30 day no purchase 
customers are reported with 
specific people accountability 
to these customers 
Result 
Lost customer retention improvements over 
a 12 months period of 42%
Outcomes โ€“ Protecting high profit islands 
Discovery 
Limited good profit islands 
awareness. What is not 
known usually does not get 
the attention 
Action 
Identified ways to elevate 
awareness of high profit 
areas and ways replicate and 
protect them. 
Result 
Improved gross profit margins close to 2 %
Outcomes โ€“ Cross sell to customer profitability 
Discovery 
Correlated the profit quality 
of customers with low cross 
sell to those with high cross 
sell. Finding in the main a 
correlation with high cross 
sell and profitability 
Action 
Structured a cross sell loyalty 
program that rewarded the 
combination of volume and 
number of SKUโ€™s purchased 
Result 
Cross sell improved with the number of 
customers buying more than 50 SkUโ€™s 
increasing by 27%
Outcomes โ€“ Inventory reduction 
Discovery 
18,000 of the 40,000 
products sold to the total 
customer portfolio 
accounted for 96% of sales 
and 93% of gross profit 
Action 
Evaluated underperforming 
products reducing the 
product portfolio by 15% with 
no sales reductions 
Result 
Improved inventory holding by a permanent 
18%.
Outcomes โ€“ product profitability 
Discovery 
29% of products were 
producing gross profit 
margins in excess of 30% 
Action 
Increased prices for small 
volume low frequency 
product purchases Result 
Improved margins of 1.5%
Outcomes โ€“ product profitability 
Discovery 
Pipeline activity was focused identifying 
the prospect and attempting to convert 
the prospect into a sale 
Action 
Created prospect awareness, 
interest and desire tactics to 
assist in the conversion 
processes. 
Result 
Initiated a goal and measurement based on 
the number of potential customers engaging 
other than on price or quote basis.
Improvement summary 
Focus Improvement Measure 
New customer 
development 
Improved purchase frequency of new customers 
26% improvement in new customer 
growth 
Improved loyalty of new customers 
47% improvement in new customer 
retention 
Improved return on customer acquisition cost 
15% improvement of new customer 
margin as a proportion of total cost of 
customer acquisition 
Existing customer 
growth and 
maintenance 
Development of cross functional capability to acquire 
new customers and continue the focus on existing 
customers 
12.8 sales improvement in existing 
customer sales 
Installed early warning signs that reduced the risk of 
customer decline and ultimate loss 
Number of declining customers were 
reduced over a 6 month period by 
19% 
Identification of good growth trends in the existing 
customer portfolio. Established ways to maintain or 
prolong the growth trend 
Increased the number of customers 
with good growth trends by 7%
Improvement summary 
Focus Improvement Measure 
Lost customer 
management 
Identified lost customers up to 90 days earlier 
allowing actions for faster recovery of the lost 
customer 
42% improvement in lost customer 
retention 
Gross profit 
Measured high profit areas within the customer and 
product portfolio. Created ways to replicate these 
high profit areas and to protect them. 
Cross sell โ€“ getting customers to buy more of what Improved gross profit by 2% 
we have 
Structured a cross sell loyalty program that 
rewarded the combination of volume and number 
of SKUโ€™s purchased 
Inventory 
Evaluated underperforming products reducing the 
product portfolio by 15% with no sales reductions 
Improved inventory holding by a 
permanent 18%. 
29% of products were producing gross profit 
margins in excess of 30%. Increased prices for small 
volume low frequency product purchases 
Improved margins of 1.5%
Data extract Cloud 
delivery 
Analysis 
Online or in 
person review 
Actions 
Accountability 
Reporting 
Enduring cultural 
change 
Performance milestones 
Performance review 
Monitor 
Measure 
Mentor 
Back office 
Week 1-2 
Customer facing 
Week 4 
Our Process 
Non intrusive| High impact|Evidence driven|Partner to common goal
Contact 
Andre Gien 
agien@gfbridge.com 
925 323 2802 
Andre is our Evidence Wizard. He combines the Passion of intuition 
with the Power of Evidence to weave amazing stories that reveal the 
secrets and treasures that are locked within your business. 
He has deployed the evidence based management discipline in over 
150 different companies releasing more than $500 million in value 
and more importantly, demystifying the complexity for thousands of 
people. 
Andre's favorite quote: 
"If you change the way you look at things, the 
things you look at change"

Distribution sales growth story

  • 1.
    Distribution Sales Growth Story How 10% sales growth was created โ€œwith improved margins and reduced inventoriesโ€ Contact: Andre Gien agien@gfbridge.com 925 323 2802 www.gfbridge.com
  • 2.
    We use knownfacts to grow sales in distribution companies
  • 3.
    The challenge ๏ถ40,000 active products ๏ถ 25 sales people ๏ถ 1,800 active customers ๏ถ 9 branch locations Behind the scene The business had no real burning platform. Sales were improving although below expectation. Operating profit was stagnant possibly in slight decline. Inconsistent operating cash flow Management was of the opinion that everything that could be done had been done or is being done. The last thing they wanted was a data driven coach to identify and guide growth.
  • 4.
    New customer development Portfolio scorecard Existing customer growth and maintenance Lost customer management Gross profit Inventory Sales people Pipeline Prospect engagement Purchase frequency - Loyalty - Growth trends Customer retention - Profit islands - Cross sell performance payments Retention Non relevant SKUโ€™s Low performing vendors Acquisition cost Risk of decline Customer deflection
  • 5.
    Our brief ๏ฑWe are busy ๏ฑ We want this to be fully self funding ๏ฑ We donโ€™t want to learn new technologies ๏ฑ We want a sales improvement of 5%-10% ๏ฑ We want the process to form part of our monthly sales meeting with no further disruption ๏ฑ We want the option that individual sales people can use your services to improve their sales ๏ฑ We want immediate actionable tactics that will increase sales through ๏ฑ Opportunity identification ๏ฑ Risk reduction ๏ฑ We want all recommendation to be supported by evidence ๏ฑ We donโ€™t want some theoretical exercise ๏ฑ We want minimal disruption ๏ฑ We want to improve our free cash flow ๏ฑ We feel our measures and disciplines could improve ๏ฑ We want our sales people to be more strategic Stated Not stated
  • 6.
    Starting place Whereare we growing Where are we making money What are the immediate opportunities
  • 7.
    Our Methodology Improvingthe way profit is made High growth high profit islands Low volume low profit segments Delivering the fundamentals New customer development Lost customer prevention Existing customer growth Creating short term actions Salesperson portfolio growth Cross sell enhancement Lost product sales prevention Opportunity based on similar customer purchases
  • 8.
    Service delivery Onlinemonthly meetings with sales VP Reporting structure Previous month performance assessment New risk assessment Delivering growth actions โ€ข Global growth actions โ€ข Salesperson individual growth actions โ€ข Product portfolio growth action Assessment of performance against previous actions
  • 9.
    Outcomes โ€“ newcustomer development Discovery New customer development produced promising results during the first and second purchase with limited or no third purchase Action New customer checklist we created for inside sales people that ensured on going nurturing of new customers Result 26% improvement in new customer sales growth 47% improvement in new customer retention
  • 10.
    Outcomes โ€“ existingcustomer maintenance Discovery Near perfect correlation Periods of high new customer development resulted in declining performance of existing customers. The reverse was also true Action Restructured the way existing customers were cared for. Result Total existing customer growth showed a 12.8% sales improvement over 12 months.
  • 11.
    Outcomes โ€“ Proactiveexisting customer management Discovery Limited proactive management to reduce the risk of declining customers or potentially losing the customer altogether. Action Restructured the way existing customers were cared for. Result Measured based on the number of declining customers over a 6 month period reduced by 19%
  • 12.
    Outcomes โ€“ Proactiveexisting customer management Discovery Limited proactive management to capitalize on good growth trends. Action Identified what created the growth trends. (e.g. quality digital information delivered to targeted groups.) Ensured process was in place to repeat winning activities Result Number of existing customers that delivered increasing growth improved by 7%.
  • 13.
    Outcomes โ€“ lostcustomers Discovery Lost customers were discovered between 60 and 90 after last purchase. Reducing the opportunity to recover Action 15 and 30 day no purchase customers are reported with specific people accountability to these customers Result Lost customer retention improvements over a 12 months period of 42%
  • 14.
    Outcomes โ€“ Protectinghigh profit islands Discovery Limited good profit islands awareness. What is not known usually does not get the attention Action Identified ways to elevate awareness of high profit areas and ways replicate and protect them. Result Improved gross profit margins close to 2 %
  • 15.
    Outcomes โ€“ Crosssell to customer profitability Discovery Correlated the profit quality of customers with low cross sell to those with high cross sell. Finding in the main a correlation with high cross sell and profitability Action Structured a cross sell loyalty program that rewarded the combination of volume and number of SKUโ€™s purchased Result Cross sell improved with the number of customers buying more than 50 SkUโ€™s increasing by 27%
  • 16.
    Outcomes โ€“ Inventoryreduction Discovery 18,000 of the 40,000 products sold to the total customer portfolio accounted for 96% of sales and 93% of gross profit Action Evaluated underperforming products reducing the product portfolio by 15% with no sales reductions Result Improved inventory holding by a permanent 18%.
  • 17.
    Outcomes โ€“ productprofitability Discovery 29% of products were producing gross profit margins in excess of 30% Action Increased prices for small volume low frequency product purchases Result Improved margins of 1.5%
  • 18.
    Outcomes โ€“ productprofitability Discovery Pipeline activity was focused identifying the prospect and attempting to convert the prospect into a sale Action Created prospect awareness, interest and desire tactics to assist in the conversion processes. Result Initiated a goal and measurement based on the number of potential customers engaging other than on price or quote basis.
  • 19.
    Improvement summary FocusImprovement Measure New customer development Improved purchase frequency of new customers 26% improvement in new customer growth Improved loyalty of new customers 47% improvement in new customer retention Improved return on customer acquisition cost 15% improvement of new customer margin as a proportion of total cost of customer acquisition Existing customer growth and maintenance Development of cross functional capability to acquire new customers and continue the focus on existing customers 12.8 sales improvement in existing customer sales Installed early warning signs that reduced the risk of customer decline and ultimate loss Number of declining customers were reduced over a 6 month period by 19% Identification of good growth trends in the existing customer portfolio. Established ways to maintain or prolong the growth trend Increased the number of customers with good growth trends by 7%
  • 20.
    Improvement summary FocusImprovement Measure Lost customer management Identified lost customers up to 90 days earlier allowing actions for faster recovery of the lost customer 42% improvement in lost customer retention Gross profit Measured high profit areas within the customer and product portfolio. Created ways to replicate these high profit areas and to protect them. Cross sell โ€“ getting customers to buy more of what Improved gross profit by 2% we have Structured a cross sell loyalty program that rewarded the combination of volume and number of SKUโ€™s purchased Inventory Evaluated underperforming products reducing the product portfolio by 15% with no sales reductions Improved inventory holding by a permanent 18%. 29% of products were producing gross profit margins in excess of 30%. Increased prices for small volume low frequency product purchases Improved margins of 1.5%
  • 21.
    Data extract Cloud delivery Analysis Online or in person review Actions Accountability Reporting Enduring cultural change Performance milestones Performance review Monitor Measure Mentor Back office Week 1-2 Customer facing Week 4 Our Process Non intrusive| High impact|Evidence driven|Partner to common goal
  • 22.
    Contact Andre Gien agien@gfbridge.com 925 323 2802 Andre is our Evidence Wizard. He combines the Passion of intuition with the Power of Evidence to weave amazing stories that reveal the secrets and treasures that are locked within your business. He has deployed the evidence based management discipline in over 150 different companies releasing more than $500 million in value and more importantly, demystifying the complexity for thousands of people. Andre's favorite quote: "If you change the way you look at things, the things you look at change"

Editor's Notes

  • #20ย Reduced sales person turn over Commission