Download free for 30 days
Sign in
Upload
Language (EN)
Support
Business
Mobile
Social Media
Marketing
Technology
Art & Photos
Career
Design
Education
Presentations & Public Speaking
Government & Nonprofit
Healthcare
Internet
Law
Leadership & Management
Automotive
Engineering
Software
Recruiting & HR
Retail
Sales
Services
Science
Small Business & Entrepreneurship
Food
Environment
Economy & Finance
Data & Analytics
Investor Relations
Sports
Spiritual
News & Politics
Travel
Self Improvement
Real Estate
Entertainment & Humor
Health & Medicine
Devices & Hardware
Lifestyle
Change Language
Language
English
Español
Português
Français
Deutsche
Cancel
Save
Submit search
EN
Uploaded by
IRJET Journal
3 views
Disease Prediction System using Machine Learning
https://www.irjet.net/archives/V9/i3/IRJET-V9I3387.pdf
Engineering
◦
Read more
0
Save
Share
Embed
Embed presentation
Download
Download to read offline
1
/ 5
2
/ 5
3
/ 5
4
/ 5
5
/ 5
More Related Content
PDF
Enhanced heart disease prediction using SKNDGR ensemble Machine Learning Model
by
IRJET Journal
PDF
Kiona – A Smart Society Automation Project
by
IRJET Journal
PDF
Invest in Innovation: Empowering Ideas through Blockchain Based Crowdfunding
by
IRJET Journal
PDF
Wireless Arduino Control via Mobile: Eliminating the Need for a Dedicated Wir...
by
IRJET Journal
PDF
SPACE WATCH YOUR REAL-TIME SPACE INFORMATION HUB
by
IRJET Journal
PDF
DESIGN AND DEVELOPMENT OF BATTERY THERMAL MANAGEMENT SYSTEM USING PHASE CHANG...
by
IRJET Journal
PDF
Utilizing Biomedical Waste for Sustainable Brick Manufacturing: A Novel Appro...
by
IRJET Journal
PDF
A Review on Influence of Fluid Viscous Damper on The Behaviour of Multi-store...
by
IRJET Journal
Enhanced heart disease prediction using SKNDGR ensemble Machine Learning Model
by
IRJET Journal
Kiona – A Smart Society Automation Project
by
IRJET Journal
Invest in Innovation: Empowering Ideas through Blockchain Based Crowdfunding
by
IRJET Journal
Wireless Arduino Control via Mobile: Eliminating the Need for a Dedicated Wir...
by
IRJET Journal
SPACE WATCH YOUR REAL-TIME SPACE INFORMATION HUB
by
IRJET Journal
DESIGN AND DEVELOPMENT OF BATTERY THERMAL MANAGEMENT SYSTEM USING PHASE CHANG...
by
IRJET Journal
Utilizing Biomedical Waste for Sustainable Brick Manufacturing: A Novel Appro...
by
IRJET Journal
A Review on Influence of Fluid Viscous Damper on The Behaviour of Multi-store...
by
IRJET Journal
More from IRJET Journal
PDF
Breast Cancer Detection using Computer Vision
by
IRJET Journal
PDF
BRAIN TUMOUR DETECTION AND CLASSIFICATION
by
IRJET Journal
PDF
Explainable AI(XAI) using LIME and Disease Detection in Mango Leaf by Transfe...
by
IRJET Journal
PDF
A Novel System for Recommending Agricultural Crops Using Machine Learning App...
by
IRJET Journal
PDF
Utilizing Biomedical Waste for Sustainable Brick Manufacturing: A Novel Appro...
by
IRJET Journal
PDF
Kiona – A Smart Society Automation Project
by
IRJET Journal
PDF
Auto-Charging E-Vehicle with its battery Management.
by
IRJET Journal
PDF
Analysis of high energy charge particle in the Heliosphere
by
IRJET Journal
PDF
Auto-Charging E-Vehicle with its battery Management.
by
IRJET Journal
PDF
Advancements in CFD Analysis of Shell and Tube Heat Exchangers with Nanofluid...
by
IRJET Journal
PDF
DESIGN AND DEVELOPMENT OF BATTERY THERMAL MANAGEMENT SYSTEM USING PHASE CHANG...
by
IRJET Journal
PDF
The Project Manager as an ambassador of the contract. The case of NEC4 ECC co...
by
IRJET Journal
PDF
Wireless Arduino Control via Mobile: Eliminating the Need for a Dedicated Wir...
by
IRJET Journal
PDF
FIR filter-based Sample Rate Convertors and its use in NR PRACH
by
IRJET Journal
PDF
Invest in Innovation: Empowering Ideas through Blockchain Based Crowdfunding
by
IRJET Journal
PDF
SPACE WATCH YOUR REAL-TIME SPACE INFORMATION HUB
by
IRJET Journal
PDF
AR Application: Homewise VisionMs. Vaishali Rane, Om Awadhoot, Bhargav Gajare...
by
IRJET Journal
PDF
Analysis of high energy charge particle in the Heliosphere
by
IRJET Journal
PDF
A Review on Influence of Fluid Viscous Damper on The Behaviour of Multi-store...
by
IRJET Journal
PDF
"Enhanced Heat Transfer Performance in Shell and Tube Heat Exchangers: A CFD ...
by
IRJET Journal
Breast Cancer Detection using Computer Vision
by
IRJET Journal
BRAIN TUMOUR DETECTION AND CLASSIFICATION
by
IRJET Journal
Explainable AI(XAI) using LIME and Disease Detection in Mango Leaf by Transfe...
by
IRJET Journal
A Novel System for Recommending Agricultural Crops Using Machine Learning App...
by
IRJET Journal
Utilizing Biomedical Waste for Sustainable Brick Manufacturing: A Novel Appro...
by
IRJET Journal
Kiona – A Smart Society Automation Project
by
IRJET Journal
Auto-Charging E-Vehicle with its battery Management.
by
IRJET Journal
Analysis of high energy charge particle in the Heliosphere
by
IRJET Journal
Auto-Charging E-Vehicle with its battery Management.
by
IRJET Journal
Advancements in CFD Analysis of Shell and Tube Heat Exchangers with Nanofluid...
by
IRJET Journal
DESIGN AND DEVELOPMENT OF BATTERY THERMAL MANAGEMENT SYSTEM USING PHASE CHANG...
by
IRJET Journal
The Project Manager as an ambassador of the contract. The case of NEC4 ECC co...
by
IRJET Journal
Wireless Arduino Control via Mobile: Eliminating the Need for a Dedicated Wir...
by
IRJET Journal
FIR filter-based Sample Rate Convertors and its use in NR PRACH
by
IRJET Journal
Invest in Innovation: Empowering Ideas through Blockchain Based Crowdfunding
by
IRJET Journal
SPACE WATCH YOUR REAL-TIME SPACE INFORMATION HUB
by
IRJET Journal
AR Application: Homewise VisionMs. Vaishali Rane, Om Awadhoot, Bhargav Gajare...
by
IRJET Journal
Analysis of high energy charge particle in the Heliosphere
by
IRJET Journal
A Review on Influence of Fluid Viscous Damper on The Behaviour of Multi-store...
by
IRJET Journal
"Enhanced Heat Transfer Performance in Shell and Tube Heat Exchangers: A CFD ...
by
IRJET Journal
Disease Prediction System using Machine Learning
1.
International Research Journal
of Engineering and Technology (IRJET) e-ISSN: 2395-0056 Volume: 09 Issue: 03 | Mar 2022 www.irjet.net p-ISSN: 2395-0072 © 2022, IRJET | Impact Factor value: 7.529 | ISO 9001:2008 Certified Journal | Page 2147 Disease Prediction System using Machine Learning Dhiraj Parikarma Gupta1, Bhavin Kishin Fatnani2 1Undergraduate student, Thadomal Shahani Engineering College, Mumbai, India 2 Undergraduate student, Thadomal Shahani Engineering College, Mumbai, India ---------------------------------------------------------------------***--------------------------------------------------------------------- Abstract - With the change in lifestyle of people, chronic diseases have become very common. And as peoplearegetting exposed to internet and gadgets, a large amount of data associated with their health is generated each day. With the evolution of machine learning algorithm this data canbe used to monitor the health and wellbeing of people. With this research we aim at providing a complete solution to assist people in avoiding any future health complications. Proposed model uses machine learning algorithms to predict the possibility of diseases namely Diabetes, Heart disease, Kidney disease, Liver disease and Cancer. Proposed model alsohelp to find the nearest medical facilities and maintainhealthrecords of patients. We ran various algorithms on each dataset and determined that Random Forest was the most accurate for Diabetes, with a score of 77.21%. Logistic regression performed the best for heart disease, withanaccuracyscoreof 90.25%. Similarly, Random Forest gave a recall score of 97% for liver disease, and Decision Tree proved to be the best for cancer with 98.62%. Random Forest provided an accuracy score of 96.45% for kidney disease. Key Words: Chronic disease, Machine learning, Decision Tree Classifier, KNN, SVM, Random Forest Classifier, Data Mining, JavaScript, Flask framework, MySQL, EDA. 1.INTRODUCTION The covid-19 lockdown proved to be a nightmare for each one of us. None of us could get out of their homes, travel, or do anything at all. Even in medical emergencies, patients were unable to reach hospitals owing to a lack of transportation. Even if they could, they would have to take a mandatory covid test, which took up a significant amount of time for the patients and consequently delayed the procedure for which they were there. We encountered a lot of people who had their test results in hand but couldn't meet with the doctors. This is when we discovered the necessity for intelligent software that might address this problem using Machine Learning and allowing patients to find out if they had an illness or not even at midnight. To address this issue, we proposed our disease prediction system, in which we take test data from patients and apply machine learning algorithms to them in order to assist them interpret their results. The fact that most people have access to internet 24/7 largely contributed in our solution. Our model now offers analysis for five diseases: liver disease, heart disease, diabetes, kidney disease, and cancer. Our system examines several algorithms like N- Nearest Neighbours, Support Vector Machine, Logistic Regression, Random Forest Classifier and Naïve Bayes classifier for each model and selects the best model for each ailment, as well as providing the findings. Along with the patients, our software could alsoproveuseful forthedoctors to confirm their opinions with the previous data sets. This would also aid in an early detection of the disease and could improve the chances for recovery tremendously for the patient. Our proposed software would also assist in giving a free option to those who are unable to visit a doctor due to financial constraints. 2. LITERATURE REVIEW In this paper, Mr. Santhana Krishnan.J & Dr. Deetha.S [1] have used 2 main machine learning algorithms namely decision tree algorithm and Naive Bayes algorithm. Using these algorithms, they predicted if a person has any heart disease or not. This model uses13medicalattributesasinput and then gives the result. They have compared the accuracy rate of the 2 classifiers (decision tree and naive Bayes classifier) and have concluded that the Decision tree has a higher accuracy ratewhich is of 91% and theaccuracyrateof Naive Bayes algo is 87%. To calculate this accuracy rate they hadconsidered 70% of the dataset as the trainingset andthe remaining 30% was taken as a test dataset. Here, they are predicting if a person is having any liver disease. The algorithms that they have used are KNN (K- Nearest Neighbour) and CNN (Convolutional Neural Network). The accuracy rate that they have got for CNN is 98.4% and that for KNN is 91%. [2] In this paper [3] they are predicting if a person has any kidney disease or not. If the person has a kidney disease they wouldclassify the disease into stages anddependingonwhat stage the patient is at and looking at the patient's potassium level, they will provide a balanced diet schedule forhim/her. In 2016, Priyanka Sonar & Prof. K. JayaMalini [4] performed an examination to determine whether or not a person had diabetes. They compared 11 test attributes from the person's test report and used machine learning algorithmssuch as the decisiontreeclassifier,SupportVector classifier andLogisticRegression.Outofthesealgorithms,the Support Vector Classifier was more accurate to 82% and confusion matrix was used to evaluate the model.
2.
International Research Journal
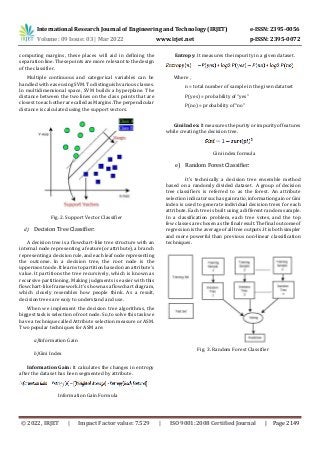
of Engineering and Technology (IRJET) e-ISSN: 2395-0056 Volume: 09 Issue: 03 | Mar 2022 www.irjet.net p-ISSN: 2395-0072 © 2022, IRJET | Impact Factor value: 7.529 | ISO 9001:2008 Certified Journal | Page 2148 In 2017, Debadri Dutta, Debpriyo Paul & Prof. Parthajeet Ghosh [5] performed the examination to determine whether or not a person had Cancer disease. They used supervised machine learning algorithms such as the Random Forest classifier and K Nearest Neighbours classifier. Out of these algorithms, RandomForestClassifierwasmoreaccuratewith a Recall score of 89% and confusion matrix was used to evaluate the model. K Ashfaq Ahmed, Sultan Aljahdali, Nisar Hundewale & K Ishthaq Ahmed [6] used Support Vector Machine(SVM) and random forest in their model to identify whether an individual has duke, breast or colon cancer. For them, the radial basis function proved to be the best with SVM and in some cases, results were comparable with random forest technique. FatimaDilawarMulla&NaveenkumarJayakumar[7]used Decision tree, Bayesian network, K-Nearest neighbour and support vector machine to identify if a person has a heart disease or not. In their model, SVM had the highest accuracy followed by KNN. The highest accuracy of SVM was 84.33%. P. Moksha Sri Sai, G. Anuradha & VVNV Phani kumar [8] used K-mean, KNN and SVM algorithms to identify whether an individual has diabetes disease or not and classified the disease into the correct type. They classified non-insulin- dependent andinsulin-dependentdiabetesandalsoprovided a balanced diet. In their model, the support vector machine gave the best accuracy score of 94%. 3. SYSTEM ARCHITECTURE I. Algorithms used a) K-Nearest Neighbours: In K-Nearest Neighbours(KNN), K is the number of nearest neighbours. Here the neighbours mean the output classification classes. IntheKNNalgorithm,thecore-deciding factor is the number of neighbours. When the number of classes is two, K is usually anodd number, indicating that the problem is a binary classification problem. The algorithm is known as the nearest neighbouralgorithmwhenK=1.Weuse Hamming, Euclidean, Manhattan, and Minkowski distance to find the distance between two points. The steps involved in KNN are: a. Calculate distance b. Finding the closest neighbouring point c. Classifying the dependent feature into yes or no Fig. 1. K-Nearest Neighbour b) Logistic Regression: For predicting binary classes, we use statistical methods like logistic regression. The target variable or outcome is binary in nature which means that there are only two possible classes. It calculates the likelihood of an event occurring. It uses a sigmoid function, also called logistic function. The sigmoid function generates an S-shaped curve which can be used to transform any real-valued number between 0 and 1. The y predicted becomes 1 when the curve reaches positive infinity, while y predicted becomes 0 when the curve reaches negative infinity. We can classify the result as 1 or YES if the sigmoid function output is greater than 0.5. We can classify the output of the sigmoid function as 0 or NO if it is less than 0.5. Assuming that we are using Logistic Regression to determine whether or not a person has a diabetic illness, if the output is 0.75, we can assume that a patient has a 75% risk of developing diabetes. The cost function is limited between 0 and 1 by the logistic regression hypothesis. As a result, we can't just rely on linear functions because they can have values more than 1 or less than 0, which isn't feasible according to the logistic regression. LR hypothesis expectation The sigmoid function comes into play at this point. The sigmoid function is used in machine learning to transform any real number into a value between 0 and 1. Sigmoid function formula c) Support Vector Machine: Although SVMs are classified as classification tools, they can also be used to solve regression problems. Support vectors are the data points closest to the hyperplane. By
3.
International Research Journal
of Engineering and Technology (IRJET) e-ISSN: 2395-0056 Volume: 09 Issue: 03 | Mar 2022 www.irjet.net p-ISSN: 2395-0072 © 2022, IRJET | Impact Factor value: 7.529 | ISO 9001:2008 Certified Journal | Page 2149 computing margins, these places will aid in defining the separation line. These points are more relevant to the design of the classifier. Multiple continuous and categorical variables can be handled with ease using SVM. To distinguish various classes. In multidimensional space, SVM builds a hyperplane. The distance between the two lines on the class points that are closest to each otherarecalledasMargins.Theperpendicular distance is calculated using the support vectors. Fig. 2. Support Vector Classifier d) Decision Tree Classifier: A decision tree is a flowchart-like tree structure with an internal node representing a feature(or attribute), a branch representing a decision rule, and each leaf noderepresenting the outcome. In a decision tree, the root node is the uppermost node. Itlearns to partition basedonanattribute's value. It partitions the tree recursively, which is known as recursive partitioning. Making judgments is easier with this flowchart-like framework. It's shownasaflowchartdiagram, which closely resembles how people think. As a result, decision trees are easy to understand and use. When we implement the decision tree algorithms, the biggest task is selection of root node. So, to solve this task we have a technique called Attribute selection measure or ASM. Two popular techniques for ASM are: a)Information Gain b)Gini Index Information Gain: It calculates the changes in entropy after the dataset has been segmented by attribute. Information Gain Formula Entropy: It measures the impurity in a given dataset. Where , n = total number of sample in the given datatset P(yes) = probability of “yes” P(no) = probability of “no” Gini Index: It measures the purity or impurityoffeatures while creating the decision tree. Gini index formula e) Random Forest Classifier: It's technically a decision tree ensemble method based on a randomly divided dataset. A group of decision tree classifiers is referred to as the forest. An attribute selection indicatorsuchasgainratio, informationgain orGini index is used to generate individual decision trees for each attribute. Each tree is built using a different random sample. In a classification problem, each tree votes, and the top few classes are chosen as thefinalresult.Thefinaloutcomeof regression is the average of all tree outputs. It is bothsimpler and more powerful than previous non-linear classification techniques. Fig. 3. Random Forest Classifier
4.
International Research Journal
of Engineering and Technology (IRJET) e-ISSN: 2395-0056 Volume: 09 Issue: 03 | Mar 2022 www.irjet.net p-ISSN: 2395-0072 © 2022, IRJET | Impact Factor value: 7.529 | ISO 9001:2008 Certified Journal | Page 2150 II. Architecture Overview Fig. 4. Proposed Model For our project,weexperimentedwithvariousalgorithms to build our predictive model the most accurate. Our main aim was to compare and figure out the most perfect predictive algorithm for each disease like Diabetes disease, Cancer disease, Liver disease, Heart disease, and Kidney disease. The first algorithm that we used was KNN. Next, we used Logistic Regression, followed by Support Vector Machines, Decision Tree Classifier, and Random Forest Classifier on every disease. The algorithms were implemented on the Kaggle and UCI datasets. To deliver an accurate and dependable experience to our consumers, we have made sure that we compare all algorithms and choose the best one for each condition in our web app. We experimented with five different algorithms on every dataset. We have performed hyperparameter tuning and featurescaling on every dataset and out of all the algorithms, the one with the highest accuracy was chosen by us for the prediction. We pickled the best model and then we made our web app using HTML, CSS and JavaScript and integrated this pickled model with our web application using flask framework. We made the user input form to take the input from the user based on his/her test report. For each disease, based on the features present in that particular disease. We created APIs for each disease so that when the user submits the form, we can process the data entered by the user in the backend using the best-fit model for that condition. Then we show the output on the screen and then for confirmation we also email the test result to the user on his registered email address. In our proposed model, we have planned to incorporate various features like recommending medicines which could give the patient immediate relief. These include some basic medicines like paracetamol,coughsyrup,etc.Alongwiththis, we also plan to include some home remedies. We would also recommend a suitable balanced diet which would aid in a faster recovery of the patient. A list of doctors and location along with directionstothehospitalhasalsobeenaddedonto our model. In the near future, we would also be able to call the doctors or chat with them directly on our app. 4. RESULTS AND DISCUSSIONS A) Experimental Setup All of the experiments were run on a machine with an Intel core i7 processor, Windows 10(64-bit) with 16GB of RAM. For this project, we have used HTML, CSS and JavaScript for the frontend. For the backend, we have used MySQL & flask framework. Along with these, we have also used essential tools like vs code and jupyter notebook. B) Comparison results & Analysis Diabetes We compared five different algorithms namely Gaussian Naïve Bayes, Logistic Regression, K-Nearest Neighbour, Support Vector Classifier and Decision Tree for the diabetes disease. ForevaluationofthesemodelsweusedAccuracyand CV Scores. On comparing these scores for different algorithms, weconcludedthatKNNgavethehighestaccuracy of 77.21%. While performing the EDA, there were no null or duplicate values as we fetched the preprocessed datasets[9] for this disease. Heart The heart dataset [10] that we have used contained 76 attributes but it did not seem meaningful to use all these features so we performed an extra tree regressor classifier function and selected the top 14 features out of it for a faster prediction. On comparingfouralgorithms,wefiguredthatthe Logistic Regression gave the highest accuracy of 90.25%.
5.
International Research Journal
of Engineering and Technology (IRJET) e-ISSN: 2395-0056 Volume: 09 Issue: 03 | Mar 2022 www.irjet.net p-ISSN: 2395-0072 © 2022, IRJET | Impact Factor value: 7.529 | ISO 9001:2008 Certified Journal | Page 2151 Fig. 5. Heart Accuracy Score comparison Liver Since we saw a rise in the cases of liver diseases due to an increase in consumption of alcohol, inhalation of harmful gases and intake of contaminated food, wefounditnecessary for us to include the liver disease prediction system on our software. The dataset that we used[11] for our prediction contained 416 records of liver patients and 167 records for which the liver disease was not detected. We compared different algorithms using different evaluation criteria like accuracy score, precision, recall and f-1 score and found that Random Forest gave the best prediction for this disease with a recall score of 97%. Cancer In this dataset[12], we had 32 features and 569 patient records. Out of these 569 records, 357 were Benign and 212 are Malignant. We performed exploratory data analysis and found that there were no null values in any record. While building the model, we also performed Extra tree regression to explore the most important features for the prediction. Fig. 6. Extra Tree Classifier Decision Tree classifier outperformed all the other algorithms like SVC, KNN, LR and Random Forest with an accuracy of 98.62 percent. Kidney This dataset[13] contains 25 features like red blood cell count, white blood cell count, etc. Out of the 25 features we only chose the first 7 features as we observed that the other 18 features had very low importance.Thisdatasethadalotof null values. We replaced the null valuesbytakingthemodeof that feature. We performed OneHotEncoding on various features and encoded various categorical features with 0s and 1s. For an example, we converted Notckd to 0 and ckd to 1. In this model, we observed hat Random forest performed the best with an accuracy score of 96.45%. REFERENCES [1] Mr. Santhana Krishnan.J & Dr. Geetha.S, “Prediction of Heart disease using machine learning algorithms” . [2] Dhiraj Dahiwade, Prof. Gajanan Patle & Prof. Ektaa Meshram, “Designing Disease Prediction Model Using Machine Learning Approach”. [3] Akash Maurya, Rahul Wable, Rasika Shinde, Sebin John, Rahul Jadhav & Dakshayani.R, “Chronic Kidney Disease Prediction and Recommendation of Suitable Diet plan by using machine learning”. [4] Mrs. Priyanka Sonar & Anjali K JayaMalini, “Diabetes Prediction Using Different Machine Learning Approaches”. [5] Mrs. Debadri Dutta & Debpriyo Paul, “AnalysingFeature Importances for Diabetes Prediction using Machine Learning”. [6] K Ashfaq Ahmed, Sultan Aljahdali, Nisar Hundewale & K Ishthaq Ahmed, “Cancer disease prediction with support vector machine and randomforestclassificationtechniques”. [7] Fatima Dilawar Mulla & Naveenkumar Jayakumar, “A review of Data Mining & Machine Learning approaches for identifying Risk Factor contributing to likelihood of cardiovascular diseases”. [8] P. Moksha Sri Sai, G. Anuradha, VVNV Phani kumar, “Survey on Type 2 Diabetes Prediction Using Machine Learning”. [9] Diabetes dataset: https://www.kaggle.com/datasets/uciml/pima-indians- diabetes-database [10] Heart dataset: https://www.kaggle.com/datasets/johnsmith88/heart- disease-dataset [11] Liver dataset: https://www.kaggle.com/uciml/indian- liver-patient-records [12] Cancer dataset: https://www.kaggle.com/datasets/uciml/breast-cancer- wisconsin-data [13] Kidney Dataset: https://www.kaggle.com/datasets/mansoordaku/ckdisease
Download
![International Research Journal of Engineering and Technology (IRJET) e-ISSN: 2395-0056
Volume: 09 Issue: 03 | Mar 2022 www.irjet.net p-ISSN: 2395-0072
© 2022, IRJET | Impact Factor value: 7.529 | ISO 9001:2008 Certified Journal | Page 2147
Disease Prediction System using Machine Learning
Dhiraj Parikarma Gupta1, Bhavin Kishin Fatnani2
1Undergraduate student, Thadomal Shahani Engineering College, Mumbai, India
2 Undergraduate student, Thadomal Shahani Engineering College, Mumbai, India
---------------------------------------------------------------------***---------------------------------------------------------------------
Abstract - With the change in lifestyle of people, chronic
diseases have become very common. And as peoplearegetting
exposed to internet and gadgets, a large amount of data
associated with their health is generated each day. With the
evolution of machine learning algorithm this data canbe used
to monitor the health and wellbeing of people. With this
research we aim at providing a complete solution to assist
people in avoiding any future health complications. Proposed
model uses machine learning algorithms to predict the
possibility of diseases namely Diabetes, Heart disease, Kidney
disease, Liver disease and Cancer. Proposed model alsohelp to
find the nearest medical facilities and maintainhealthrecords
of patients. We ran various algorithms on each dataset and
determined that Random Forest was the most accurate for
Diabetes, with a score of 77.21%. Logistic regression
performed the best for heart disease, withanaccuracyscoreof
90.25%. Similarly, Random Forest gave a recall score of
97% for liver disease, and Decision Tree proved to be the best
for cancer with 98.62%. Random Forest provided an accuracy
score of 96.45% for kidney disease.
Key Words: Chronic disease, Machine learning, Decision
Tree Classifier, KNN, SVM, Random Forest Classifier, Data
Mining, JavaScript, Flask framework, MySQL, EDA.
1.INTRODUCTION
The covid-19 lockdown proved to be a nightmare for
each one of us. None of us could get out of their homes,
travel, or do anything at all. Even in medical emergencies,
patients were unable to reach hospitals owing to a lack of
transportation. Even if they could, they would have to take a
mandatory covid test, which took up a significant amount of
time for the patients and consequently delayed the
procedure for which they were there. We encountered a lot
of people who had their test results in hand but couldn't
meet with the doctors. This is when we discovered the
necessity for intelligent software that might address this
problem using Machine Learning and allowing patients to
find out if they had an illness or not even at midnight.
To address this issue, we proposed our disease
prediction system, in which we take test data from patients
and apply machine learning algorithms to them in order to
assist them interpret their results. The fact that most people
have access to internet 24/7 largely contributed in our
solution. Our model now offers analysis for five diseases:
liver disease, heart disease, diabetes, kidney disease, and
cancer. Our system examines several algorithms like N-
Nearest Neighbours, Support Vector Machine, Logistic
Regression, Random Forest Classifier and Naïve Bayes
classifier for each model and selects the best model for each
ailment, as well as providing the findings. Along with the
patients, our software could alsoproveuseful forthedoctors
to confirm their opinions with the previous data sets. This
would also aid in an early detection of the disease and could
improve the chances for recovery tremendously for the
patient. Our proposed software would also assist in giving a
free option to those who are unable to visit a doctor due to
financial constraints.
2. LITERATURE REVIEW
In this paper, Mr. Santhana Krishnan.J & Dr. Deetha.S [1]
have used 2 main machine learning algorithms namely
decision tree algorithm and Naive Bayes algorithm. Using
these algorithms, they predicted if a person has any heart
disease or not. This model uses13medicalattributesasinput
and then gives the result. They have compared the accuracy
rate of the 2 classifiers (decision tree and naive Bayes
classifier) and have concluded that the Decision tree has a
higher accuracy ratewhich is of 91% and theaccuracyrateof
Naive Bayes algo is 87%. To calculate this accuracy rate they
hadconsidered 70% of the dataset as the trainingset andthe
remaining 30% was taken as a test dataset.
Here, they are predicting if a person is having any liver
disease. The algorithms that they have used are KNN (K-
Nearest Neighbour) and CNN (Convolutional Neural
Network). The accuracy rate that they have got for CNN is
98.4% and that for KNN is 91%. [2]
In this paper [3] they are predicting if a person has any
kidney disease or not. If the person has a kidney disease they
wouldclassify the disease into stages anddependingonwhat
stage the patient is at and looking at the patient's potassium
level, they will provide a balanced diet schedule forhim/her.
In 2016, Priyanka Sonar & Prof. K. JayaMalini [4]
performed an examination to determine whether or not a
person had diabetes. They compared 11 test attributes from
the person's test report and used machine learning
algorithmssuch as the decisiontreeclassifier,SupportVector
classifier andLogisticRegression.Outofthesealgorithms,the
Support Vector Classifier was more accurate to 82% and
confusion matrix was used to evaluate the model.](https://image.slidesharecdn.com/irjet-v9i3387-220920102349-73a113ab/85/Disease-Prediction-System-using-Machine-Learning-1-320.jpg)
![International Research Journal of Engineering and Technology (IRJET) e-ISSN: 2395-0056
Volume: 09 Issue: 03 | Mar 2022 www.irjet.net p-ISSN: 2395-0072
© 2022, IRJET | Impact Factor value: 7.529 | ISO 9001:2008 Certified Journal | Page 2148
In 2017, Debadri Dutta, Debpriyo Paul & Prof. Parthajeet
Ghosh [5] performed the examination to determine whether
or not a person had Cancer disease. They used supervised
machine learning algorithms such as the Random Forest
classifier and K Nearest Neighbours classifier. Out of these
algorithms, RandomForestClassifierwasmoreaccuratewith
a Recall score of 89% and confusion matrix was used to
evaluate the model.
K Ashfaq Ahmed, Sultan Aljahdali, Nisar Hundewale & K
Ishthaq Ahmed [6] used Support Vector Machine(SVM) and
random forest in their model to identify whether an
individual has duke, breast or colon cancer. For them, the
radial basis function proved to be the best with SVM and in
some cases, results were comparable with random forest
technique.
FatimaDilawarMulla&NaveenkumarJayakumar[7]used
Decision tree, Bayesian network, K-Nearest neighbour and
support vector machine to identify if a person has a heart
disease or not. In their model, SVM had the highest accuracy
followed by KNN. The highest accuracy of SVM was 84.33%.
P. Moksha Sri Sai, G. Anuradha & VVNV Phani kumar [8]
used K-mean, KNN and SVM algorithms to identify whether
an individual has diabetes disease or not and classified the
disease into the correct type. They classified non-insulin-
dependent andinsulin-dependentdiabetesandalsoprovided
a balanced diet. In their model, the support vector machine
gave the best accuracy score of 94%.
3. SYSTEM ARCHITECTURE
I. Algorithms used
a) K-Nearest Neighbours:
In K-Nearest Neighbours(KNN), K is the number of
nearest neighbours. Here the neighbours mean the output
classification classes. IntheKNNalgorithm,thecore-deciding
factor is the number of neighbours. When the number of
classes is two, K is usually anodd number, indicating that the
problem is a binary classification problem. The algorithm is
known as the nearest neighbouralgorithmwhenK=1.Weuse
Hamming, Euclidean, Manhattan, and Minkowski distance to
find the distance between two points.
The steps involved in KNN are:
a. Calculate distance
b. Finding the closest neighbouring point
c. Classifying the dependent feature into yes or no
Fig. 1. K-Nearest Neighbour
b) Logistic Regression:
For predicting binary classes, we use statistical methods
like logistic regression. The target variable or outcome is
binary in nature which means that there are only two
possible classes. It calculates the likelihood of an event
occurring. It uses a sigmoid function, also called logistic
function. The sigmoid function generates an S-shaped curve
which can be used to transform any real-valued number
between 0 and 1. The y predicted becomes 1 when the curve
reaches positive infinity, while y predicted becomes 0 when
the curve reaches negative infinity. We can classify the result
as 1 or YES if the sigmoid function output is greater than 0.5.
We can classify the output of the sigmoid function as 0 or NO
if it is less than 0.5. Assuming that we are using Logistic
Regression to determine whether or not a person has a
diabetic illness, if the output is 0.75, we can assume that a
patient has a 75% risk of developing diabetes. The cost
function is limited between 0 and 1 by the logistic regression
hypothesis. As a result, we can't just rely on linear functions
because they can have values more than 1 or less than 0,
which isn't feasible according to the logistic regression.
LR hypothesis expectation
The sigmoid function comes into play at this point. The
sigmoid function is used in machine learning to transform
any real number into a value between 0 and 1.
Sigmoid function formula
c) Support Vector Machine:
Although SVMs are classified as classification tools, they
can also be used to solve regression problems. Support
vectors are the data points closest to the hyperplane. By](https://image.slidesharecdn.com/irjet-v9i3387-220920102349-73a113ab/85/Disease-Prediction-System-using-Machine-Learning-2-320.jpg)
![International Research Journal of Engineering and Technology (IRJET) e-ISSN: 2395-0056
Volume: 09 Issue: 03 | Mar 2022 www.irjet.net p-ISSN: 2395-0072
© 2022, IRJET | Impact Factor value: 7.529 | ISO 9001:2008 Certified Journal | Page 2150
II. Architecture Overview
Fig. 4. Proposed Model
For our project,weexperimentedwithvariousalgorithms
to build our predictive model the most accurate. Our main
aim was to compare and figure out the most perfect
predictive algorithm for each disease like Diabetes disease,
Cancer disease, Liver disease, Heart disease, and Kidney
disease. The first algorithm that we used was KNN. Next, we
used Logistic Regression, followed by Support Vector
Machines, Decision Tree Classifier, and Random Forest
Classifier on every disease. The algorithms were
implemented on the Kaggle and UCI datasets. To deliver an
accurate and dependable experience to our consumers, we
have made sure that we compare all algorithms and choose
the best one for each condition in our web app.
We experimented with five different algorithms on every
dataset. We have performed hyperparameter tuning and
featurescaling on every dataset and out of all the algorithms,
the one with the highest accuracy was chosen by us for the
prediction. We pickled the best model and then we made our
web app using HTML, CSS and JavaScript and integrated this
pickled model with our web application using flask
framework. We made the user input form to take the input
from the user based on his/her test report. For each disease,
based on the features present in that particular disease. We
created APIs for each disease so that when the user submits
the form, we can process the data entered by the user in the
backend using the best-fit model for that condition. Then we
show the output on the screen and then for confirmation we
also email the test result to the user on his registered email
address.
In our proposed model, we have planned to incorporate
various features like recommending medicines which could
give the patient immediate relief. These include some basic
medicines like paracetamol,coughsyrup,etc.Alongwiththis,
we also plan to include some home remedies. We would also
recommend a suitable balanced diet which would aid in a
faster recovery of the patient. A list of doctors and location
along with directionstothehospitalhasalsobeenaddedonto
our model. In the near future, we would also be able to call
the doctors or chat with them directly on our app.
4. RESULTS AND DISCUSSIONS
A) Experimental Setup
All of the experiments were run on a machine with an
Intel core i7 processor, Windows 10(64-bit) with 16GB of
RAM. For this project, we have used HTML, CSS and
JavaScript for the frontend. For the backend, we have used
MySQL & flask framework. Along with these, we have also
used essential tools like vs code and jupyter notebook.
B) Comparison results & Analysis
Diabetes
We compared five different algorithms namely Gaussian
Naïve Bayes, Logistic Regression, K-Nearest Neighbour,
Support Vector Classifier and Decision Tree for the diabetes
disease. ForevaluationofthesemodelsweusedAccuracyand
CV Scores. On comparing these scores for different
algorithms, weconcludedthatKNNgavethehighestaccuracy
of 77.21%. While performing the EDA, there were no null or
duplicate values as we fetched the preprocessed datasets[9]
for this disease.
Heart
The heart dataset [10] that we have used contained 76
attributes but it did not seem meaningful to use all these
features so we performed an extra tree regressor classifier
function and selected the top 14 features out of it for a faster
prediction. On comparingfouralgorithms,wefiguredthatthe
Logistic Regression gave the highest accuracy of 90.25%.](https://image.slidesharecdn.com/irjet-v9i3387-220920102349-73a113ab/85/Disease-Prediction-System-using-Machine-Learning-4-320.jpg)
![International Research Journal of Engineering and Technology (IRJET) e-ISSN: 2395-0056
Volume: 09 Issue: 03 | Mar 2022 www.irjet.net p-ISSN: 2395-0072
© 2022, IRJET | Impact Factor value: 7.529 | ISO 9001:2008 Certified Journal | Page 2151
Fig. 5. Heart Accuracy Score comparison
Liver
Since we saw a rise in the cases of liver diseases due to an
increase in consumption of alcohol, inhalation of harmful
gases and intake of contaminated food, wefounditnecessary
for us to include the liver disease prediction system on our
software. The dataset that we used[11] for our prediction
contained 416 records of liver patients and 167 records for
which the liver disease was not detected. We compared
different algorithms using different evaluation criteria like
accuracy score, precision, recall and f-1 score and found that
Random Forest gave the best prediction for this disease with
a recall score of 97%.
Cancer
In this dataset[12], we had 32 features and 569 patient
records. Out of these 569 records, 357 were Benign and 212
are Malignant. We performed exploratory data analysis and
found that there were no null values in any record. While
building the model, we also performed Extra tree regression
to explore the most important features for the prediction.
Fig. 6. Extra Tree Classifier
Decision Tree classifier outperformed all the other
algorithms like SVC, KNN, LR and Random Forest with an
accuracy of 98.62 percent.
Kidney
This dataset[13] contains 25 features like red blood cell
count, white blood cell count, etc. Out of the 25 features we
only chose the first 7 features as we observed that the other
18 features had very low importance.Thisdatasethadalotof
null values. We replaced the null valuesbytakingthemodeof
that feature. We performed OneHotEncoding on various
features and encoded various categorical features with 0s
and 1s. For an example, we converted Notckd to 0 and ckd to
1. In this model, we observed hat Random forest performed
the best with an accuracy score of 96.45%.
REFERENCES
[1] Mr. Santhana Krishnan.J & Dr. Geetha.S, “Prediction of
Heart disease
using machine learning algorithms” .
[2] Dhiraj Dahiwade, Prof. Gajanan Patle & Prof. Ektaa
Meshram, “Designing Disease Prediction Model Using
Machine Learning Approach”.
[3] Akash Maurya, Rahul Wable, Rasika Shinde, Sebin John,
Rahul Jadhav & Dakshayani.R, “Chronic Kidney Disease
Prediction and Recommendation of Suitable Diet plan by
using machine learning”.
[4] Mrs. Priyanka Sonar & Anjali K JayaMalini, “Diabetes
Prediction Using Different Machine Learning Approaches”.
[5] Mrs. Debadri Dutta & Debpriyo Paul, “AnalysingFeature
Importances for Diabetes Prediction using Machine
Learning”.
[6] K Ashfaq Ahmed, Sultan Aljahdali, Nisar Hundewale & K
Ishthaq Ahmed, “Cancer disease prediction with support
vector machine and randomforestclassificationtechniques”.
[7] Fatima Dilawar Mulla & Naveenkumar Jayakumar, “A
review of Data Mining & Machine Learning approaches for
identifying Risk Factor contributing to likelihood of
cardiovascular diseases”.
[8] P. Moksha Sri Sai, G. Anuradha, VVNV Phani kumar,
“Survey on Type 2 Diabetes Prediction Using Machine
Learning”.
[9] Diabetes dataset:
https://www.kaggle.com/datasets/uciml/pima-indians-
diabetes-database
[10] Heart dataset:
https://www.kaggle.com/datasets/johnsmith88/heart-
disease-dataset
[11] Liver dataset: https://www.kaggle.com/uciml/indian-
liver-patient-records
[12] Cancer dataset:
https://www.kaggle.com/datasets/uciml/breast-cancer-
wisconsin-data
[13] Kidney Dataset:
https://www.kaggle.com/datasets/mansoordaku/ckdisease](https://image.slidesharecdn.com/irjet-v9i3387-220920102349-73a113ab/85/Disease-Prediction-System-using-Machine-Learning-5-320.jpg)


