Download to read offline
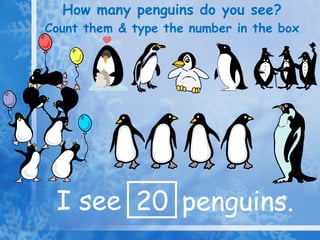
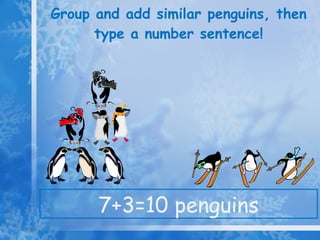
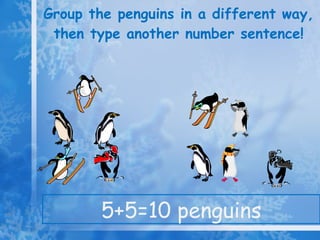
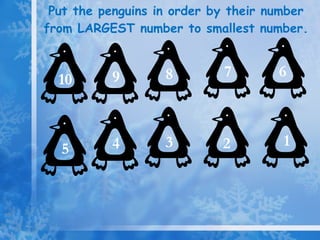
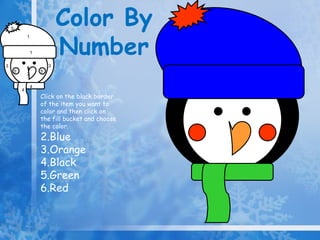

The document is an interactive math book about penguins that prompts the reader to: 1) Count 20 penguins shown and type the number. 2) Group the penguins in two ways and write number sentences for addition problems (7+3=10 and 5+5=10). 3) Order the penguins from largest to smallest number and type the order. 4) Color items by number using different colors.


