DFTG-2319-AB-L07
•
0 likes•84 views

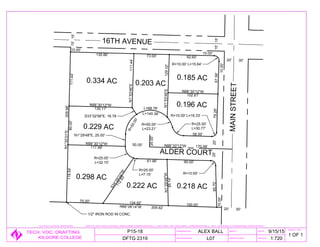
This document contains a survey plat with bearings, distances, and coordinates describing several properties. It includes street names, parcel sizes, and a note about drafting tolerances. The properties are located near 16th Avenue and Main Street.
Report
Share
Report
Share
Download to read offline
Recommended
02 April 2022.docx
The document contains data about the sun and moon on April 2nd 2022 including their positions, azimuth, altitude, declination, distance from Earth, diameter, and other astronomical information recorded hourly from 0:00 to 24:00 hours. The sun data includes 12 measurements while the moon data includes 24 measurements with information about its right ascension, declination, parallax, semidiameter size, and position relative to the ecliptic plane.
Trabajo del examen
This document contains statistical information from an exam including the minimum and maximum scores, range, frequency counts and percentages for 12 intervals, calculations for the mean, variance, standard deviation, and a graph of the frequency distribution. It provides an analysis of the exam scores through measures of central tendency and dispersion.
Peta unit lahan
This document is a map of land use in the sub-district of Lalabata, Soppeng Regency, South Sulawesi, Indonesia at a scale of 1:20,000. The map details geographic coordinates and location information. It also lists data sources and was created by Gian Tulak from the Department of Soil Science at Hasanuddin University in Makassar, Indonesia.
Datos del perfil
This document contains temperature readings taken at regular intervals from 0 to 2034.7 seconds. The temperature starts at 100 units at 0 seconds and gradually increases before leveling off around 107 units from 60 to 749 seconds. It then fluctuates slightly but remains around 106-107 units for the majority of the readings before gradually decreasing towards the end.
Woburn Park Stage 14 angle
For more information visit our website at
http://www.lwppropertygroup.com.au/our-communities/woburn-park/home
CBG_BSc Grad
This document summarizes the analysis and modeling of a sailboat for optimization of its rigging system. It includes:
- An overview of the rules and restrictions analyzed for sailboat rigging.
- Details of the 3D modeling process for the boat and rigging system.
- Calculations of weight distribution, sail and rigging forces, and component scantlings.
- Tables presenting load distributions and forces on the mainsail, foresail, and spinnaker under various wind conditions.
Weather Part 2
Global air circulation patterns are complicated by the Earth's rotation, tilted axis, and uneven distribution of land masses. These patterns are categorized into three circulation cells: Hadley, Ferrel, and Polar. Jet streams are fast flowing air currents in the upper atmosphere that blow from west to east and vary in location between summer and winter. Köppen classified world climates based on typical temperature and moisture profiles.
Subtraction 5
This document contains a series of subtraction problems with 3 potential answer choices for each problem. It provides practice for subtraction skills through multiple examples of taking one multi-digit number away from another multi-digit number and choosing the correct difference.
dBm to Watt Conversion Tables
The document provides conversion tables between dBm values and watt/milliwatt values. It shows that dBm is a logarithmic scale used to indicate the power level of a signal, with each 3 dB increase representing a doubling of power. The tables provide conversions from dBm to watts down to the femtowatt, attowatt and even attojoule levels, as well as conversions for positive and negative dBm values. Metric prefixes are also defined for different power level multipliers.
P.r.g. isola delle femminetav 2.3 calcolo isolati b
The document appears to be a map or diagram showing various measurements in meters of streets, buildings, and open areas in a town planning zone labeled B1. There are numeric values ranging from 0.0 to 430.0 scattered across the diagram. Text on the diagram includes labels for streets, landmarks, scales, legends, notes on approvals, and attribution to an architecture studio and local administration.
T E S T 1 Answers
This document contains a chemistry test with 5 questions. Question 1 involves calculations about densities and masses of gold and sand. Question 2 involves solving math problems with significant figures. Question 3 asks about Michael Phelps' swimming speed in different units. Question 4 calculates the atomic weight of a gold sample with multiple isotopes. Question 5 completes a chart with information about atoms including protons, electrons, neutrons, and atomic weight.
Steel Slag Leachate Metals
This document presents the results of trace metal analysis of environmental samples collected from the French Creek and Black Rivers in Lorain County, Ohio. Samples were collected from 22 different areas, including upstream and downstream of steel slag piles, drainage areas, and mixing zones. The samples were analyzed using various analytical techniques to measure the concentrations of 22 different metal analytes. The results are displayed in a table listing the measurement values for each metal at each sample location.
9.2 2016 investor presentation
This document presents data from confirmation drilling of the Horne West zone in 2015. It includes tables showing drill hole IDs, sample intervals with gold, silver, copper and zinc values, and calculated equivalent gold grades with and without silver. The weighted average gold equivalent grade including silver for 2015 drilling was 2.45 g/t, a 4.3% increase from 2014 drilling. Individual hole results varied from decreases of over 50% to increases of over 30% compared to 2014 grades. The drilling indicates the mineralized zone continues at depth and along strike.
02 cuadros hidrologia
This document provides physical characteristics and parameters of the Mantaro River basin in Peru. It includes the basin area (31,747 km2), average altitude (2,518 m), longest river length (14.145 km), and average rainfall by month between 1963-2018 based on data from the Quillabamba weather station. It also lists indices such as drainage density, stream order, and average slopes. In summary, it analyzes key hydrological metrics of the Mantaro River basin through tables of geographic and climatic data.
Tabela Wiertnicza Rury
This document provides technical specifications for various types of oil and gas pipes including casing pipes, wash pipes, drill pipes, and drill collars. It lists the nominal diameters, weights, capacities, and properties of each type of pipe. Dimensions include internal and external diameters, wall thickness, and dimensions of threaded connectors. The document also specifies the material grades and connection types for each pipe size.
DFTG-1358-AB-L08
This document contains a diagram of the electrical system for a vehicle. It shows the various fuses, relays, and electrical components connected in the power distribution center and fuel system. The components include the fuel pump module, fuel pump relay, ignition switch, sentry key immobilizer, and air conditioning compressor clutch relay. Electrical connections are indicated between these components.
DFTG-1317-AB-L01
This document is a floor plan for a residence located at 1100 Broadway St. in Kilgore, Texas. It includes dimensions for each room and notes providing details about materials, fixtures, and total areas. A legend provides information on door and window schedules. The floor plan shows the layout of the home's rooms including dimensions. Notes specify brick details, closet shelf sizes, built-in dimensions, and identical small room dimensions. Total living area is listed as 2788 square feet and total building area as 2856 square feet.
ARCE-1352-AB-L05
The document contains a structural plan view and section drawings with dimensions and callouts for columns, beams, and other structural elements. Round and square hollow structural sections and wide flange beams are specified at various sizes. The drawings include a plan view, section A-A, and section B-B with annotations to identify materials and components.
More Related Content
Similar to DFTG-2319-AB-L07
dBm to Watt Conversion Tables
The document provides conversion tables between dBm values and watt/milliwatt values. It shows that dBm is a logarithmic scale used to indicate the power level of a signal, with each 3 dB increase representing a doubling of power. The tables provide conversions from dBm to watts down to the femtowatt, attowatt and even attojoule levels, as well as conversions for positive and negative dBm values. Metric prefixes are also defined for different power level multipliers.
P.r.g. isola delle femminetav 2.3 calcolo isolati b
The document appears to be a map or diagram showing various measurements in meters of streets, buildings, and open areas in a town planning zone labeled B1. There are numeric values ranging from 0.0 to 430.0 scattered across the diagram. Text on the diagram includes labels for streets, landmarks, scales, legends, notes on approvals, and attribution to an architecture studio and local administration.
T E S T 1 Answers
This document contains a chemistry test with 5 questions. Question 1 involves calculations about densities and masses of gold and sand. Question 2 involves solving math problems with significant figures. Question 3 asks about Michael Phelps' swimming speed in different units. Question 4 calculates the atomic weight of a gold sample with multiple isotopes. Question 5 completes a chart with information about atoms including protons, electrons, neutrons, and atomic weight.
Steel Slag Leachate Metals
This document presents the results of trace metal analysis of environmental samples collected from the French Creek and Black Rivers in Lorain County, Ohio. Samples were collected from 22 different areas, including upstream and downstream of steel slag piles, drainage areas, and mixing zones. The samples were analyzed using various analytical techniques to measure the concentrations of 22 different metal analytes. The results are displayed in a table listing the measurement values for each metal at each sample location.
9.2 2016 investor presentation
This document presents data from confirmation drilling of the Horne West zone in 2015. It includes tables showing drill hole IDs, sample intervals with gold, silver, copper and zinc values, and calculated equivalent gold grades with and without silver. The weighted average gold equivalent grade including silver for 2015 drilling was 2.45 g/t, a 4.3% increase from 2014 drilling. Individual hole results varied from decreases of over 50% to increases of over 30% compared to 2014 grades. The drilling indicates the mineralized zone continues at depth and along strike.
02 cuadros hidrologia
This document provides physical characteristics and parameters of the Mantaro River basin in Peru. It includes the basin area (31,747 km2), average altitude (2,518 m), longest river length (14.145 km), and average rainfall by month between 1963-2018 based on data from the Quillabamba weather station. It also lists indices such as drainage density, stream order, and average slopes. In summary, it analyzes key hydrological metrics of the Mantaro River basin through tables of geographic and climatic data.
Tabela Wiertnicza Rury
This document provides technical specifications for various types of oil and gas pipes including casing pipes, wash pipes, drill pipes, and drill collars. It lists the nominal diameters, weights, capacities, and properties of each type of pipe. Dimensions include internal and external diameters, wall thickness, and dimensions of threaded connectors. The document also specifies the material grades and connection types for each pipe size.
Similar to DFTG-2319-AB-L07 (7)
P.r.g. isola delle femminetav 2.3 calcolo isolati b
P.r.g. isola delle femminetav 2.3 calcolo isolati b
More from Alex Ball
DFTG-1358-AB-L08
This document contains a diagram of the electrical system for a vehicle. It shows the various fuses, relays, and electrical components connected in the power distribution center and fuel system. The components include the fuel pump module, fuel pump relay, ignition switch, sentry key immobilizer, and air conditioning compressor clutch relay. Electrical connections are indicated between these components.
DFTG-1317-AB-L01
This document is a floor plan for a residence located at 1100 Broadway St. in Kilgore, Texas. It includes dimensions for each room and notes providing details about materials, fixtures, and total areas. A legend provides information on door and window schedules. The floor plan shows the layout of the home's rooms including dimensions. Notes specify brick details, closet shelf sizes, built-in dimensions, and identical small room dimensions. Total living area is listed as 2788 square feet and total building area as 2856 square feet.
ARCE-1352-AB-L05
The document contains a structural plan view and section drawings with dimensions and callouts for columns, beams, and other structural elements. Round and square hollow structural sections and wide flange beams are specified at various sizes. The drawings include a plan view, section A-A, and section B-B with annotations to identify materials and components.
More from Alex Ball (6)
DFTG-2319-AB-L07
- 1. S33°02'56"E, 16.78 75.00' 134.92' 100.00'N88°06'14"W 309.92' ALDER COURT 20' 20' 30' 30' 118.54'80.00'111.44' N1°30'31"E309.98' 1/2" IRON ROD IN CONC. 117.99' N88°30'12"W 130.11' N88°30'12"W 61.96' 90.00' 102.61' N88°30'12"W 58.00' 130.86' 73.00' 92.60' N1°53'46"E111.44' N1°53'46"E129.32' 10.00' 10.00' N88°30'12"W 170.58' 25.00' 50.00' 112.93' S34°09'22"W 95.14' N1°29'48"W 85.70' R=10.00' 10.00' 10.00' 67.56'79.28' R=10.00' L=15.64' R=25.00' L=30.77' R=10.00' L=16.33' R=25.00' L=7.15' R=25.00' L=32.10' N1°29'48"E, 25.00' R=50.00' L=140.38' L=68.78' R=50.00' L=23.21' 15'15' 15'15' 25'25' 16TH AVENUE MAINSTREET 0.218 AC0.222 AC 0.298 AC 0.229 AC 0.334 AC 0.203 AC 0.185 AC 0.196 AC LIMITS ON FRACTIONAL MACHINE DIMENSIONS ± 1/64 AND ON DECIMAL DIMENSIONS ± .001 UNLESS OTHERWISE SPECIFIEDDO NOT SCALE DRAWING KILGORE COLLEGE TECH. VOC. DRAFTINGKC-203-01 REFERENCE: DRAWN BY: APPROVED: MATL: SCALE: DATE: SHEET NO. DFTG 2319 1 OF 1 1:720 9/15/15ALEX BALL L07 P15-18