Download as PDF, PPTX


![@zepouet#InfluxDB
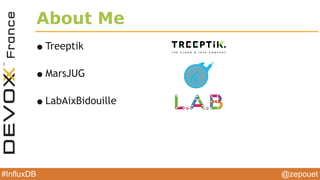
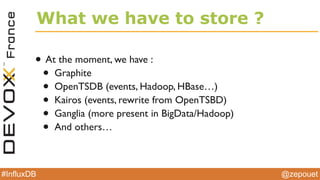
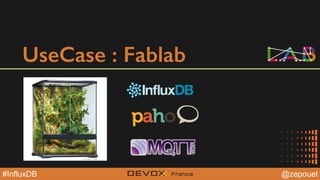
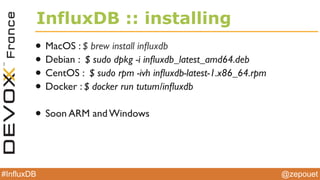
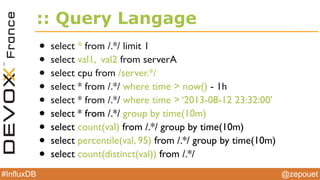
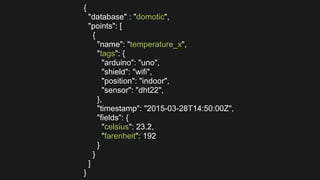
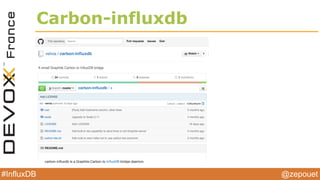
InfluxDB :: create points
curl -X POST -d '[{"name":"temp","columns":
["celsius"],"points":[[23]]}]' ‘http://localhost:8086/db/
mydb/series?u=root&p=root
curl -G 'http://localhost:8086/db/mydb/series?
u=root&p=root' --data-urlencode "q=select * from temp"](https://image.slidesharecdn.com/devoxxfrance2015influxdb-150419124951-conversion-gate01/85/Devoxx-france-2015-influxdb-22-320.jpg)

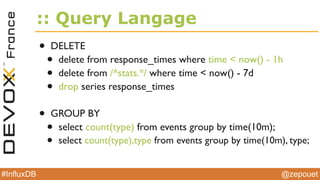


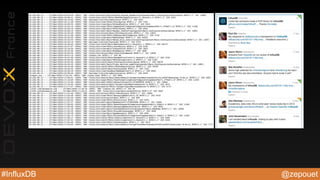
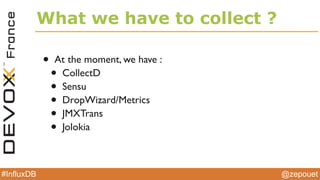
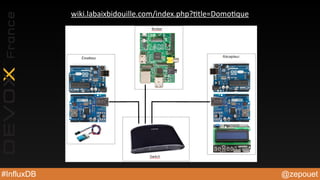
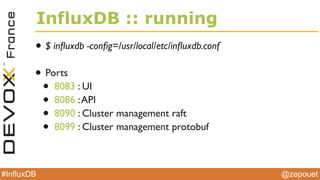
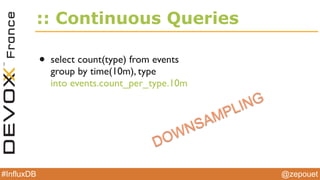
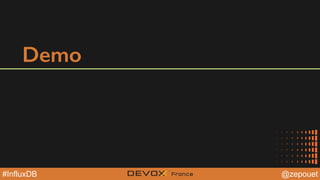
![{
"database" : "domotic",
"points": [
{
"name": "temperature_x",
"tags": {
"arduino": "uno",
"shield": "wifi",
"position": "indoor",
"sensor": "dht22",
},
"timestamp": "2015-03-28T14:50:00Z",
"fields": {
"celsius": 23.2,
"farenheit": 192
}
}
]
}](https://image.slidesharecdn.com/devoxxfrance2015influxdb-150419124951-conversion-gate01/85/Devoxx-france-2015-influxdb-33-320.jpg)


The document discusses InfluxDB, an open-source distributed time series database designed for ease of installation and management, with features such as HTTP interface, horizontal scalability, and on-the-fly computations. It highlights use cases, installation guides, security measures, query languages, and potential pitfalls. The document also outlines the design goals and upcoming features, including clustering and enhanced tagging for future releases.


![Russ Savage [Ngrok] | InfluxDB QuickStart | InfluxDays NA 2021](https://cdn.slidesharecdn.com/ss_thumbnails/russ-savageinfluxdays-na-2021-211022195246-thumbnail.jpg?width=640&height=640&fit=bounds)


![Dean Sheehan [InfluxData] | InfluxDB Time Series Engine Overview | InfluxDays...](https://cdn.slidesharecdn.com/ss_thumbnails/dem10timeseriesengineoverviewdeansheehan-221020205424-fa16f7e9-thumbnail.jpg?width=640&height=640&fit=bounds)


![[DSC Europe 25] Raul Cruz Bonilla - Harnessing GEN AI in Fashion, Luxury and ...](https://cdn.slidesharecdn.com/ss_thumbnails/me7nvup5thwqzwzblbvw-raul-cruz-harnessing-ai-en-luxury-260123083019-32ac5a43-thumbnail.jpg?width=640&height=640&fit=bounds)


