Download to read offline
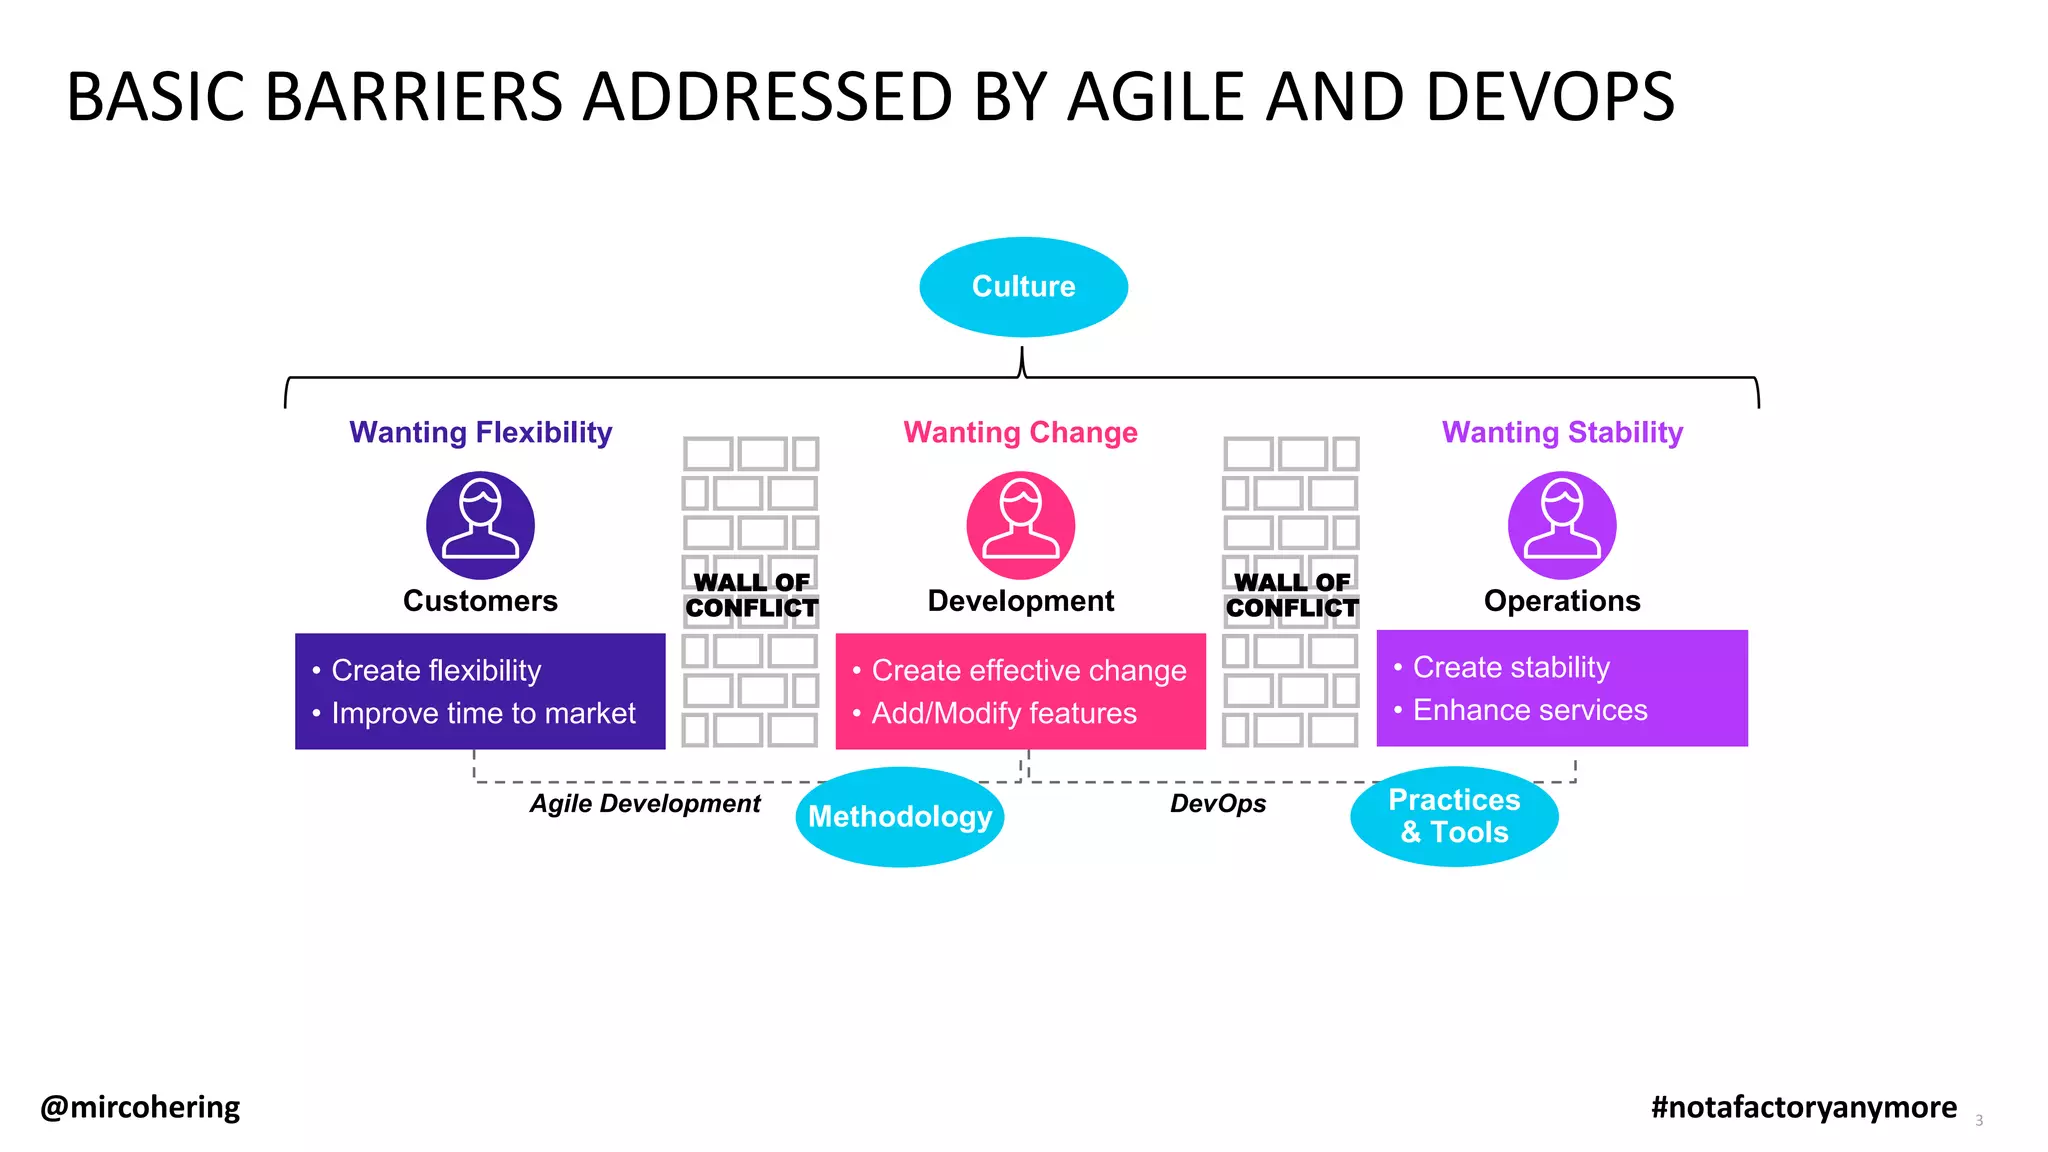
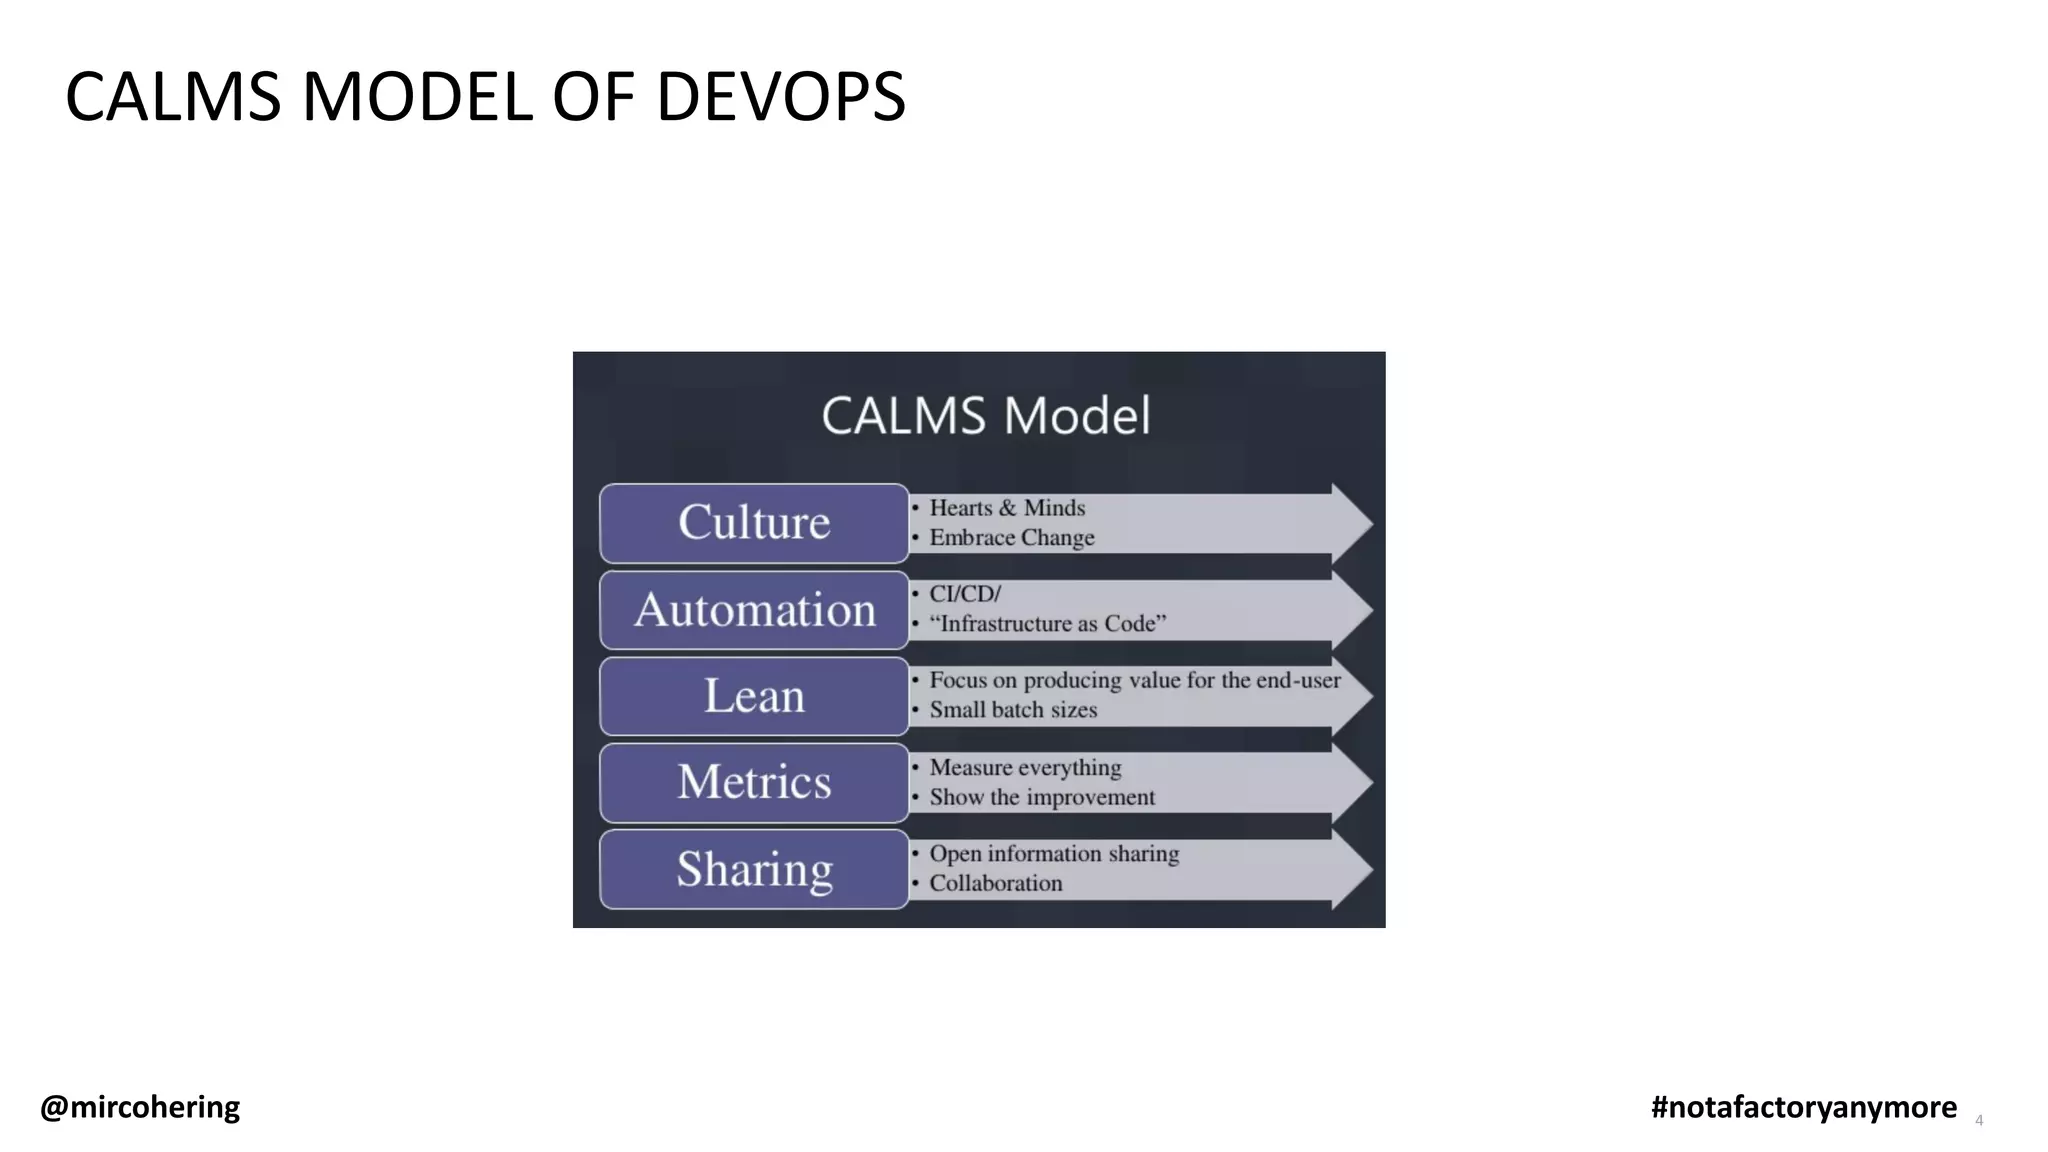
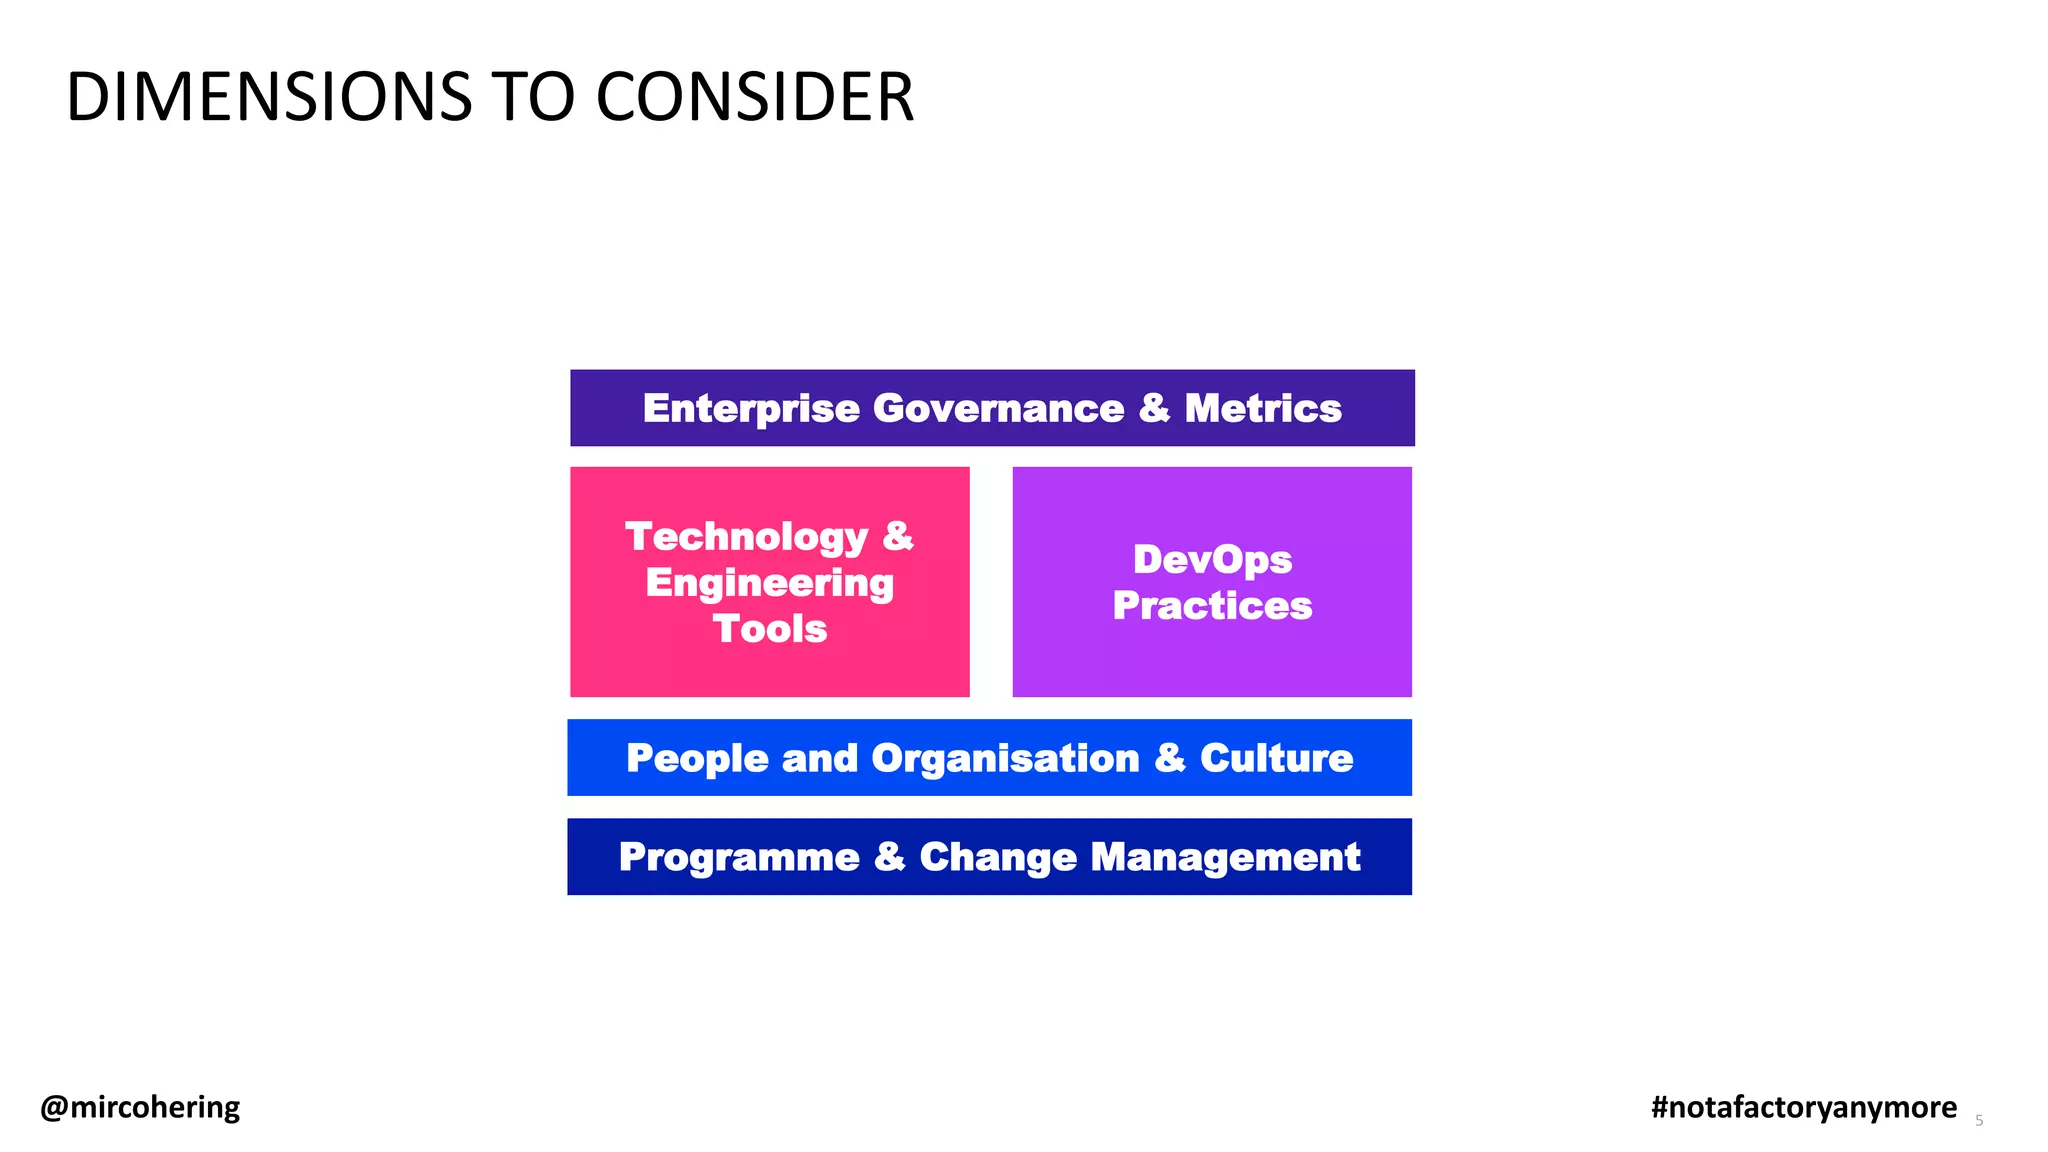
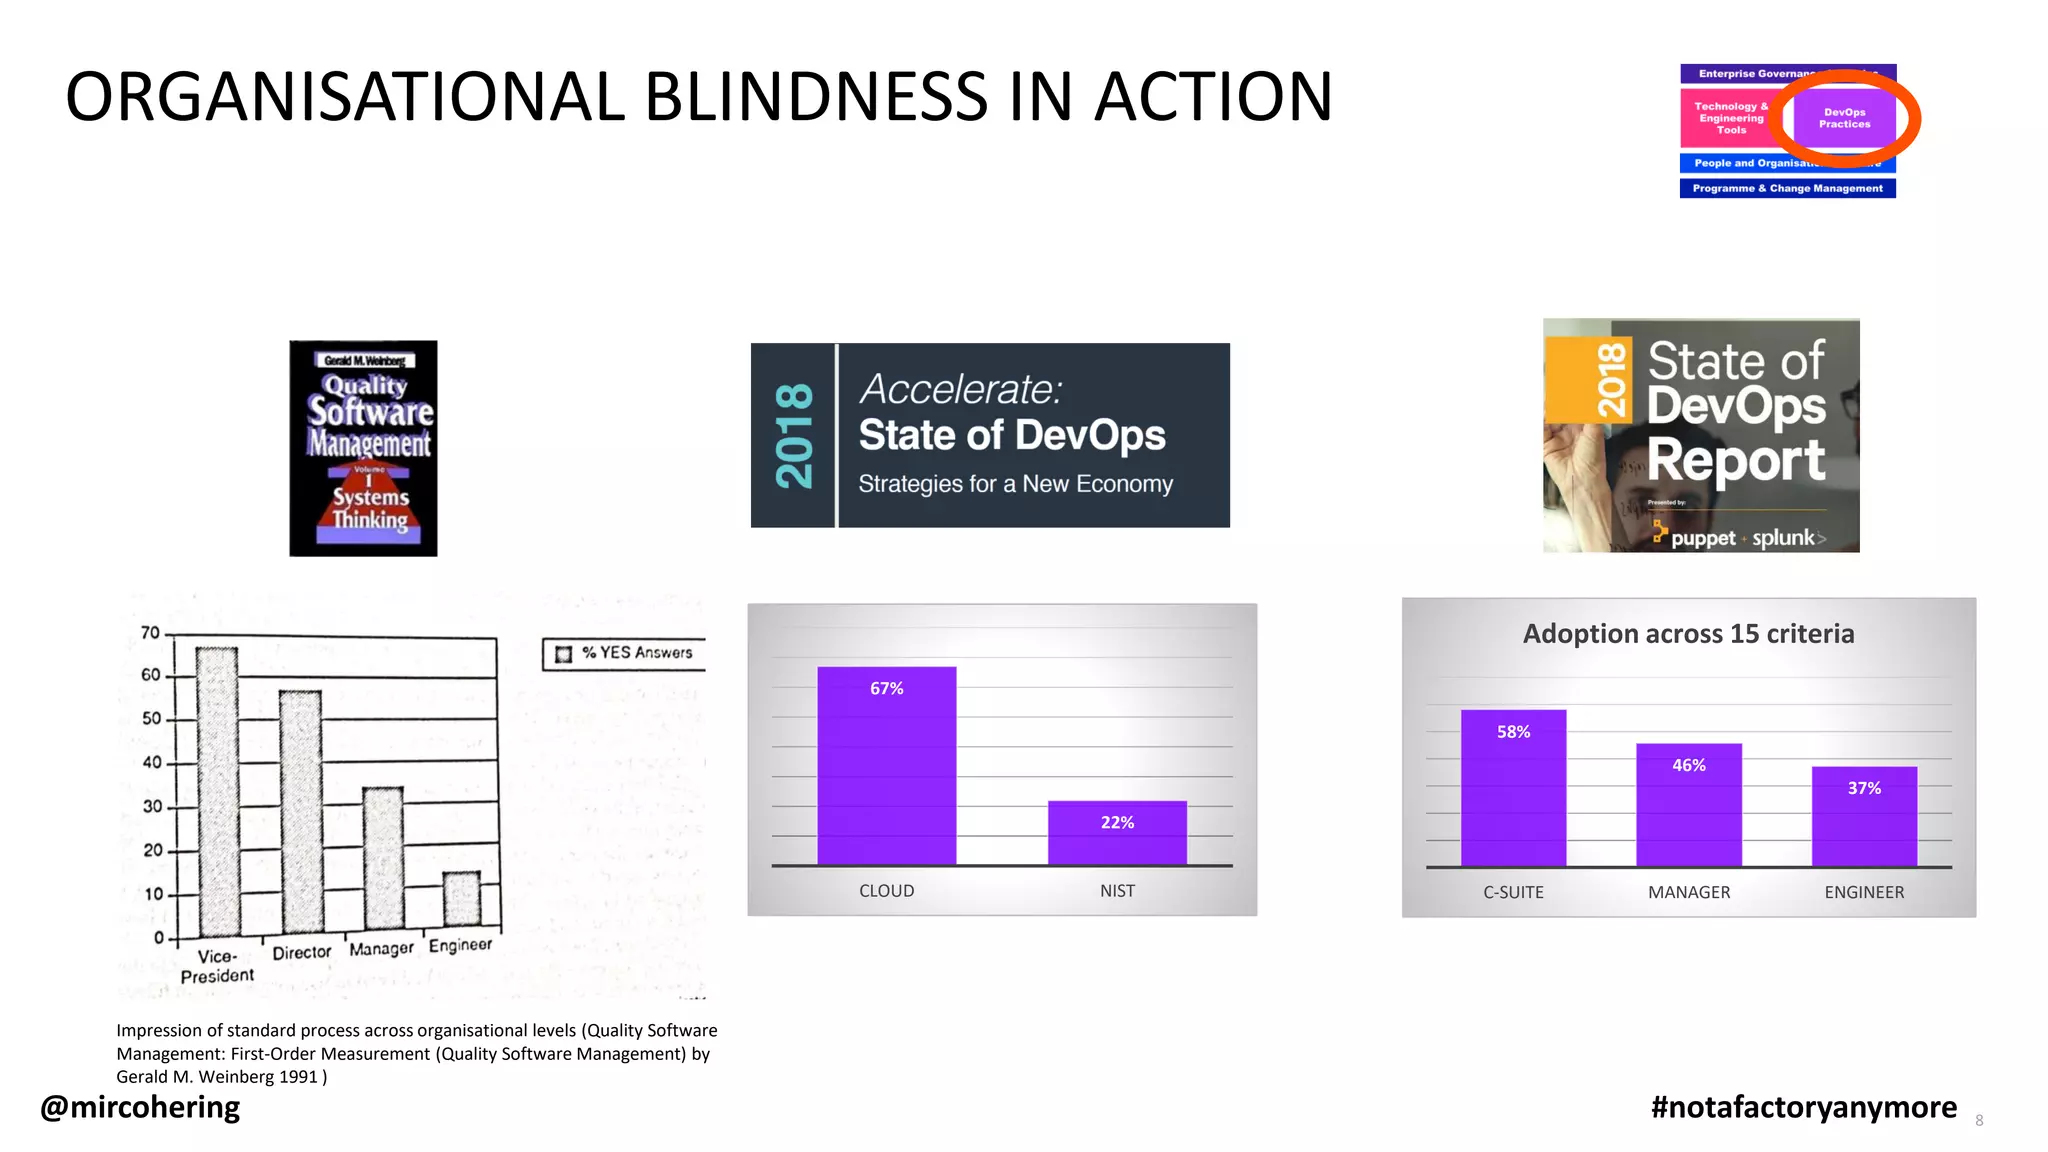
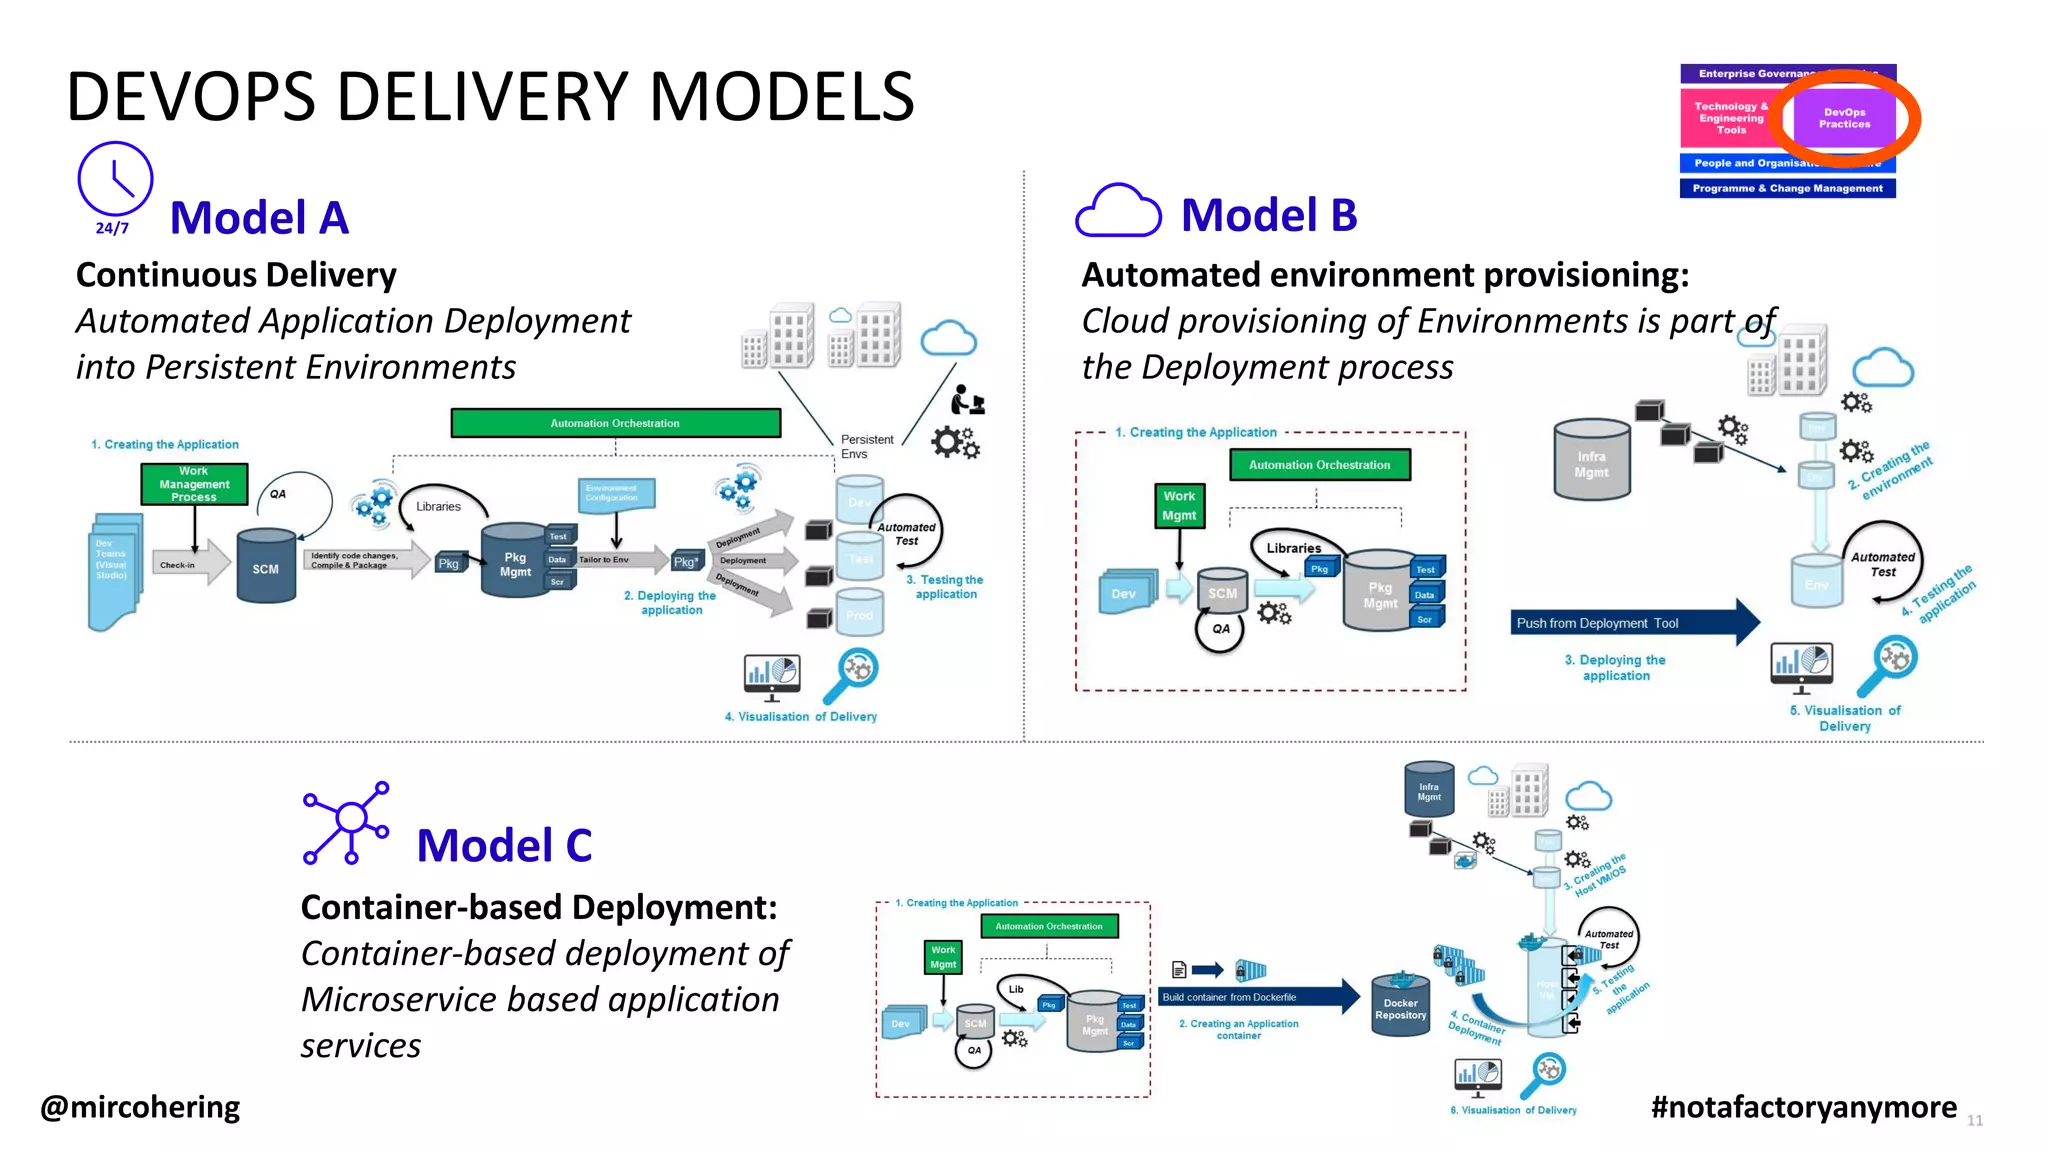

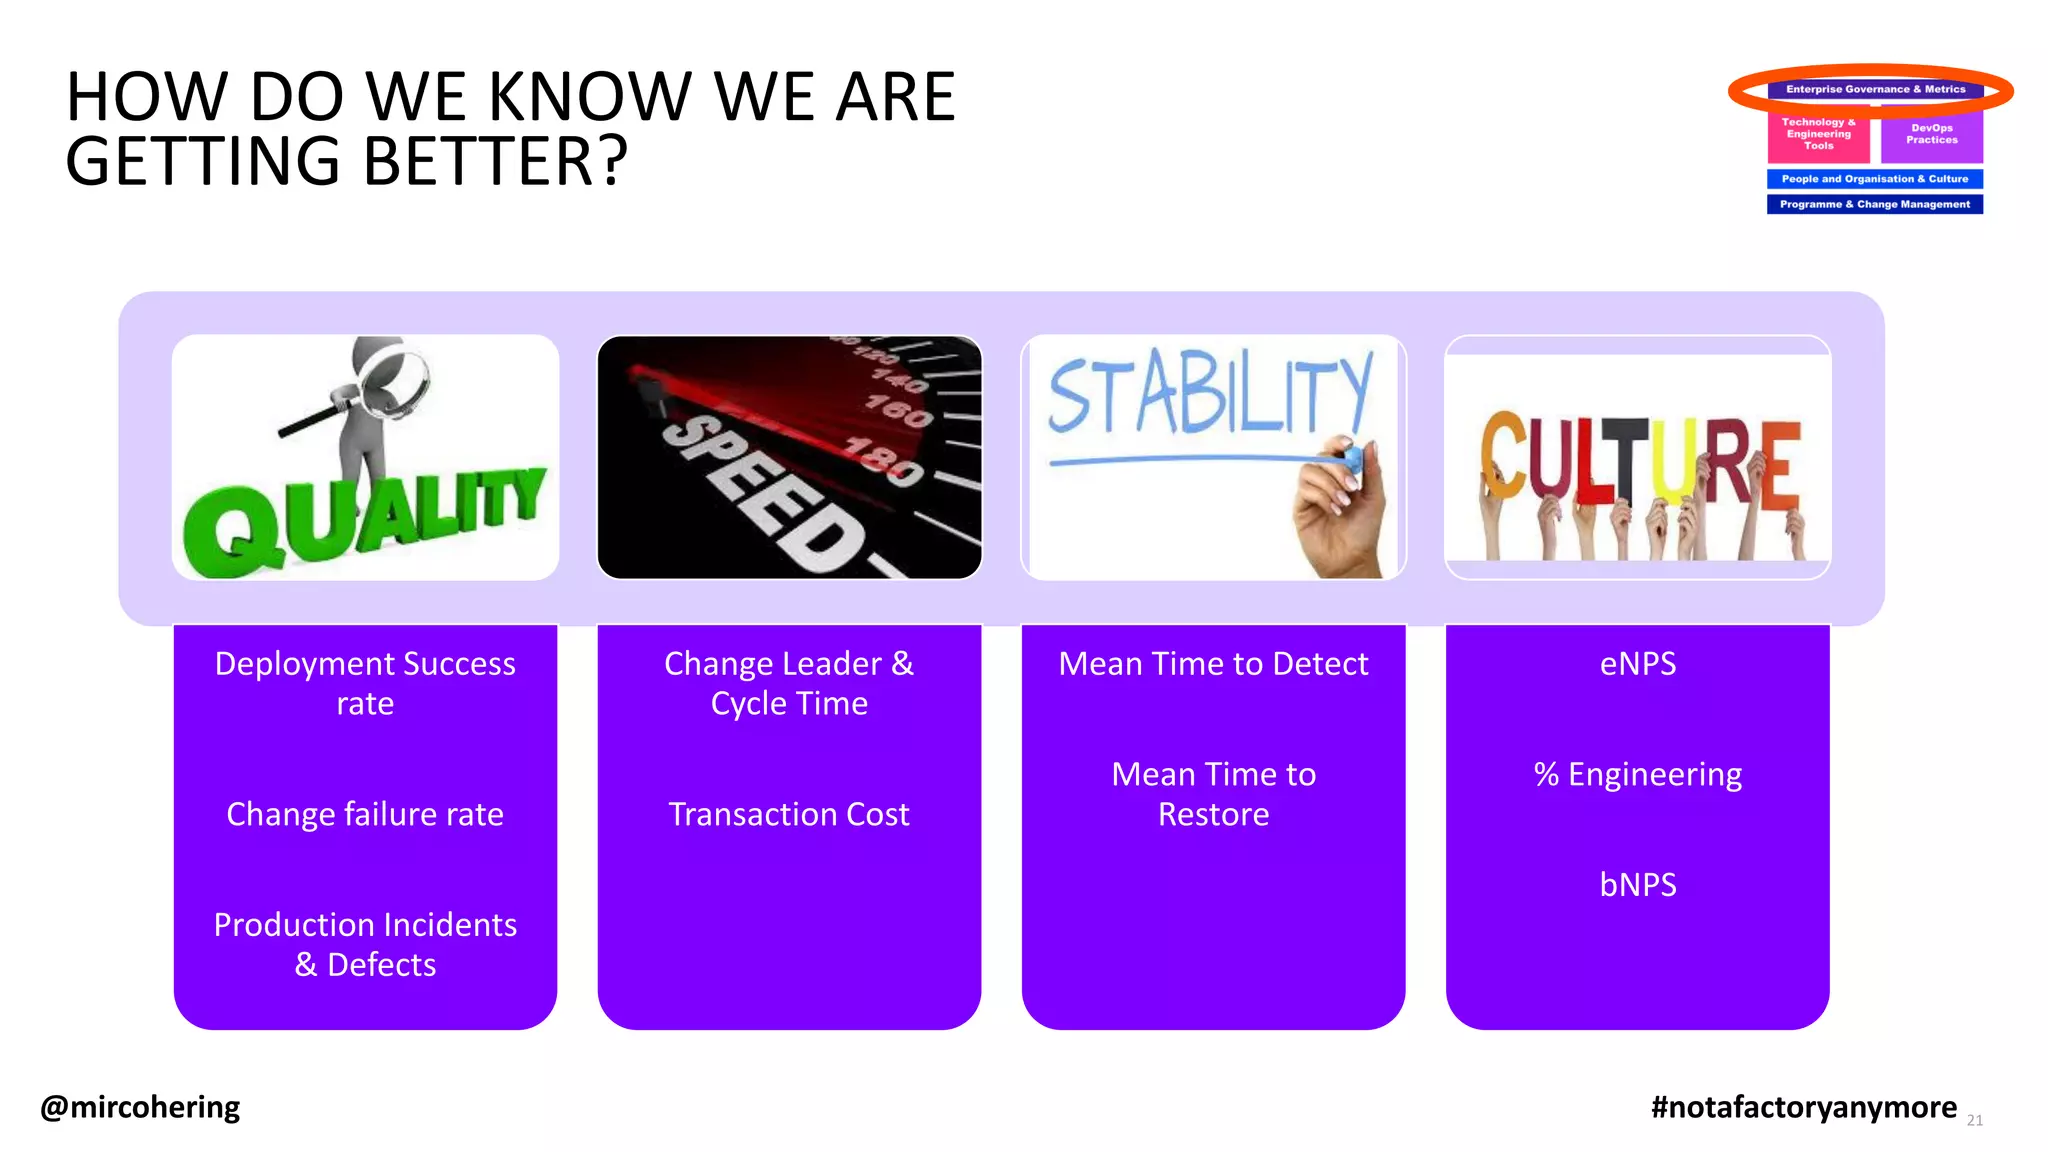

This document discusses eliminating barriers between development and operations teams through adopting a DevOps culture and shared practices. It addresses basic conflicts between wanting change versus stability and flexibility versus control. It presents models for DevOps delivery and dimensions to consider in people, processes, tools and governance. Challenges in culture change are discussed, with games used as an analogy for maturity. Metrics for measuring DevOps progress are proposed.