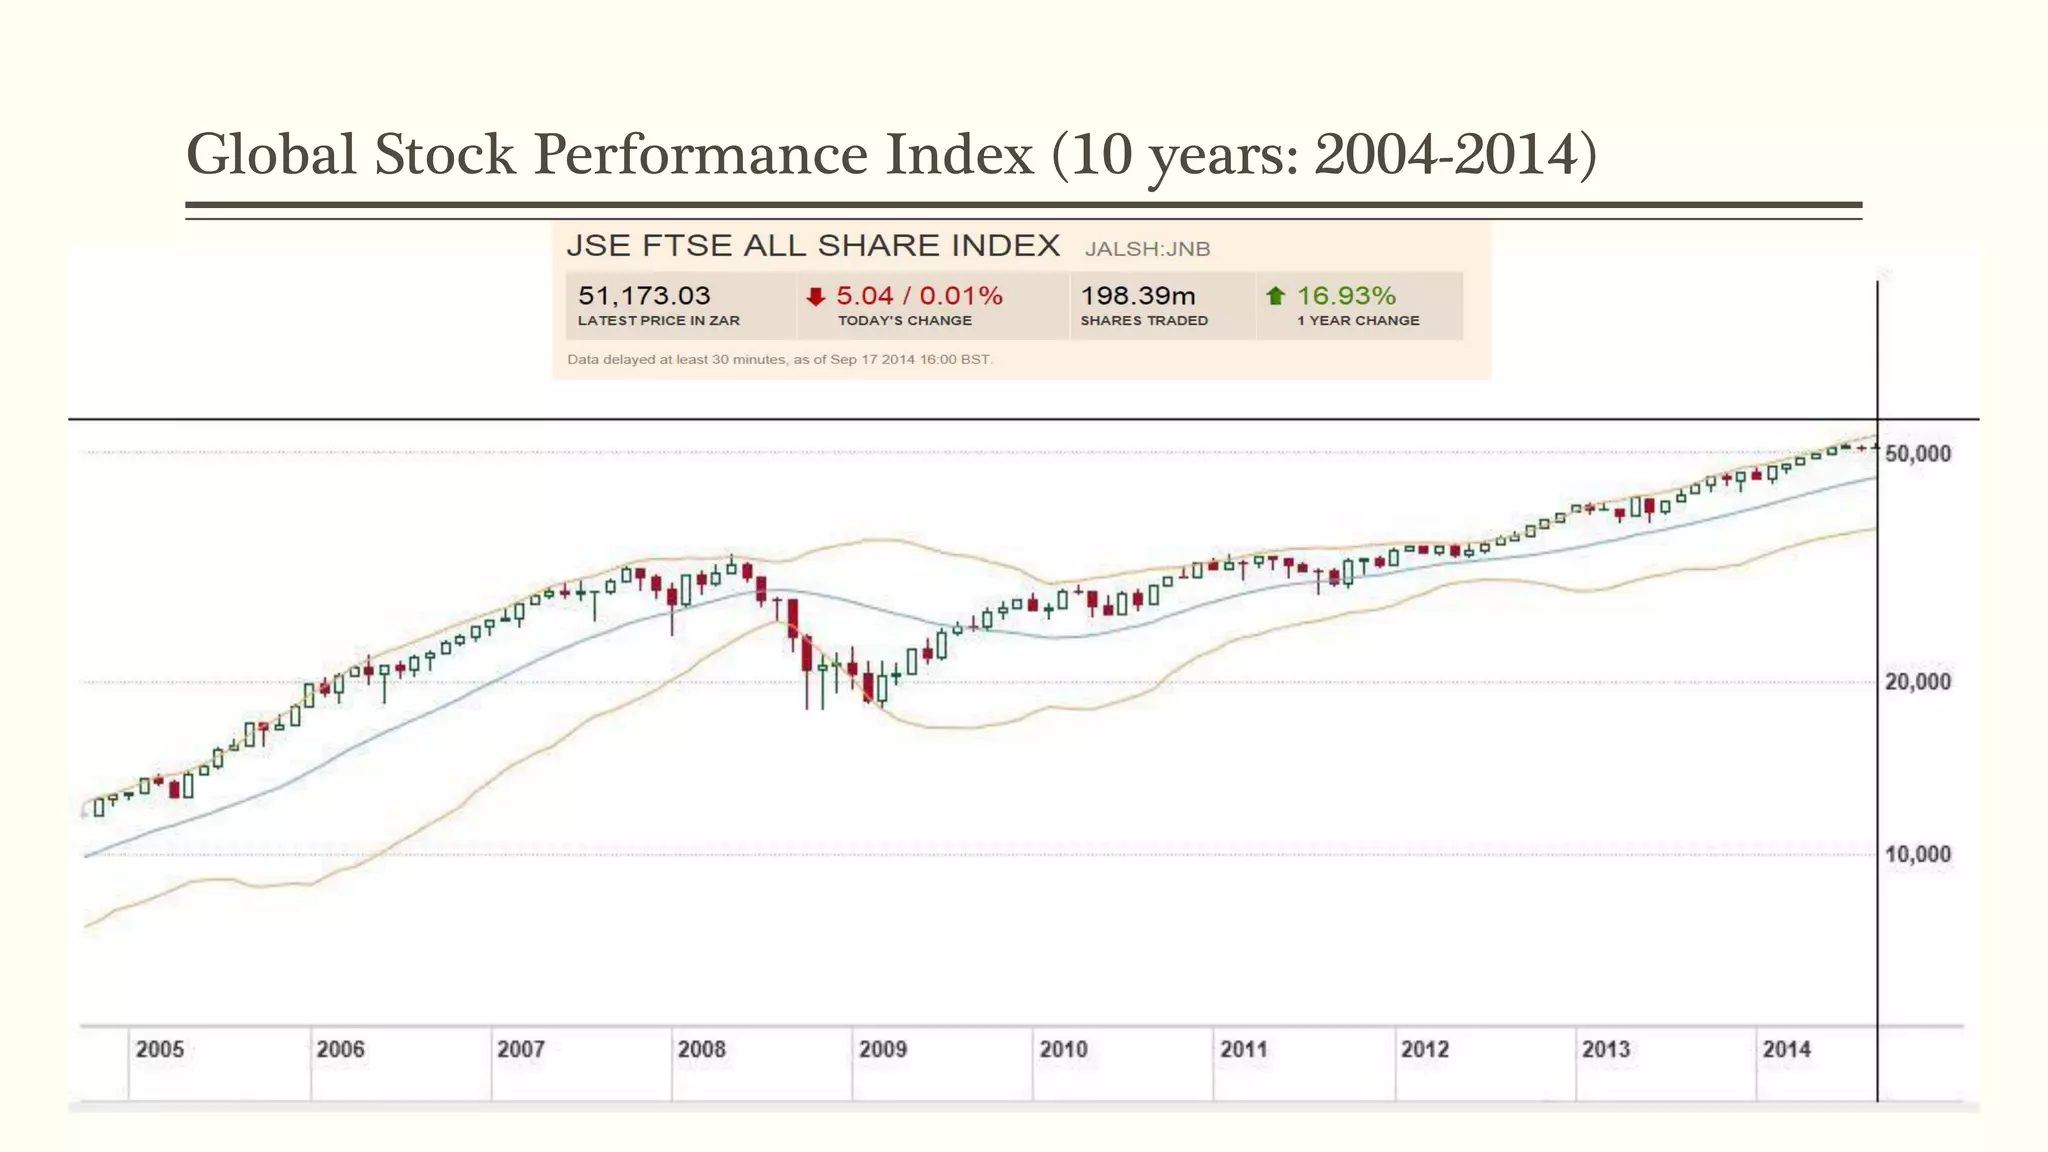
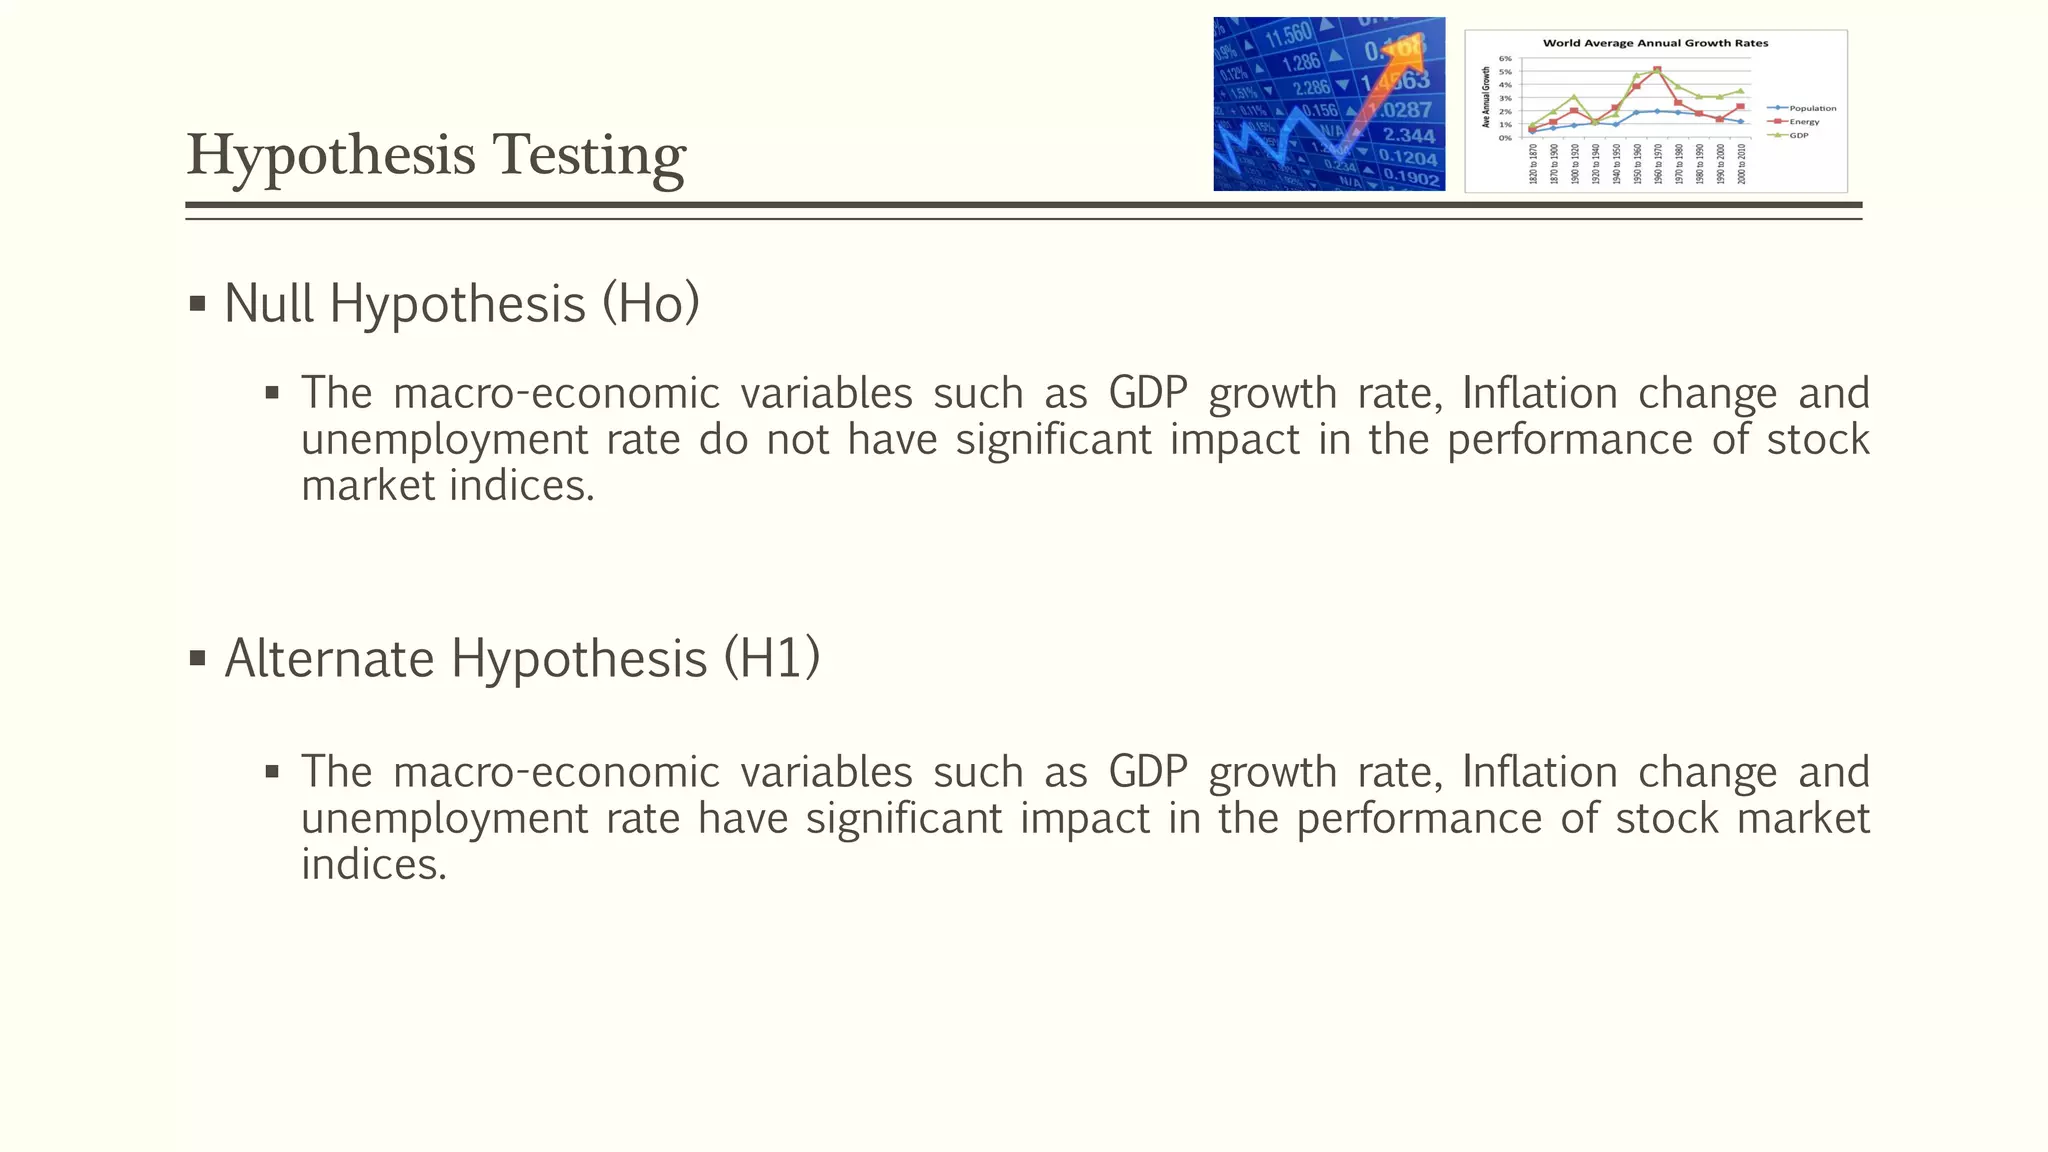
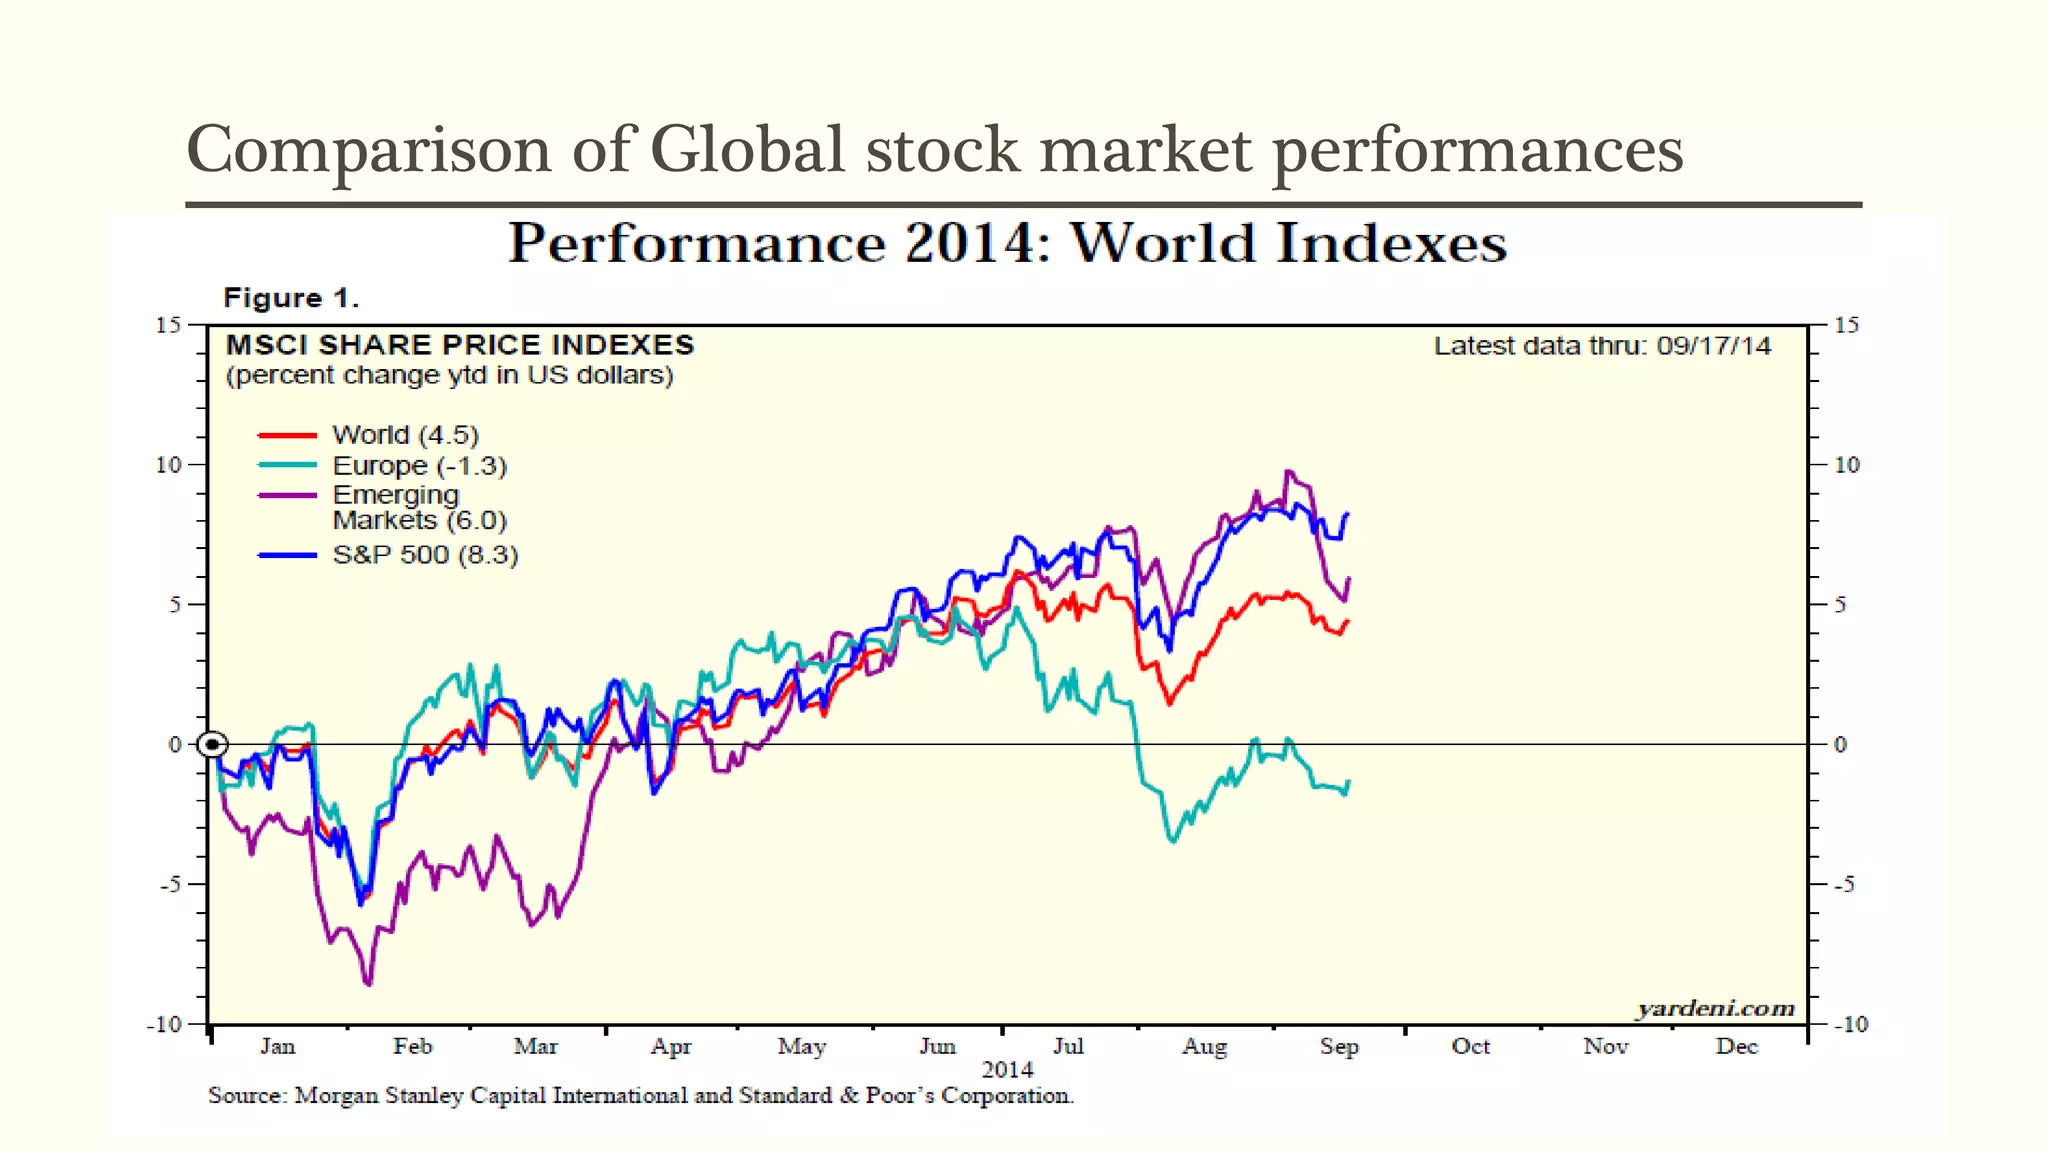
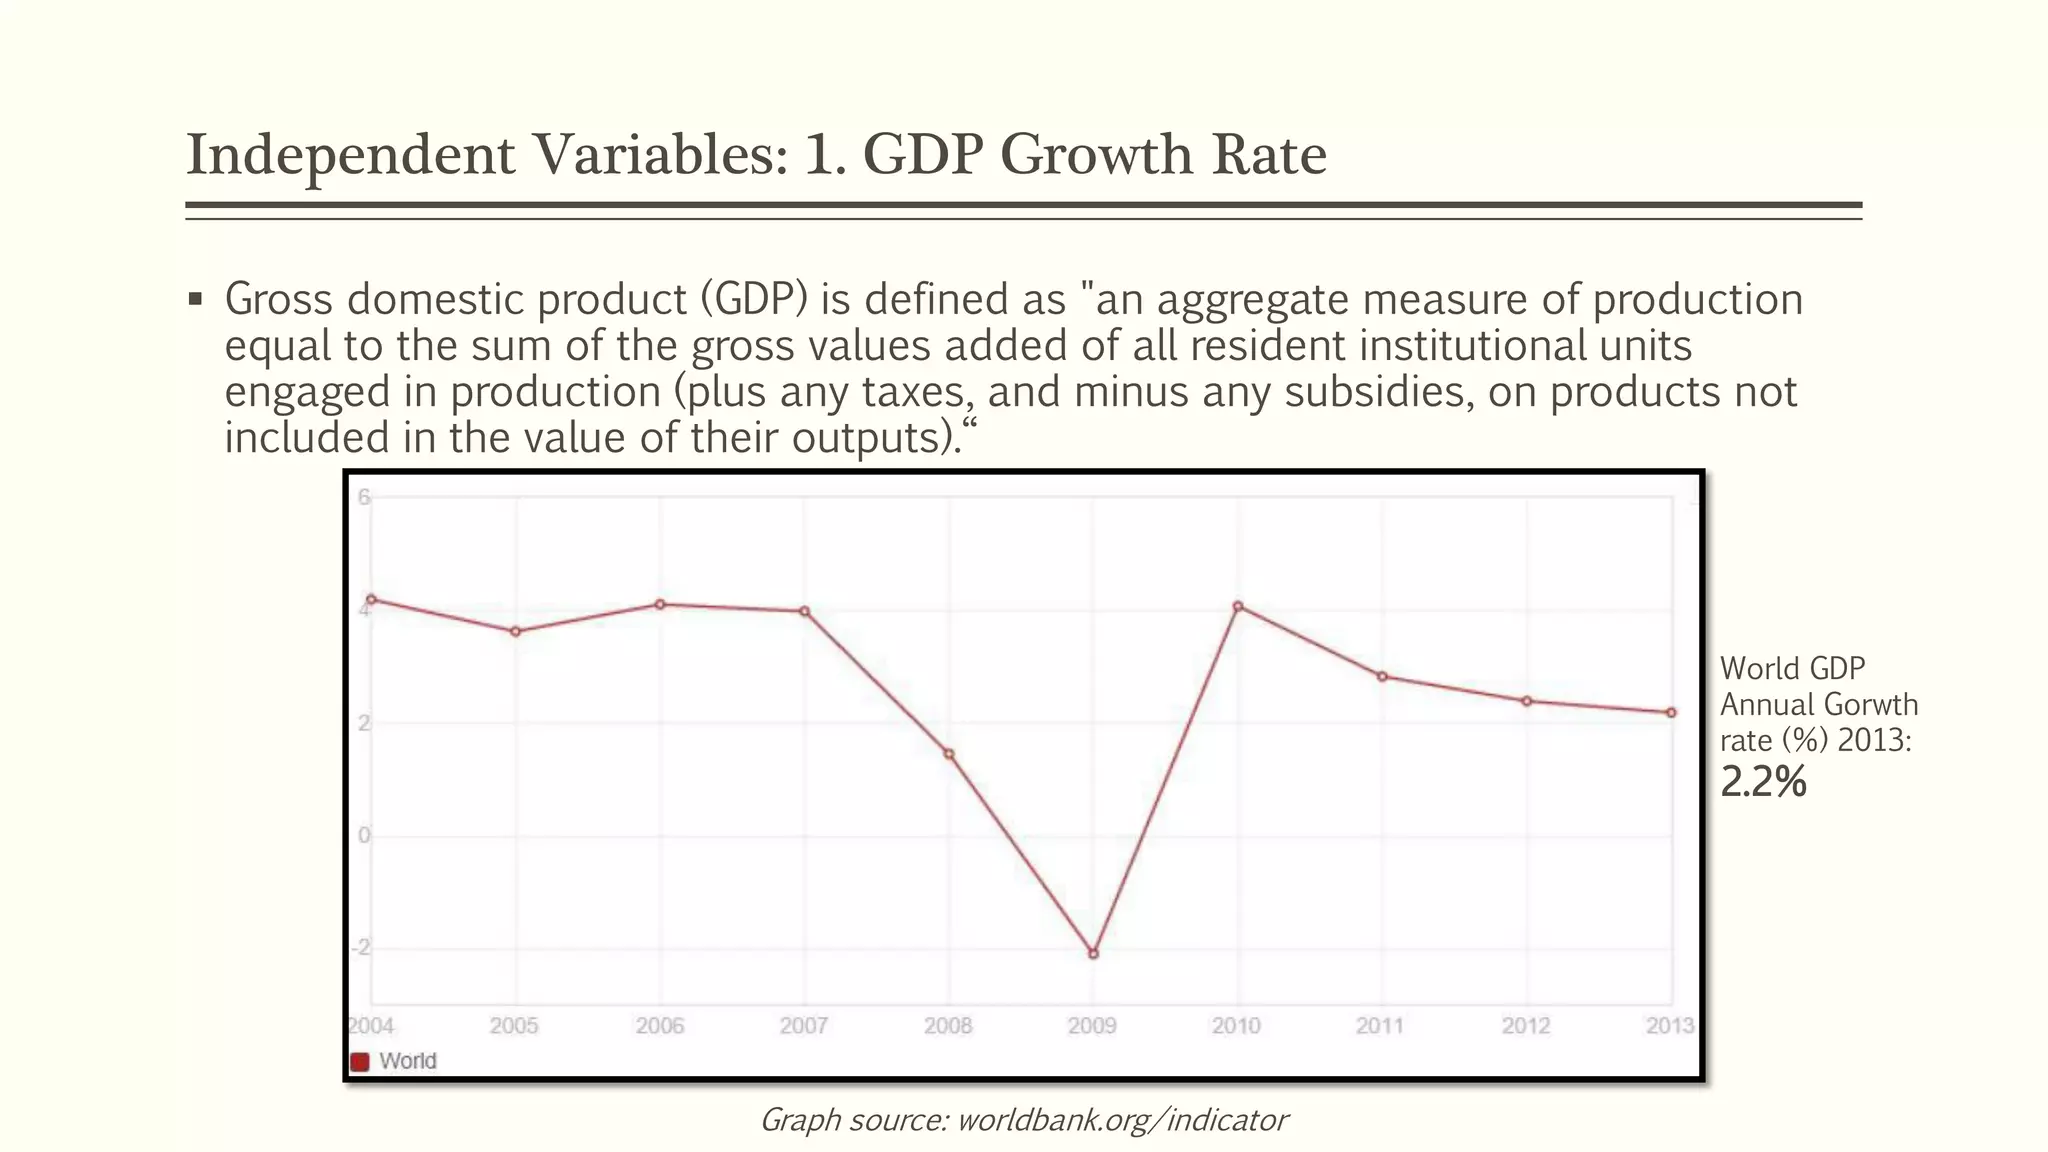
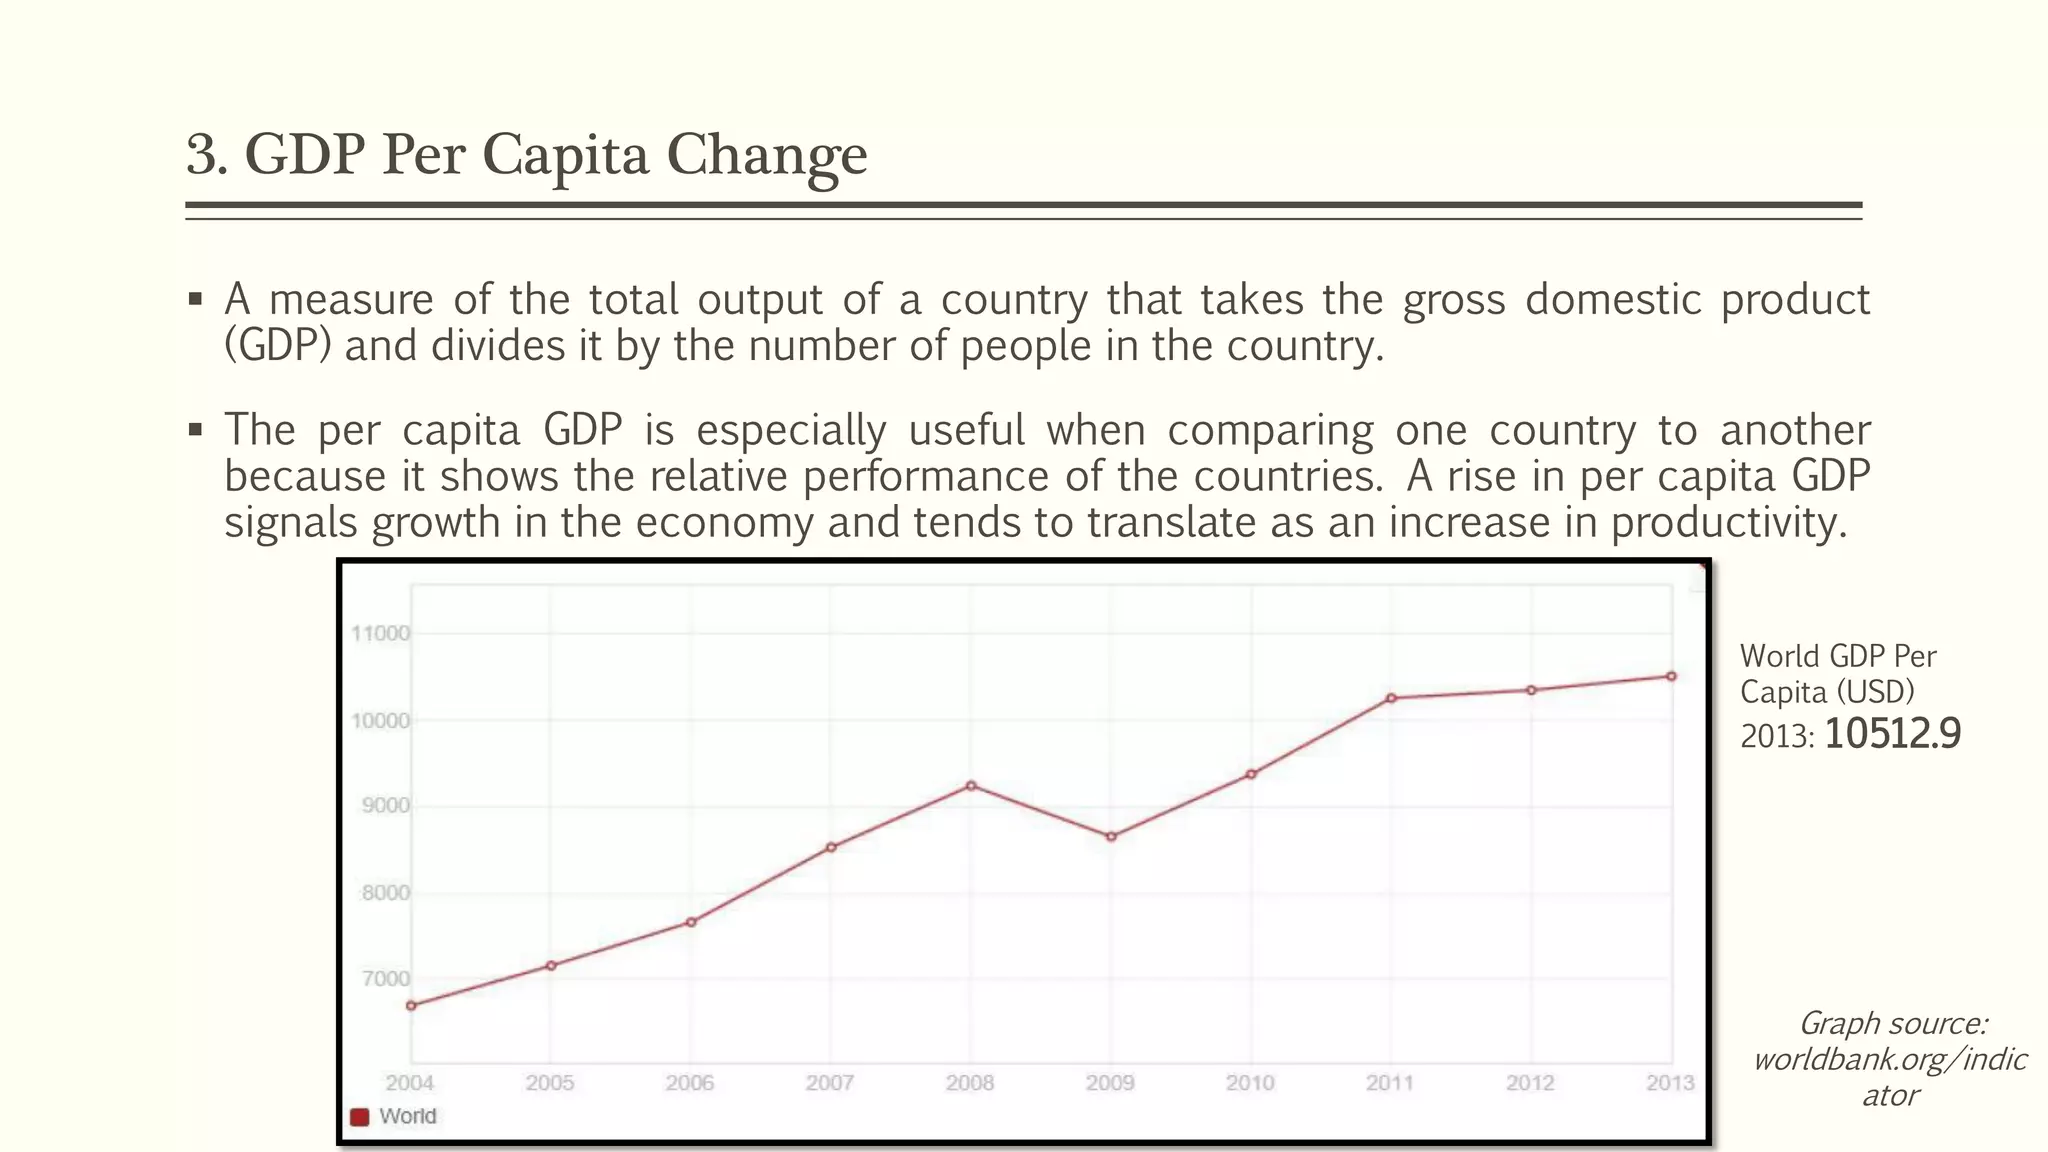
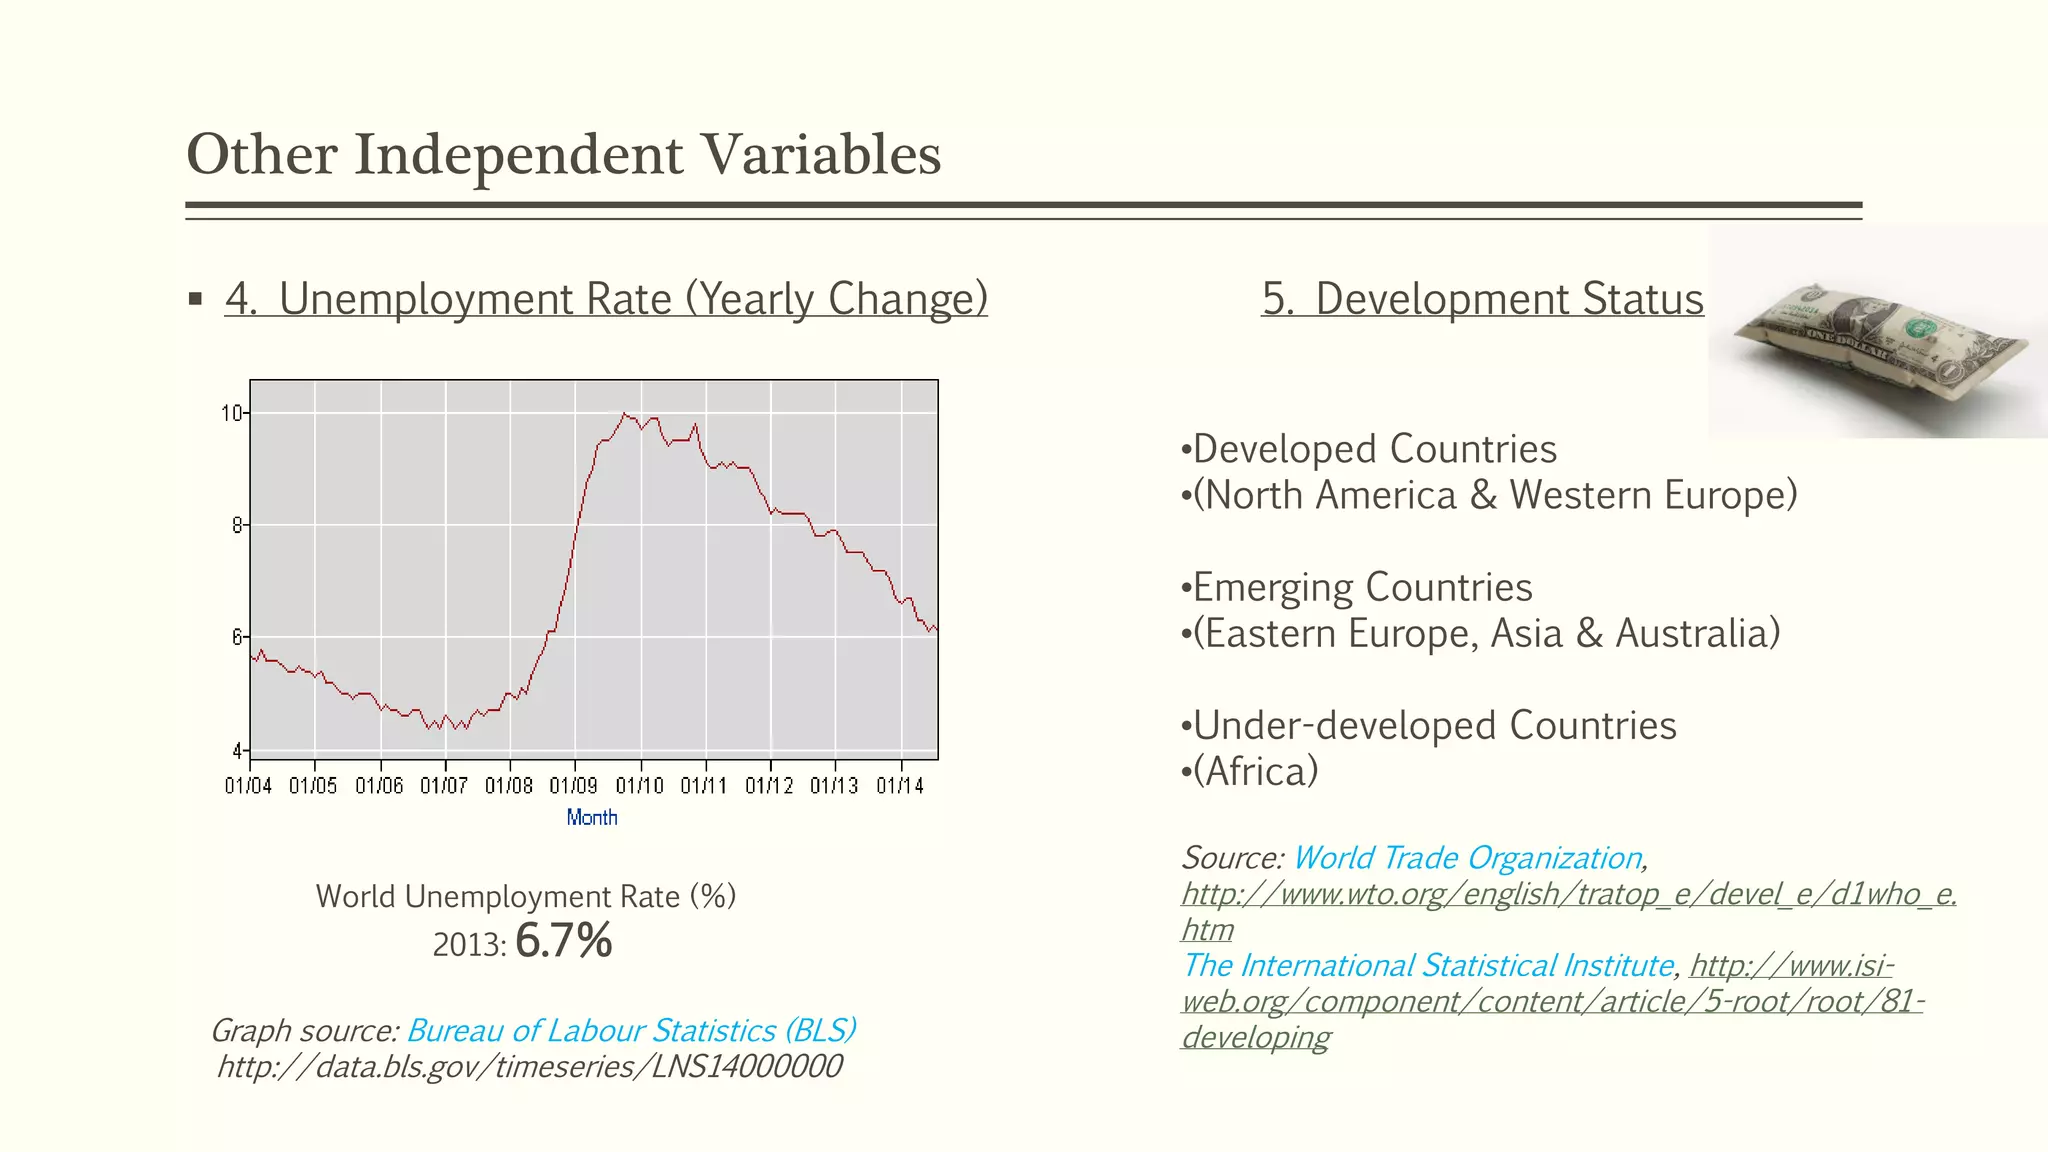
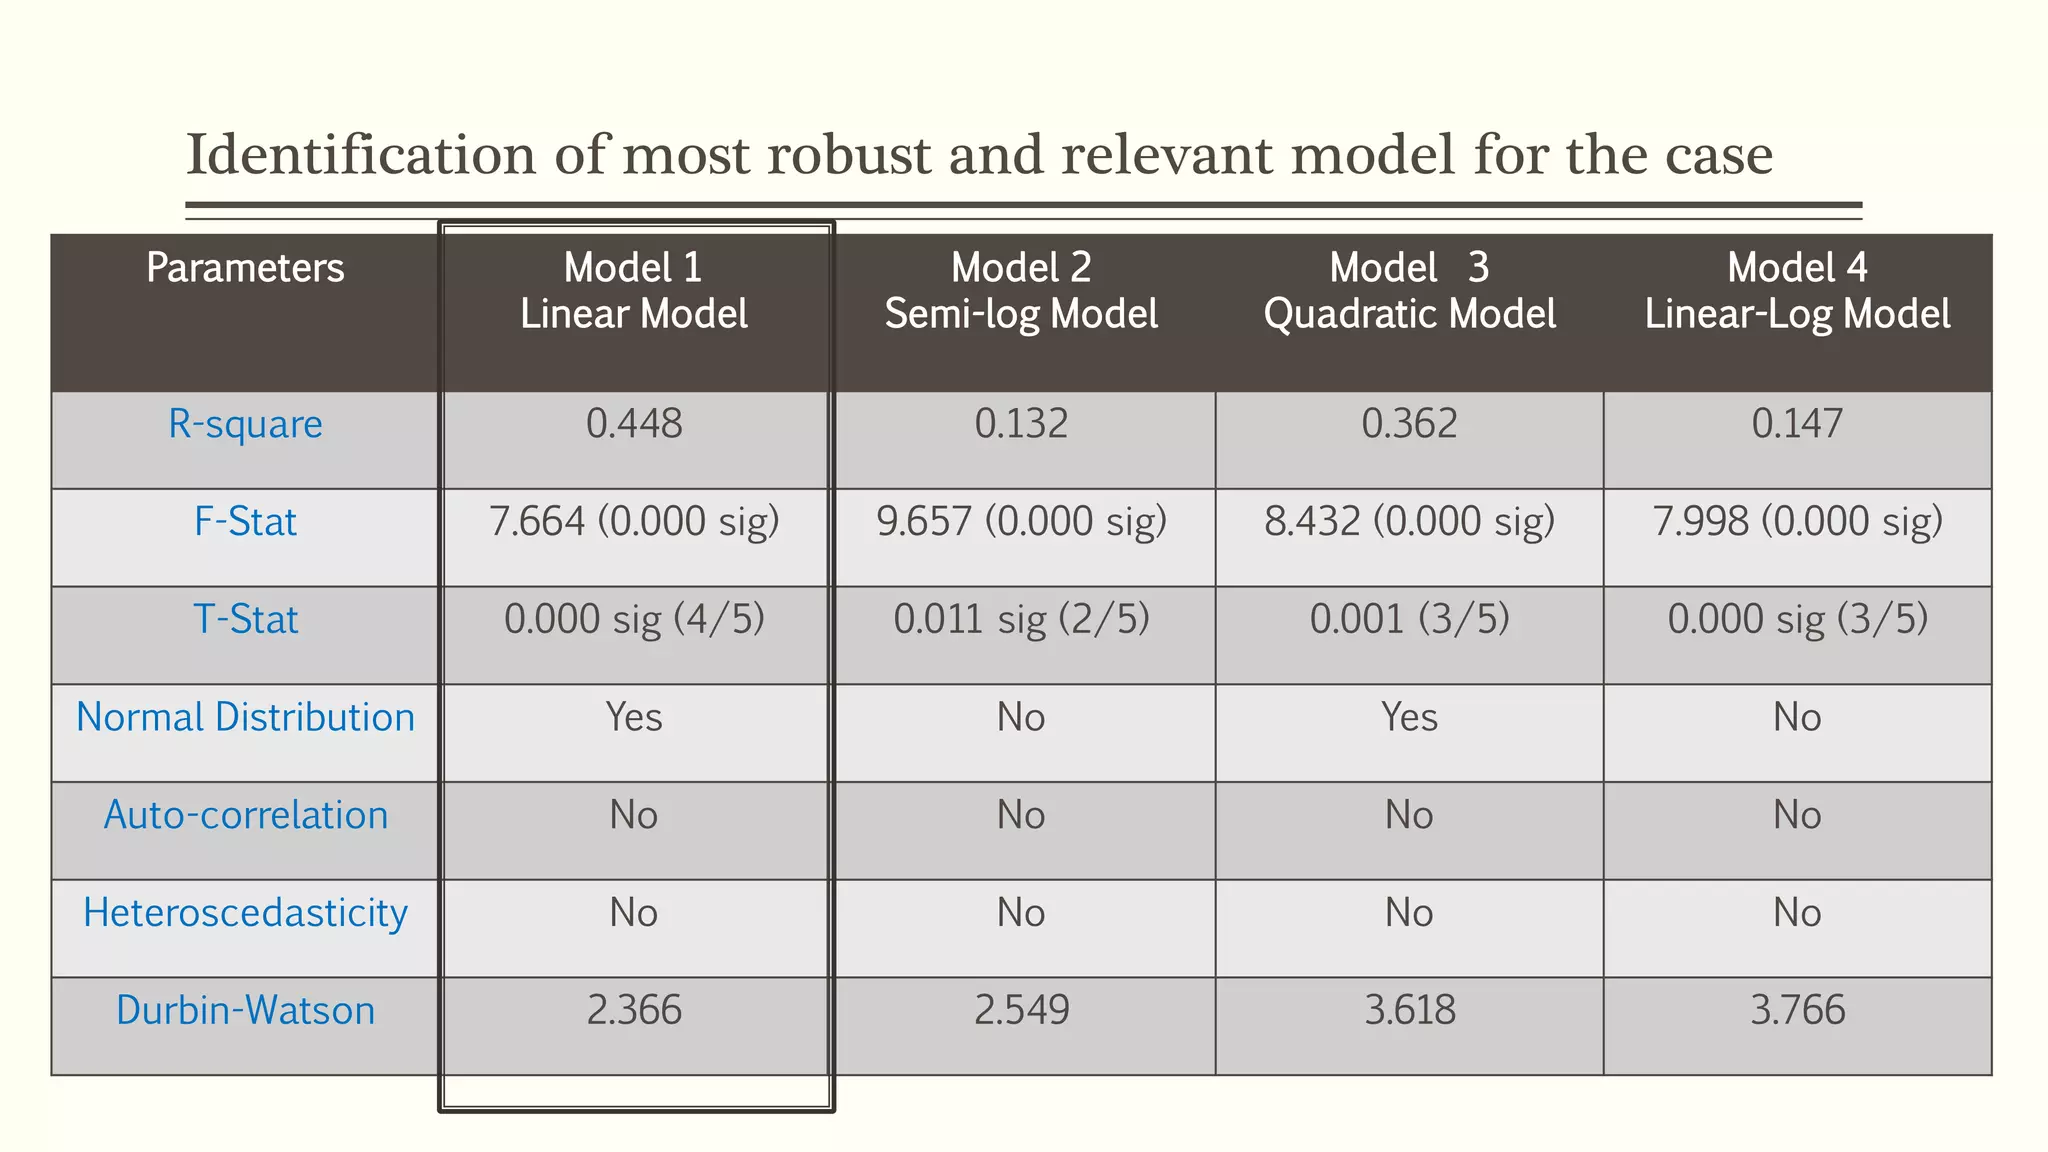
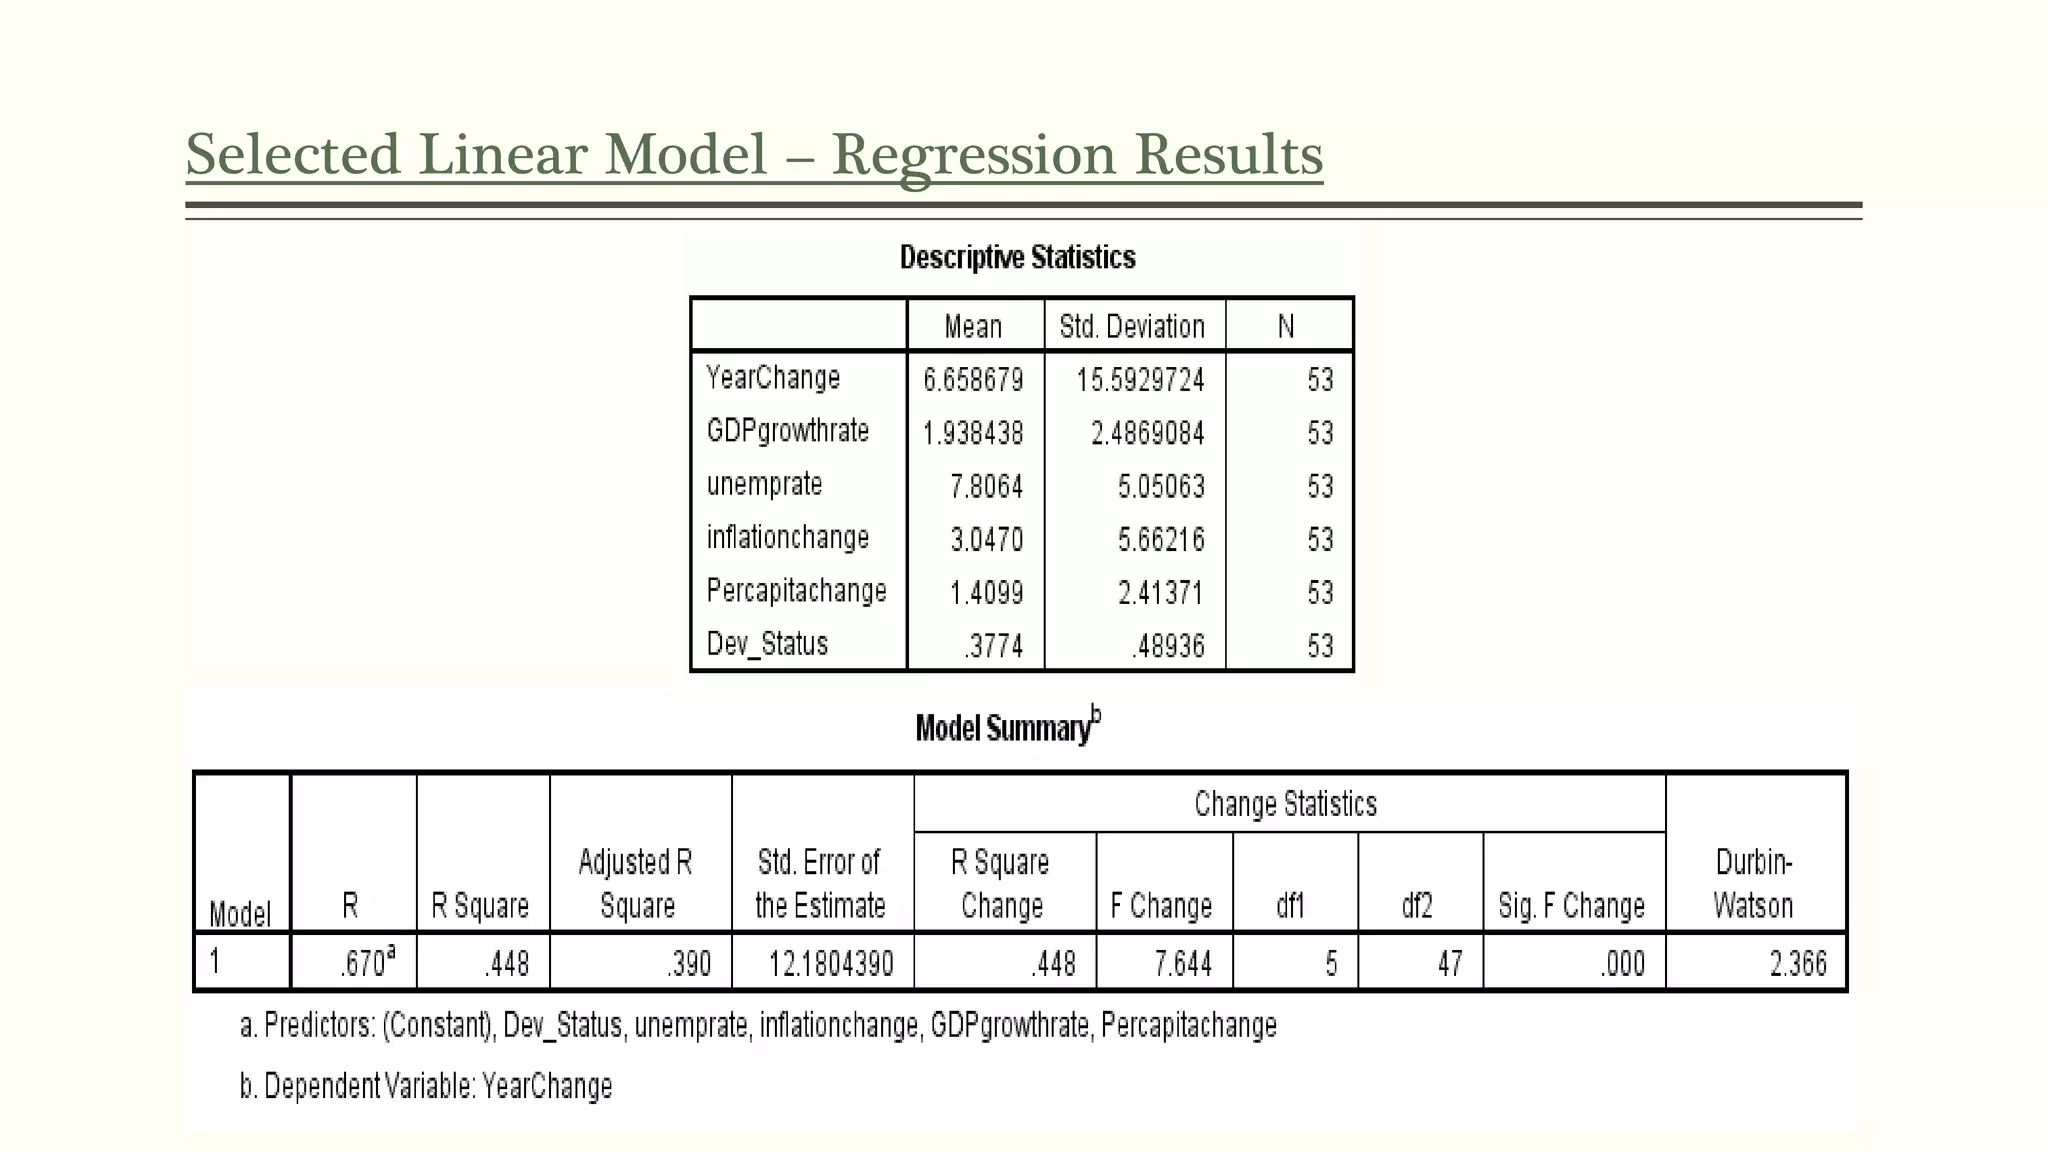
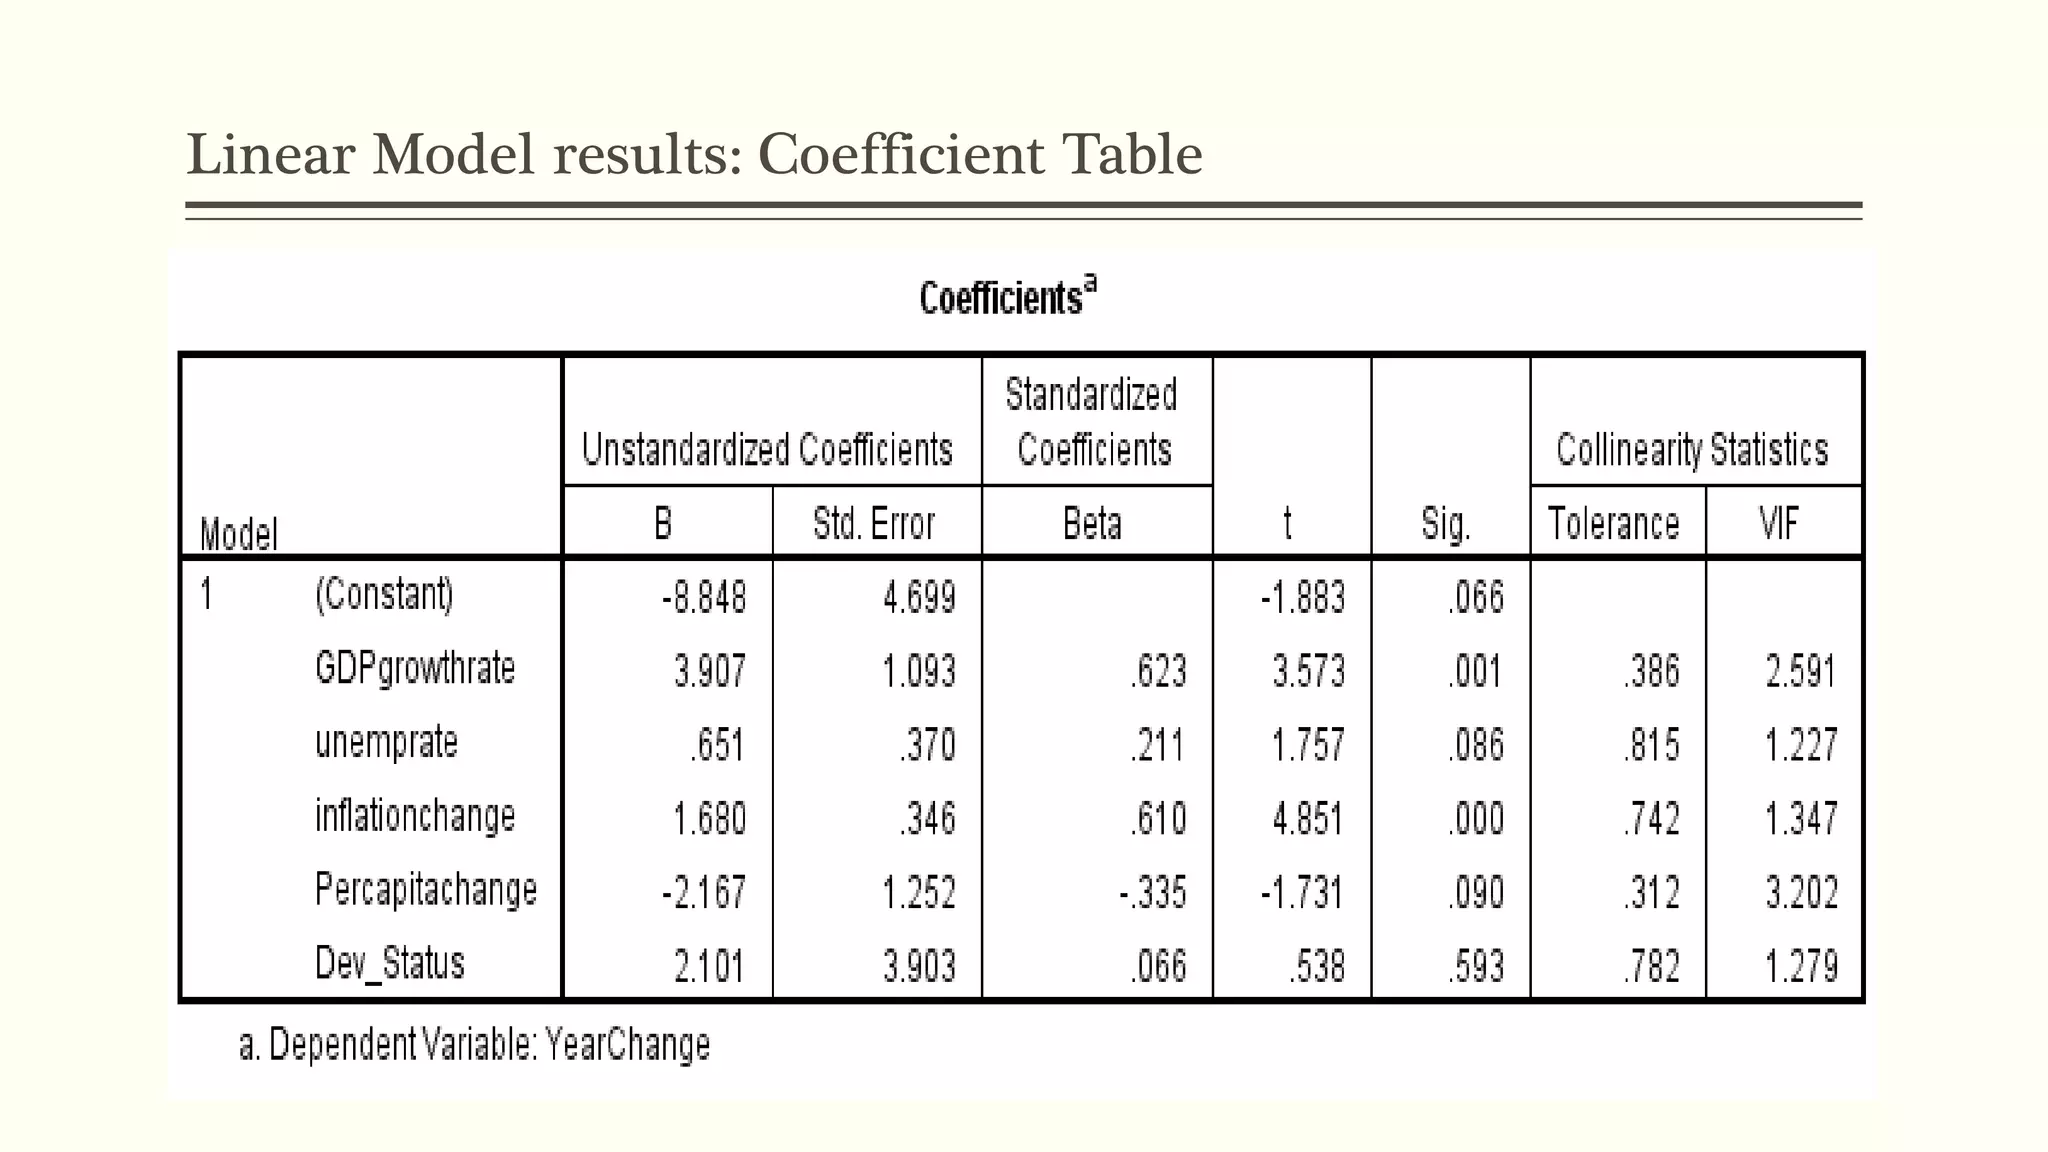
IMPACT OF MACRO-ECONOMIC 
VARIABLES IN 
THE PERFORMANCE OF 
GLOBAL STOCK MARKETS 
Devanayagam 
Econometrics Project Presentation 18th September 2014 
www.twitter.com/Devanayagam 
Email: deva.4356@gmail.com
Agenda 
 Project Overview 
 Hypothesis Listing 
 Literature Review 
 Testing of Hypothesis 
 Comparison of models 
 Global Stock markets 
 Introduction 
 Examples 
 Dependent & Independent Variables 
 Performance of global stock markets 
 Significance of results 
 Recommendations
Global Stock Performance Index (10 years: 2004-2014)
How much significance does the macro-economic 
variables contribute to the performance of global 
stock markets?
Do you know that the emerging markets 
contribute to as much as 6% percent change in 
YTD as of 2014 performance reports?!
The stock market index change in India is 24% in 
YTD USD as of 2014 making it the biggest gainer 
in Asia - Pacific
This project identifies the significance in stock 
price changes with respect to change in macro-economic 
variables in the world.
Hypothesis Testing 
 Null Hypothesis (Ho) 
 The macro-economic variables such as GDP growth rate, Inflation change and 
unemployment rate do not have significant impact in the performance of stock 
market indices. 
 Alternate Hypothesis (H1) 
 The macro-economic variables such as GDP growth rate, Inflation change and 
unemployment rate have significant impact in the performance of stock market 
indices.
Literature Review 
 ͒Tˊˇ capital market promotes economic growth and prosperity by providing an investment 
channel that contributes to attract domestic and foreign capital.͓ (Sangmi, Mohi-u-Din, Macro-economic 
variables on Stock Market Interactions: The Indian Experience, Kashmir University, May-June 2013) 
 ͒However, interest in investing in emerging markets has grown considerably over the past 
decade. Harvey (1995a) shows that returns and risks in Emerging Stock Markets have been 
found to be higher, relative to developed markets.͓ (Bayzeid, Muhammad, Impact of Micro and 
Macroeconomic Variables on ESM Return: A case on Dhaka Stock Exchange, Jagannath University, May 2011) 
 ͒The rational expectations hypothesis offered a new perspective on the formation of prices. 
The general idea behind this hypothesis is that economic agents use both past experiences 
aːˆ ˖ˊˇˋ˔ ˇ˚˒ˇ˅˖a˖ˋˑː˕ aːˆ ˒˔ˇˆˋ˅˖ˋˑː˕ ˑˈ ˖ˊˇ ˈ˗˖˗˔ˇ ˖ˑ ˆˇ˖ˇ˔ˏˋːˇ ˖ˊˇ ˒˔ˋ˅ˇ ˑˈ aː a˕˕ˇ˖ ˖ˑˆa˛.͓ 
(Taulbee, Nathan, Influences of the Stock Market, An Examination of the effect of economic variables on the S&P 500, 
January 2014) 
 ͒The study of Robert Johnson (2010) shows significant and direct relationship between inflation 
and real output. Relationship between stock index and real output in current period is positive 
aːˆ ˕ˋˉːˋˈˋ˅aː˖.͓ (Salman Khan, Muhammad, Macro-economic Variables & its impact on KSE-100 Index, 
November 2013)
Global Stock Markets - Introduction 
͒A stock market or equity market is the aggregation of buyers and sellers, a loose network of economic transactions, not 
a physical facility or discrete entity, of stocks (also called shares); these may include securities listed on a stock 
exchange a˕ ˙ˇˎˎ a˕ ˖ˊˑ˕ˇ ˑːˎ˛ ˖˔aˆˇˆ ˒˔ˋ˘a˖ˇˎ˛.͓
Comparison of Global stock market performances
World's 40 best-performing stock markets in 2013 
Source: money.cnn.com
Emerging Stock Markets (ESMs) : Stock Market performance
World’s Largest Stock Exchanges (based on Market Cap) 
 With technology advancing and barriers to entry falling just as rapidly, the exchange 
game is a dynamic industry these days. 
 Emerging markets are on the rise, but in terms of overall market capitalization, the 
historical powers are still the largest. 
 All data are from the World Federation of Exchanges' 2013 market report. 
 Here we list the top 5. Here we go..
1. New York Stock Exchange (NYSE), US 
Market Cap: $13.4 trillion
2. NASDAQ 
Market Cap: $3.9 trillion
3. Tokyo Stock Exchange 
Market Cap: $3.8 trillion
4. London Stock Exchange 
Market Cap: $3.6 trillion
5. Euro Next 
Market Cap: $2.9 trillion
Project Data 
 Sample Size: 53 (top performing 53 effective and regulated stock exchanges in the 
world) 
 Spread across 49 countries around the world 
 Indices: Yearly change of stock price indices 
 Other Data 
 Population 
 GDP (in USD) 
 GDP Growth Rate 
 GDP Per Capita 
 Inflation (consumer prices) 
 Unemployment rate (long term unemployment) 
Source: worldbank.org/indicators
Dependent and Independent Variables 
 Dependent Variable 
 Yearly change in global stock market indices 
 Independent Variables (yearly change) 
 GDP growth rate 
 Inflation change (consumer prices) 
 Unemployment Rate change 
 Development Status of nations 
 GDP per capita change
Yearly Change in Global Stock Market Indices 
 Global Stock exchanges are measured by Stock market indices which are influenced 
by prevailing economic conditions of the respective country. 
 A stock index or stock market index is a measurement of the value of a section of 
the stock market. It is computed from the prices of selected stocks (typically 
a weighted average). 
 It is a tool used by investors and financial managers to describe the market, and to 
compare the return on specific investments. 
 Ex:
Independent Variables: 1. GDP Growth Rate 
 Gross domestic product (GDP) is defined as "an aggregate measure of production 
equal to the sum of the gross values added of all resident institutional units 
engaged in production (plus any taxes, and minus any subsidies, on products not 
ˋː˅ˎ˗ˆˇˆ ˋː ˖ˊˇ ˘aˎ˗ˇ ˑˈ ˖ˊˇˋ˔ ˑ˗˖˒˗˖˕).͒ 
World GDP 
Annual Gorwth 
rate (%) 2013: 
2.2% 
Graph source: worldbank.org/indicator
2. Inflation Change (Consumer Prices) 
Inflation is a sustained increase in the general price level of goods and services in 
an economy over a period of time. When the general price level rises, each unit of currency buys 
Graph source: worldbank.org/indicator 
fewer goods and services. 
World Inflation 
(%) 2013: 2.7%
3. GDP Per Capita Change 
 A measure of the total output of a country that takes the gross domestic product 
(GDP) and divides it by the number of people in the country. 
 The per capita GDP is especially useful when comparing one country to another 
because it shows the relative performance of the countries. A rise in per capita GDP 
signals growth in the economy and tends to translate as an increase in productivity. 
World GDP Per 
Capita (USD) 
2013: 10512.9 
Graph source: 
worldbank.org/indic 
ator
Other Independent Variables 
 4. Unemployment Rate (Yearly Change) 5. Development Status 
World Unemployment Rate (%) 
2013: 6.7% 
Graph source: Bureau of Labour Statistics (BLS) 
http://data.bls.gov/timeseries/LNS14000000 
•Developed Countries 
•(North America & Western Europe) 
•Emerging Countries 
•(Eastern Europe, Asia & Australia) 
•Under-developed Countries 
•(Africa) 
Source: World Trade Organization, 
http://www.wto.org/english/tratop_e/devel_e/d1who_e. 
htm 
The International Statistical Institute, http://www.isi-web. 
org/component/content/article/5-root/root/81- 
developing
Identification of most robust and relevant model for the case 
Parameters Model 1 
Linear Model 
Model 2 
Semi-log Model 
Model 3 
Quadratic Model 
Model 4 
Linear-Log Model 
R-square 0.448 0.132 0.362 0.147 
F-Stat 7.664 (0.000 sig) 9.657 (0.000 sig) 8.432 (0.000 sig) 7.998 (0.000 sig) 
T-Stat 0.000 sig (4/5) 0.011 sig (2/5) 0.001 (3/5) 0.000 sig (3/5) 
Normal Distribution Yes No Yes No 
Auto-correlation No No No No 
Heteroscedasticity No No No No 
Durbin-Watson 2.366 2.549 3.618 3.766
Selected Linear Model – Regression Results
Linear Model results: Coefficient Table
Histogram & Normal P-P Plot
Significance of Results 
 Based on the results, we could conclude that there is a significant and 
direct relationship between stock exchange indices of the 
world and the prevailing economic conditions or the values of macro-economic 
variables. 
 There is a robust model which defines the part of explained effect of macro-economic 
variables such as GDP growth rate, Inflation change, Unemployment rate 
and GDP per capita change (%) with respect to the change in stock exchange 
indices 
 From here, we could build a sustainable model to understand the stock market in a 
broader way and guide numerous investors who depend on stable growth of the 
market for their livelihood.
Recommendations 
 Building a robust model for understanding the change in stock 
exchange indices is mandatory. 
 The changes in stock exchange indices is linear or directly related to 
the macro-economic variables and through which we can identify an 
investing pattern of the investors in the stock market. 
 This model could also be implemented for improving the performance 
of stock exchange across the world.
References 
 World Bank, www.worldbank.org/indicator 
 Sangmi, Mohi-u-Din, Macro-economic variables on Stock Market Interactions: The Indian 
Experience, Kashmir University, May-June 2013 
 Bayzeid, Muhammad, Impact of Micro and Macroeconomic Variables on ESM Return: A case on 
Dhaka Stock Exchange, Jagannath University, May 2011 
 Taulbee, Nathan, Influences of the Stock Market, An Examination of the effect of economic 
variables on the S&P 500, January 2014 
 Salman Khan, Muhammad, Macro-economic Variables & its impact on KSE-100 Index, November 
2013 
 World Trade Organization, http://www.wto.org/english/tratop_e/devel_e/d1who_e.htm 
 The International Statistical Institute, http://www.isi-web.org/component/content/article/5- 
root/root/81-developing 
 Bureau of Labour Statistics (BLS) http://data.bls.gov/timeseries/LNS14000000 
 Wikipedia.org & International Monetary Fund
Thank you! 

Devanayagam_Impact of Macroeconomic Variables on Global Stock Markets

  • 1.
    IMPACT OF MACRO-ECONOMIC VARIABLES IN THE PERFORMANCE OF GLOBAL STOCK MARKETS Devanayagam Econometrics Project Presentation 18th September 2014 www.twitter.com/Devanayagam Email: deva.4356@gmail.com
  • 2.
    Agenda  ProjectOverview  Hypothesis Listing  Literature Review  Testing of Hypothesis  Comparison of models  Global Stock markets  Introduction  Examples  Dependent & Independent Variables  Performance of global stock markets  Significance of results  Recommendations
  • 3.
    Global Stock PerformanceIndex (10 years: 2004-2014)
  • 4.
    How much significancedoes the macro-economic variables contribute to the performance of global stock markets?
  • 5.
    Do you knowthat the emerging markets contribute to as much as 6% percent change in YTD as of 2014 performance reports?!
  • 6.
    The stock marketindex change in India is 24% in YTD USD as of 2014 making it the biggest gainer in Asia - Pacific
  • 7.
    This project identifiesthe significance in stock price changes with respect to change in macro-economic variables in the world.
  • 8.
    Hypothesis Testing Null Hypothesis (Ho)  The macro-economic variables such as GDP growth rate, Inflation change and unemployment rate do not have significant impact in the performance of stock market indices.  Alternate Hypothesis (H1)  The macro-economic variables such as GDP growth rate, Inflation change and unemployment rate have significant impact in the performance of stock market indices.
  • 9.
    Literature Review ͒Tˊˇ capital market promotes economic growth and prosperity by providing an investment channel that contributes to attract domestic and foreign capital.͓ (Sangmi, Mohi-u-Din, Macro-economic variables on Stock Market Interactions: The Indian Experience, Kashmir University, May-June 2013)  ͒However, interest in investing in emerging markets has grown considerably over the past decade. Harvey (1995a) shows that returns and risks in Emerging Stock Markets have been found to be higher, relative to developed markets.͓ (Bayzeid, Muhammad, Impact of Micro and Macroeconomic Variables on ESM Return: A case on Dhaka Stock Exchange, Jagannath University, May 2011)  ͒The rational expectations hypothesis offered a new perspective on the formation of prices. The general idea behind this hypothesis is that economic agents use both past experiences aːˆ ˖ˊˇˋ˔ ˇ˚˒ˇ˅˖a˖ˋˑː˕ aːˆ ˒˔ˇˆˋ˅˖ˋˑː˕ ˑˈ ˖ˊˇ ˈ˗˖˗˔ˇ ˖ˑ ˆˇ˖ˇ˔ˏˋːˇ ˖ˊˇ ˒˔ˋ˅ˇ ˑˈ aː a˕˕ˇ˖ ˖ˑˆa˛.͓ (Taulbee, Nathan, Influences of the Stock Market, An Examination of the effect of economic variables on the S&P 500, January 2014)  ͒The study of Robert Johnson (2010) shows significant and direct relationship between inflation and real output. Relationship between stock index and real output in current period is positive aːˆ ˕ˋˉːˋˈˋ˅aː˖.͓ (Salman Khan, Muhammad, Macro-economic Variables & its impact on KSE-100 Index, November 2013)
  • 10.
    Global Stock Markets- Introduction ͒A stock market or equity market is the aggregation of buyers and sellers, a loose network of economic transactions, not a physical facility or discrete entity, of stocks (also called shares); these may include securities listed on a stock exchange a˕ ˙ˇˎˎ a˕ ˖ˊˑ˕ˇ ˑːˎ˛ ˖˔aˆˇˆ ˒˔ˋ˘a˖ˇˎ˛.͓
  • 11.
    Comparison of Globalstock market performances
  • 12.
    World's 40 best-performingstock markets in 2013 Source: money.cnn.com
  • 13.
    Emerging Stock Markets(ESMs) : Stock Market performance
  • 14.
    World’s Largest StockExchanges (based on Market Cap)  With technology advancing and barriers to entry falling just as rapidly, the exchange game is a dynamic industry these days.  Emerging markets are on the rise, but in terms of overall market capitalization, the historical powers are still the largest.  All data are from the World Federation of Exchanges' 2013 market report.  Here we list the top 5. Here we go..
  • 15.
    1. New YorkStock Exchange (NYSE), US Market Cap: $13.4 trillion
  • 16.
    2. NASDAQ MarketCap: $3.9 trillion
  • 17.
    3. Tokyo StockExchange Market Cap: $3.8 trillion
  • 18.
    4. London StockExchange Market Cap: $3.6 trillion
  • 19.
    5. Euro Next Market Cap: $2.9 trillion
  • 20.
    Project Data Sample Size: 53 (top performing 53 effective and regulated stock exchanges in the world)  Spread across 49 countries around the world  Indices: Yearly change of stock price indices  Other Data  Population  GDP (in USD)  GDP Growth Rate  GDP Per Capita  Inflation (consumer prices)  Unemployment rate (long term unemployment) Source: worldbank.org/indicators
  • 21.
    Dependent and IndependentVariables  Dependent Variable  Yearly change in global stock market indices  Independent Variables (yearly change)  GDP growth rate  Inflation change (consumer prices)  Unemployment Rate change  Development Status of nations  GDP per capita change
  • 22.
    Yearly Change inGlobal Stock Market Indices  Global Stock exchanges are measured by Stock market indices which are influenced by prevailing economic conditions of the respective country.  A stock index or stock market index is a measurement of the value of a section of the stock market. It is computed from the prices of selected stocks (typically a weighted average).  It is a tool used by investors and financial managers to describe the market, and to compare the return on specific investments.  Ex:
  • 23.
    Independent Variables: 1.GDP Growth Rate  Gross domestic product (GDP) is defined as "an aggregate measure of production equal to the sum of the gross values added of all resident institutional units engaged in production (plus any taxes, and minus any subsidies, on products not ˋː˅ˎ˗ˆˇˆ ˋː ˖ˊˇ ˘aˎ˗ˇ ˑˈ ˖ˊˇˋ˔ ˑ˗˖˒˗˖˕).͒ World GDP Annual Gorwth rate (%) 2013: 2.2% Graph source: worldbank.org/indicator
  • 24.
    2. Inflation Change(Consumer Prices) Inflation is a sustained increase in the general price level of goods and services in an economy over a period of time. When the general price level rises, each unit of currency buys Graph source: worldbank.org/indicator fewer goods and services. World Inflation (%) 2013: 2.7%
  • 25.
    3. GDP PerCapita Change  A measure of the total output of a country that takes the gross domestic product (GDP) and divides it by the number of people in the country.  The per capita GDP is especially useful when comparing one country to another because it shows the relative performance of the countries. A rise in per capita GDP signals growth in the economy and tends to translate as an increase in productivity. World GDP Per Capita (USD) 2013: 10512.9 Graph source: worldbank.org/indic ator
  • 26.
    Other Independent Variables  4. Unemployment Rate (Yearly Change) 5. Development Status World Unemployment Rate (%) 2013: 6.7% Graph source: Bureau of Labour Statistics (BLS) http://data.bls.gov/timeseries/LNS14000000 •Developed Countries •(North America & Western Europe) •Emerging Countries •(Eastern Europe, Asia & Australia) •Under-developed Countries •(Africa) Source: World Trade Organization, http://www.wto.org/english/tratop_e/devel_e/d1who_e. htm The International Statistical Institute, http://www.isi-web. org/component/content/article/5-root/root/81- developing
  • 27.
    Identification of mostrobust and relevant model for the case Parameters Model 1 Linear Model Model 2 Semi-log Model Model 3 Quadratic Model Model 4 Linear-Log Model R-square 0.448 0.132 0.362 0.147 F-Stat 7.664 (0.000 sig) 9.657 (0.000 sig) 8.432 (0.000 sig) 7.998 (0.000 sig) T-Stat 0.000 sig (4/5) 0.011 sig (2/5) 0.001 (3/5) 0.000 sig (3/5) Normal Distribution Yes No Yes No Auto-correlation No No No No Heteroscedasticity No No No No Durbin-Watson 2.366 2.549 3.618 3.766
  • 28.
    Selected Linear Model– Regression Results
  • 29.
    Linear Model results:Coefficient Table
  • 30.
  • 31.
    Significance of Results  Based on the results, we could conclude that there is a significant and direct relationship between stock exchange indices of the world and the prevailing economic conditions or the values of macro-economic variables.  There is a robust model which defines the part of explained effect of macro-economic variables such as GDP growth rate, Inflation change, Unemployment rate and GDP per capita change (%) with respect to the change in stock exchange indices  From here, we could build a sustainable model to understand the stock market in a broader way and guide numerous investors who depend on stable growth of the market for their livelihood.
  • 32.
    Recommendations  Buildinga robust model for understanding the change in stock exchange indices is mandatory.  The changes in stock exchange indices is linear or directly related to the macro-economic variables and through which we can identify an investing pattern of the investors in the stock market.  This model could also be implemented for improving the performance of stock exchange across the world.
  • 33.
    References  WorldBank, www.worldbank.org/indicator  Sangmi, Mohi-u-Din, Macro-economic variables on Stock Market Interactions: The Indian Experience, Kashmir University, May-June 2013  Bayzeid, Muhammad, Impact of Micro and Macroeconomic Variables on ESM Return: A case on Dhaka Stock Exchange, Jagannath University, May 2011  Taulbee, Nathan, Influences of the Stock Market, An Examination of the effect of economic variables on the S&P 500, January 2014  Salman Khan, Muhammad, Macro-economic Variables & its impact on KSE-100 Index, November 2013  World Trade Organization, http://www.wto.org/english/tratop_e/devel_e/d1who_e.htm  The International Statistical Institute, http://www.isi-web.org/component/content/article/5- root/root/81-developing  Bureau of Labour Statistics (BLS) http://data.bls.gov/timeseries/LNS14000000  Wikipedia.org & International Monetary Fund
  • 34.