Cosmetics and More, Rita's Corner Where a New Age of Beauty is Born!Rita Daniels
This short document promotes the creation of Haiku Deck presentations on SlideShare by stating it provides inspiration. It encourages the reader to get started making their own Haiku Deck presentation by clicking a button labeled "GET STARTED".
This listing summarizes a classic 1919 Craftsman style bungalow located in Royal Oak, Michigan. The home has been updated with new kitchen cabinets, appliances, floors, plumbing and electrical but retains original bungalow details like Pewabic tile accents. The home has three bedrooms, two full baths and a finished basement across its 1320 square feet. It is walking distance to parks, schools and downtown Royal Oak amenities. The asking price for the home is $244,900.
This document provides an overview of the contents of a guide for getting started with Minitab 17. The guide covers topics such as graphing and analyzing data, assessing quality, designing experiments, using session commands, and generating reports. It introduces key aspects of the Minitab user interface like projects and worksheets, and different data types. Each chapter also outlines the objectives and provides a brief overview of the content that will be covered.
This 3 bedroom, 2 bath bungalow sits on a beautiful lot with lake access in Waterford, Michigan. It has 1500 square feet with an open floor plan, brick fireplace, large windows, and fenced yard. The home features original oak floors and wood trim along with a recently updated furnace and central air. It is close to parks, schools, and community amenities. The home is listed for $75,000.
Kelompok 1 membahas tema "Nilai yang bisa diberikan pada peserta didik dari film Buah Kebajikan". Mereka mengidentifikasi 9 nilai penting yang dapat diasah melalui menonton film tersebut, termasuk kejujuran, ikhlas, kesabaran, rela berkorban, tanpa pamrih, rasa sosial, kesulitan menjadi orang baik, adanya kebaikan di balik kesulitan, dan keimanan sebagai pondasi.
Social is pervasive in the retailing industry and on the trajectory to becoming strategic in most sectors. This is a great opportunity for IT to pursue a multi-channel model that integrates the best of the old and the new of processes and technology.
This presentation was given in March 2014 as a Series of workshops in conjunction with the HDAA in Australian east coast cities.
ValueFlowIT: A new IT Operating Model EmergesDavid Favelle
The document discusses emerging approaches to improving IT operating models. It notes that businesses face increasing pressures from technology proliferation, cost pressures, and a faster competitive cadence. IT struggles to keep up and manage complexity across old and new systems separately. The document then summarizes several emerging approaches that can help address these challenges, including continuous delivery, automation, agile practices, digital strategies, DevOps, Lean startup principles, and integrated governance models. It proposes a new "IT operating model" that weaves these approaches together across various dimensions like strategy, processes, organization design, and governance to better deliver value from the IT portfolio.
Presentation of Massimo Talia's Master Degree Dissertation in Electronic Engineering, the developer of ICT perspectives.
------------------------------------------------------------------------------
Presentazione della Tesi di laurea in Ingegneria Elettronica di Massimo Talia, lo sviluppatore di ICT perspectives.
Yielding Robot and Rigid Environment - Contact Force Control (IT)EnricoMarinelli3
Italian:
In questa tesi viene proposto un problema di controllo della forza al contatto con l’ambiente per un modello mono-direzionale di un robot manipolatore con una dinamica disaccoppiata.
Una delle tecniche utilizzate nei giochi a due avversari in cui uno è una macchina è quella del min-max. Esaminiamola e costruiamone una implementazione object-oriented in C++
In questa prova finale utilizzo gli strumenti di analisi univariata e multivariata da me appresi durante l'insegnamento di Econometria Applicata. In particolare, attraverso il software gretl, ho dovuto stimare alcuni modelli di regressione OLS e regressione con variabili strumentali a partire da un dataset cross-section. Inoltre, a partire da un dataset contenente una serie storica ho dovuto formulare un modello AR.
Aspetti matematici relativi all'equilibrio chimico. Essendo una presentazione introduttiva a tale argomento non è stata presa in considerazione l'attività delle specie chimiche ma solo la loro concentrazione
Determinazione delle legge di Michaelis Menten con Minitab
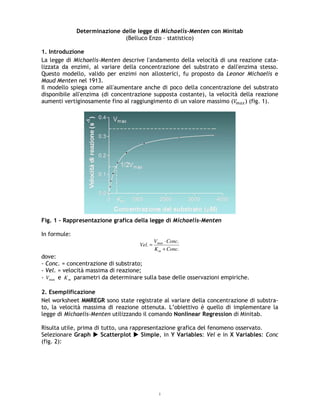
1. 1
Determinazione delle legge di Michaelis-Menten con Minitab
(Belluco Enzo – statistico)
1. Introduzione
La legge di Michaelis-Menten descrive l'andamento della velocità di una reazione cata-
lizzata da enzimi, al variare della concentrazione del substrato e dall'enzima stesso.
Questo modello, valido per enzimi non allosterici, fu proposto da Leonor Michaelis e
Maud Menten nel 1913.
Il modello spiega come all'aumentare anche di poco della concentrazione del substrato
disponibile all'enzima (di concentrazione supposta costante), la velocità della reazione
aumenti vertiginosamente fino al raggiungimento di un valore massimo ( ) (fig. 1).
Fig. 1 – Rappresentazione grafica della legge di Michaelis-Menten
In formule:
.
.
. max
ConcK
ConcV
Vel
m +
⋅
=
dove:
- Conc. = concentrazione di substrato;
- Vel. = velocità massima di reazione;
- maxV e mK parametri da determinare sulla base delle osservazioni empiriche.
2. Esemplificazione
Nel worksheet MMREGR sono state registrate al variare della concentrazione di substra-
to, la velocità massima di reazione ottenuta. L’obiettivo è quello di implementare la
legge di Michaelis-Menten utilizzando il comando Nonlinear Regression di Minitab.
Risulta utile, prima di tutto, una rappresentazione grafica del fenomeno osservato.
Selezionare Graph Scatterplot Simple, in Y Variables: Vel e in X Variables: Conc
(fig. 2):
2. 2
Fig. 2 – Scatterplot - Simple
premendo OK, si ottiene (fig. 3):
Fig. 3 – Scatterplot della velocità di reazione al variare della concentrazione di sub-
strato
Dall’esame del grafico (fig. 3) risulta che il fenomeno oggetto di studio può essere ben
modellato dalla legge di Michaelis-Menten.
Selezionare Stat Regression Nonlinear Regression, premere il pulsante Use Cata-
log, quindi selezionare l’equazione di Michaelis-Menten (fig. 4):
1,21,00,80,60,40,20,0
225
200
175
150
125
100
75
50
Conc.
Vel.
Scatterplot of Vel. vs Conc.
3. 3
Fig. 4 – Nonlinear Regression - Catalog
Esaminando la fig. 4 si può notare dalla forma dell’equazione, che in Minitab:
- maxV corrisponde a Theta1;
- mK corrisponde a Theta2.
Dall’esame del grafico associato è immediato osservare come il parametro Theta1 rap-
presenti l’asintoto orizzontale e il parametro Theta2 la pendenza della curva.
Premere OK, quindi in Actual Predictor: Conc. (fig. 5):
Fig. 5 – Nonlinear Regression - Choose Predictors
4. 4
premere OK, in Response: Vel. (fig. 6):
Fig. 6 – Nonlinear Regression
quindi, premere il pulsante Parameters. Per poter interpolare la curva Minitab utilizza
algoritmi iterativi (Gauss-Newton, oppure Levenberg-Marquardt) che prevedono che
l’utente indichi dei valori iniziali per i parametri (in questo caso Theta1 e Theta2). Te-
nendo conto di quanto indicato nella fig. 4 e nella fig. 3, è possibile ipotizzare Theta1 =
210 e Theta2 = 0,1. Quindi, in Theta1: 210, Theta2: 0,1 (fig. 7):
Fig. 7 – Nonlinear Regression - Parameters
Premendo ripetutamente OK, si ottiene (fig. 8, 9, 10):
5. 5
Fig. 8 – Fitted Line Plot
Fig. 9 – Residual Plot
Nonlinear Regression: Vel. = Theta1 * 'Conc.' / (Theta2 + 'Conc.')
Method
Algorithm Gauss-Newton
Max iterations 200
1,21,00,80,60,40,20,0
225
200
175
150
125
100
75
50
Conc.
Vel.
Fitted Line Plot
Vel. = 212,684 * 'Conc.' / (0,0641213 + 'Conc.')
20100-10-20
99
90
50
10
1
N 12
AD 0,319
P-Value 0,488
Residual
Percent
20015010050
30
20
10
0
-10
Fitted Value
Residual
20100-10
3
2
1
0
Residual
Frequency
121110987654321
30
20
10
0
-10
Observation Order
Residual
Normal Probability Plot Versus Fits
Histogram Versus Order
Residual Plots for Vel.
6. 6
Tolerance 0,00001
Starting Values for Parameters
Parameter Value
Theta1 210
Theta2 0,1
Equation
Vel. = 212,684 * 'Conc.' / (0,0641213 + 'Conc.')
Parameter Estimates
Parameter Estimate SE Estimate
Theta1 212,684 6,94716
Theta2 0,064 0,00828
Vel. = Theta1 * 'Conc.' / (Theta2 + 'Conc.')
Lack of Fit
Source DF SS MS F P
Error 10 1195,45 119,545
Lack of Fit 4 497,95 124,487 1,07 0,447
Pure Error 6 697,50 116,250
Summary
Iterations 8
Final SSE 1195,45
DFE 10
MSE 119,545
S 10,9337
Fig. 10 – Session Window
La fig. 8 riporta lo scatter plot delle due variabili, la rappresentazione grafica della fun-
zione di Michaelis-Menten e l’equazione della stessa.
La fig. 9 i grafici dei residui.
La fig. 10 riporta:
- tabella del tipo di algoritmo utilizzato (Method), con il numero massimo di iterazioni e
la tolleranza;
- tabella riportante i valori iniziali dei due parametri (Starting Values for Parameters);
- tabella riportante l’equazione determinata (Equation);
- tabella indicante le stime dei parametri (Parameter Estimates);
- tabella riportante i risultati del test Lack of Fit (per valutare eventuali curvature) e
l’errore puro (Pure Error) che stima la variabilità nel caso di misure ripetute;
7. 7
- tabella riepilogativa (Summary) che riporta il numero di iterazioni che sono state ne-
cessarie all’algoritmo per determinare una soluzione, la somma dei quadrati finale
dell’errore (Final SSE), i gradi di liberta associati all’errore (DFE), l’errore quadratico
medio (MSE) e la valutazione della dispersione complessiva ottenuta dai dati (S).