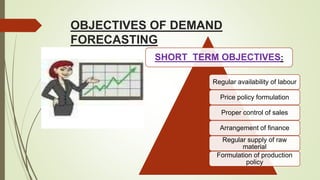
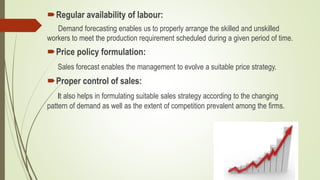
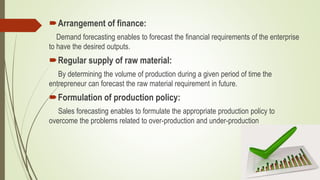
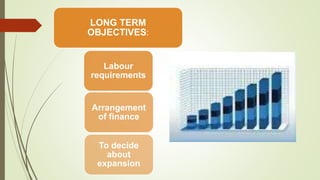
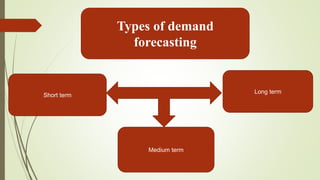
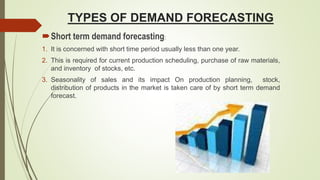
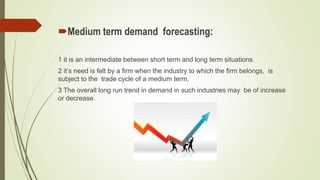
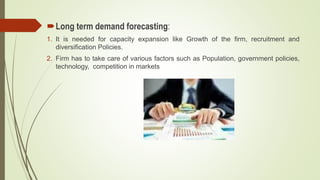
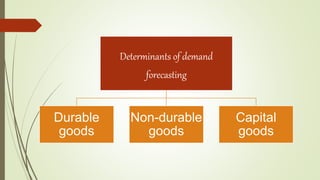
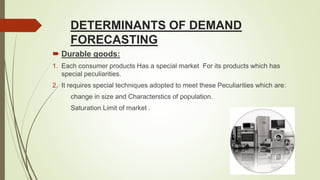
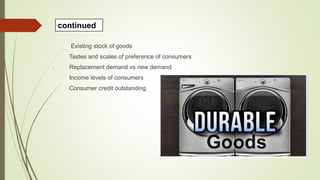
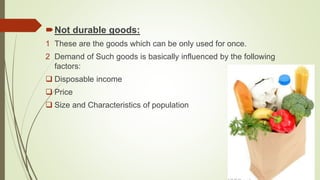
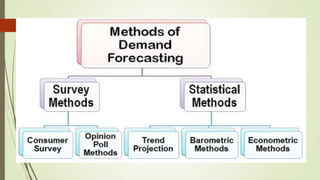
DEMAND
FORECASTING
Meaning
Forecasting is a prediction of what will occur
in the future.
Such prediction are rarely perfect, regardless
of the quantity of historical data and the
extent of the managerial experience.
According to professors Norman Gaither
and Greg Frazier ‘forecasting’ is estimating
the future demand for products and services
and the resources necessary to produce the
outputs
OBJECTIVES OF DEMAND
FORECASTING
SHORT TERM OBJECTIVES:
Regular availability of labour
Price policy formulation
Proper control of sales
Arrangement of finance
Regular supply of raw
material
Formulation of production
policy
Regular availability of labour:
Demand forecasting enables us to properly arrange the skilled and unskilled
workers to meet the production requirement scheduled during a given period of time.
Price policy formulation:
Sales forecast enables the management to evolve a suitable price strategy.
Proper control of sales:
It also helps in formulating suitable sales strategy according to the changing
pattern of demand as well as the extent of competition prevalent among the firms.
Arrangement of finance:
Demand forecasting enables to forecast the financial requirements of the enterprise
to have the desired outputs.
Regular supply of raw material:
By determining the volume of production during a given period of time the
entrepreneur can forecast the raw material requirement in future.
Formulation of production policy:
Sales forecasting enables to formulate the appropriate production policy to
overcome the problems related to over-production and under-production
LONG TERM
OBJECTIVES:
Labour
requirements
Arrangement
of finance
To decide
about
expansion
Labour requirements:
In the long run, techniques of production may change. Therefore, trained and skilled
labour are needed for new types of job responsibilities. Thus, demand forecasting helps
to arrange the skilled labour.
Arrangement of finance:
Assembling the long financial needs, the long term demand forecasting enables the
management to arrange the long term finances on reasonable conditions.
To decide about expansion:
The long term demand forecasting enables to plan a new project, as well as
expansion and modernization of the existing unit.
Types of demand
forecasting
Short term
Medium term
Long term
TYPES OF DEMAND FORECASTING
Short term demand forecasting:
1. It is concerned with short time period usually less than one year.
2. This is required for current production scheduling, purchase of raw materials,
and inventory of stocks, etc.
3. Seasonality of sales and its impact On production planning, stock,
distribution of products in the market is taken care of by short term demand
forecast.
Medium term demand forecasting:
1 it is an intermediate between short term and long term situations.
2 it’s need is felt by a firm when the industry to which the firm belongs, is
subject to the trade cycle of a medium term.
3 The overall long run trend in demand in such industries may be of increase
or decrease.
Long term demand forecasting:
1. It is needed for capacity expansion like Growth of the firm, recruitment and
diversification Policies.
2. Firm has to take care of various factors such as Population, government policies,
technology, competition in markets
Determinants of demand
forecasting
Durable
goods
Non-durable
goods
Capital
goods
DETERMINANTS OF DEMAND
FORECASTING
 Durable goods:
1. Each consumer products Has a special market For its products which has
special peculiarities.
2. It requires special techniques adopted to meet these Peculiarities which are:
change in size and Characterstics of population.
Saturation Limit of market .
Existing stock of goods
Tastes and scales of preference of consumers
. Replacement demand vs new demand
Income levels of consumers
Consumer credit outstanding
continued
Not durable goods:
1 These are the goods which can be only used for once.
2 Demand of Such goods is basically influenced by the following
factors:
 Disposable income
 Price
 Size and Characteristics of population
Capital goods (producers goods) :
1 These are the goods which help in further production of goods Such as machinery,
equipment, etc
2. These are demanded only when there is a demand for the goods which these capital
goods help in producing.
3 The demand for capital goods is of two types:
Replacement demand
New demand
REQUIREMENTS OF GOOD DEMAND
FORECASTING
Elements
connected to
consumers
Elements
concerning
the suppliers
Elements
Concerning
the market I.
E. Industry
Miscellaneous
elements
(A)Elements connected to consumers
 Total number of consumers
 Distribution of consumers product
 Total purchasing power and per capita income
 Income elasticities
 Consumer tastes, social customs, etc
 Consumers marketing details- where do they buy, when do they buy
etc…
 Effect of design, colour, etc on consumers preference
(B)Elements concerning the suppliers
 Current levels of sales
 Current stocks of goods
 Trends in sales and stocks
 Market share
 Pattern of seasonal fluctuations
 Research and development trends
 Company strength and weakness
 Product life cycle
 New product possibilities
(c)Elements concerning the market
 The effect of price change ie price elasticity
 Product characteristics
 Identification of competitive and complementary products
 Number and nature of competitors
 Forms of market competition
 General price levels
 Price of similar goods
(D) Miscellaneous elements
 Economic environment-showing economic activities,
employment, national income, population, trends of income
 General government policies
 Taxation levels
 International environment
STEPS INVOLVED IN DEMAND
FORECASTING
Clarity of objectives
Selection of goods
Selection of method
Interpretation of results
Techniques of demand forecasting
 The main challenge to forecast demand is to select an effective technique
 There is no particular method that enables organizations to anticipate risks and
uncertainties .
 There are basically two approaches: First involves collecting information from
customers
through survey and second by using
past data
(1)CONSUMER SURVEY METHOD
It uses the direct approach to demand forecasting by
directly asking the consumers about their future
consumption plan and the burden of forecasting
goes to buyer
CONSUMER SURVEY METHOD
It is of three types:
Consumer survey
method
Complete
enumeration
survey
Sample
survey
End use
method
(a)COMPLETE ENUMERATION SURVEY
In this, the consumers are asked about their future plans
of purchasing the product in question . The quantities
indicated by them are added to obtain the total demand
For example-if there are n consumers and their probable
demands for commodity X in the forecast period are
x1,x2,x3…….xn, the sales forecast would be
X=X1+X2+X3…….+Xn
(B)SAMPLE SURVEY
Under this only a few customers are selected from relevant
market through a sampling method , then demand is added to get
the final demand
It gives good results when applied carefully especially for new
products and brands
Advantages are:
Simple method
Less costly
(C)END USE METHOD
It focus on the demand survey of industries using this product as
an intermediate product . Demand for the intermediate product is
end –use demand in the production of final product
ITS ADVANTAGES ARE:
 Does not require mathematical calculations
 Based on the first hand knowledge of the salesman
 Helps in forecast the sales of new product
 Does not require any historical data
(2)Opinion methods
Opinion poll methods aims at collecting opinion from those who are
supposed to possess knowledge of market e.g. Sales
representatives , sales executives , professional marketing
experts
Opinion
method
Expert
opinion
method
Delphi
method
Market
studies and
experiment
(A)EXPERT OPINION METHOD
Under this method ,firms having good network of sales
representatives can ask them to assess the demand of product
in the areas or cities they represent
As sales representatives are very close to customers they know
about the future purchase plan ,their reaction to the market and
introduction of new product
Then all the estimated demand are added up to get the overall
demand for a product
Firms which do not have facility, gather information about the
demand for their product through the professional market experts
or consultants
As this method is too simple and less costly ,it has its own
limitations:
Estimates provided them are not reliable
Demand estimates involves the subjective judgments of the assessor
(B)DELPHI METHOD
It is an expansion of simple expert opinion poll method. It is used
to consolidate the divergent expert opinions and to arrive at a
compromise estimate of future demand
Under this experts are provided information on estimates of
forecast of other experts with the underlying assumptions. Then
experts revise estimates in the light of forecast made by other
experts
Steps involved in Delphi method:
First step involves the selection of experts . It draws a panel of
experts including both inside and outside the organisation who
are experts in diversified field
Second step involves making independent predictions in the form
of brief statements either by the way of questionnaire or an e-mail
Third includes summarizing the statements after necessary
editions and clarifications
Contd.
Fourth step involves re-distributing the statements with new
statements along with the feedback supplied by other experts
Fifth step includes summarizing the statements again and
developing new questions if required and re-distributing it again
Last step includes repeating this several times (normally three
rounds )till the time ,convergence is obtained
contd.
Example of Delphi method
 Technology forecasting is an example when there is no quantitative data and we predict future
technology through Delphi method
 Order of development
machine language
assembly language(first generation language)
high level language(second generation languages)
Third generation language(dbase-3)
Fourth generation language(oracle)
contd
 So, in this next level development would be clubbed under fifth generation
,but the features are yet to be known . If the objective is to predict the
capabilities we use Delphi method
(c)Market studies and experiments
It involves collecting necessary information regarding
the current and future demand for a product . It
carries out studies and experiments on consumer
behavior under actual market conditions
In this some areas of market are selected with
similar features such as income level, cultural
background, choice and preferences of consumers
(2)Statistical methods
This method uses historical for estimating long term
demand
It is considered superior than any other techniques
due to following reasons:
 Method of estimation is scientific
 Estimates are relatively more reliable
 It involves small cost
Statistical methods
Trend projection
methods
Barometric methods
Econometric
methods
(1)Trend projection method
It is concerned with movements of variables through time ,it uses
long and reliable time series data
It is based on the assumption that factors responsible for past
trends in the variable to be projected as they will continue to play
their part in future in same way and to same extent in magnitude
and direction
It is applied to time series data on sales . Older firms can get data
from their own sales department and new ones from older firms
year sales
2001 20
2002 24
2003 22
2004 30
2005 36
2006 28
Time series data of XYZ organisation
(A)GRAPHICAL METHOD
This method helps in forecasting the future sales of an
organisation with the help of an graph. The sales data is
plotted on a graph and a line is drawn on plotted points
and a free hand curve is drawn .
(b)Fitting trend method
It means least square method in which a trend line
(curve) is fitted to the time series data of sales with
the help of statistical techniques
Two types of trends:
Linear trend
Exponential trend
(1)Linear trend
When the time series data shows a rising trend in the
sales ,then the straight line trend equation is:
y = a + b(X)
Where,
Y=annual sales,
X=time(years),
a and b are constants.
Parameter B gives the measure of annual increase in
sales
(2)Exponential trend
It implies a trend when sales increase over the past years
at an increasing rate or constant rate
Exponential trend equation is:
y= aT(b)
where, y=annual sales
T=time in years
a and b are constants
Converting into log:
(1) semi logarithmic form:
log y =log a + bT
It is used when growth rate is constant
(2)Double log trend of the firm:
log Y =log a +b log T
It is used when growth rate is increasing
(C) BOX -JENKINS METHOD
It is used only for short term predictions. This method forecasts
demand only with stationary time series data that does not reveal
long term trend . It is used in those situation where time series
data depicts monthly or seasonal variations with some degree of
regularity
For example-this can be used for estimating the sales forecast of
woollen clothes during the winter season
(2)Barometric method
This method is used to forecast trend in business activities . The
technique is to construct an index of economic indicator and to
forecast future trend on the basis of movement in the index of
economic indicator
This method was introduced by national bureau of economic
research in 1930
Three indicators used:
 Leading indicators: means those factors which move up or down with some
other series
Ex: baby powder leads to birth rate
Leading
indicators
Coincidental
indicators
Lagging
indicators
 Coincident series: are the ones that move up or down with the level of
economic activity
 Lagging series: those indicators which follow a change after some time lag
(3)Econometric method
It combines statistical tools with economic theories for
forecasting. It is widely used for a product, for a group of
product or for the economy as a whole
Types of econometric method
Regression method
Simultaneous equation
method
(1)Regression method
It is used to specify the determinants of demands
and to determine the nature of relationship between
the demand and its determinants
It is the method by which quantity demanded and
one or more independent variable is estimated.
Two types of regression method:
 Simple regression method:
When quantity demanded is estimated as a function of a single
independent variable such as price
 Multiple regression method:
It is used to estimate demand as a function of two or more
independent variables
(2)Simultaneous equation method
It involves simultaneous consideration of all
variables, as every variable influences other variable
in economic decision environment
There are two models endogenous and exogenous
variable . We first determine these variables and
after that necessary data is collected. After this
model is estimated through some appropriate
method
Consumer survey method
Test marketing
Life cycle segmentation analysis
Bounding curves method
Demand forecasting of new product
 Each product has a LIFE CYCLE of introduction, growth, maturity,
saturation and decline.
 LIFE CYCLE of the same product may be processing at different stage of
market segments.
 Further the sales of a new product in any particular market segment tend
to follow an S-shaped curve
Life cycle segmentation method
5 stages of product life cycle
Introduction
Growth
Maturity
Saturation
Decline
Introduction: quality has the greater marketing impact, then advertising;
but the price and service has the least impact.
Growth: early the adopters have already purchased the goods; so
advertising is most effective weapon and then the quality
Maturity: rivals have entered the market; so price elasticity has become
very much higher. So price is more essential, followed by advertising, quality
and service.
Saturation: price is no longer important because it has already income
low; product differentiation in quality, packaging, or advertising becomes
critical.
Decline: the problem now is to find new product uses and to advertise
them; quality and service will have some impact, but price has very little
impact.
This method is based on market share. Market share data of all
the existing brands.
Market share
Bounding curve method
months J F M A M J J A S O N D
Brand A 35 30 20 45 50 45 40 45 35 35 40 40
Brand B 25 25 20 10 10 5 15 20 25 30 30 30
J-F F-M M-A A-M M-J J-J J-A A-S S-O O-N N-D
Brand A -5 -10 +25 +5 -5 -5 +5 -10 ------- +5 -------
Brand B ------- -5 -10 ------- -5 +10 +5 +5 +5 ------- -------
Market change in market share
QUALITY OF GOOD DEMAND
FORECASTING
• simplicity
• accuracy
• Easy availability
• economy
• Capacity to update forecast
IMPORTANCE OF DEMAND
FORECASTING
Planning of
production
Sales
forecasting
Control of
business
Control on
business
activities
Policy making
Useful for
stability
Demand forecasting.ppt

Demand forecasting.ppt

  • 1.
  • 2.
    Meaning Forecasting is aprediction of what will occur in the future. Such prediction are rarely perfect, regardless of the quantity of historical data and the extent of the managerial experience.
  • 3.
    According to professorsNorman Gaither and Greg Frazier ‘forecasting’ is estimating the future demand for products and services and the resources necessary to produce the outputs
  • 4.
    OBJECTIVES OF DEMAND FORECASTING SHORTTERM OBJECTIVES: Regular availability of labour Price policy formulation Proper control of sales Arrangement of finance Regular supply of raw material Formulation of production policy
  • 5.
    Regular availability oflabour: Demand forecasting enables us to properly arrange the skilled and unskilled workers to meet the production requirement scheduled during a given period of time. Price policy formulation: Sales forecast enables the management to evolve a suitable price strategy. Proper control of sales: It also helps in formulating suitable sales strategy according to the changing pattern of demand as well as the extent of competition prevalent among the firms.
  • 6.
    Arrangement of finance: Demandforecasting enables to forecast the financial requirements of the enterprise to have the desired outputs. Regular supply of raw material: By determining the volume of production during a given period of time the entrepreneur can forecast the raw material requirement in future. Formulation of production policy: Sales forecasting enables to formulate the appropriate production policy to overcome the problems related to over-production and under-production
  • 7.
  • 8.
    Labour requirements: In thelong run, techniques of production may change. Therefore, trained and skilled labour are needed for new types of job responsibilities. Thus, demand forecasting helps to arrange the skilled labour. Arrangement of finance: Assembling the long financial needs, the long term demand forecasting enables the management to arrange the long term finances on reasonable conditions. To decide about expansion: The long term demand forecasting enables to plan a new project, as well as expansion and modernization of the existing unit.
  • 9.
    Types of demand forecasting Shortterm Medium term Long term
  • 10.
    TYPES OF DEMANDFORECASTING Short term demand forecasting: 1. It is concerned with short time period usually less than one year. 2. This is required for current production scheduling, purchase of raw materials, and inventory of stocks, etc. 3. Seasonality of sales and its impact On production planning, stock, distribution of products in the market is taken care of by short term demand forecast.
  • 11.
    Medium term demandforecasting: 1 it is an intermediate between short term and long term situations. 2 it’s need is felt by a firm when the industry to which the firm belongs, is subject to the trade cycle of a medium term. 3 The overall long run trend in demand in such industries may be of increase or decrease.
  • 12.
    Long term demandforecasting: 1. It is needed for capacity expansion like Growth of the firm, recruitment and diversification Policies. 2. Firm has to take care of various factors such as Population, government policies, technology, competition in markets
  • 13.
  • 14.
    DETERMINANTS OF DEMAND FORECASTING Durable goods: 1. Each consumer products Has a special market For its products which has special peculiarities. 2. It requires special techniques adopted to meet these Peculiarities which are: change in size and Characterstics of population. Saturation Limit of market .
  • 15.
    Existing stock ofgoods Tastes and scales of preference of consumers . Replacement demand vs new demand Income levels of consumers Consumer credit outstanding continued
  • 16.
    Not durable goods: 1These are the goods which can be only used for once. 2 Demand of Such goods is basically influenced by the following factors:  Disposable income  Price  Size and Characteristics of population
  • 17.
    Capital goods (producersgoods) : 1 These are the goods which help in further production of goods Such as machinery, equipment, etc 2. These are demanded only when there is a demand for the goods which these capital goods help in producing. 3 The demand for capital goods is of two types: Replacement demand New demand
  • 18.
    REQUIREMENTS OF GOODDEMAND FORECASTING Elements connected to consumers Elements concerning the suppliers Elements Concerning the market I. E. Industry Miscellaneous elements
  • 19.
    (A)Elements connected toconsumers  Total number of consumers  Distribution of consumers product  Total purchasing power and per capita income  Income elasticities  Consumer tastes, social customs, etc  Consumers marketing details- where do they buy, when do they buy etc…  Effect of design, colour, etc on consumers preference
  • 20.
    (B)Elements concerning thesuppliers  Current levels of sales  Current stocks of goods  Trends in sales and stocks  Market share  Pattern of seasonal fluctuations  Research and development trends  Company strength and weakness  Product life cycle  New product possibilities
  • 21.
    (c)Elements concerning themarket  The effect of price change ie price elasticity  Product characteristics  Identification of competitive and complementary products  Number and nature of competitors  Forms of market competition  General price levels  Price of similar goods
  • 22.
    (D) Miscellaneous elements Economic environment-showing economic activities, employment, national income, population, trends of income  General government policies  Taxation levels  International environment
  • 23.
    STEPS INVOLVED INDEMAND FORECASTING Clarity of objectives Selection of goods Selection of method Interpretation of results
  • 24.
    Techniques of demandforecasting  The main challenge to forecast demand is to select an effective technique  There is no particular method that enables organizations to anticipate risks and uncertainties .  There are basically two approaches: First involves collecting information from customers through survey and second by using past data
  • 26.
    (1)CONSUMER SURVEY METHOD Ituses the direct approach to demand forecasting by directly asking the consumers about their future consumption plan and the burden of forecasting goes to buyer
  • 27.
    CONSUMER SURVEY METHOD Itis of three types: Consumer survey method Complete enumeration survey Sample survey End use method
  • 28.
    (a)COMPLETE ENUMERATION SURVEY Inthis, the consumers are asked about their future plans of purchasing the product in question . The quantities indicated by them are added to obtain the total demand For example-if there are n consumers and their probable demands for commodity X in the forecast period are x1,x2,x3…….xn, the sales forecast would be X=X1+X2+X3…….+Xn
  • 29.
    (B)SAMPLE SURVEY Under thisonly a few customers are selected from relevant market through a sampling method , then demand is added to get the final demand It gives good results when applied carefully especially for new products and brands Advantages are: Simple method Less costly
  • 30.
    (C)END USE METHOD Itfocus on the demand survey of industries using this product as an intermediate product . Demand for the intermediate product is end –use demand in the production of final product
  • 31.
    ITS ADVANTAGES ARE: Does not require mathematical calculations  Based on the first hand knowledge of the salesman  Helps in forecast the sales of new product  Does not require any historical data
  • 32.
    (2)Opinion methods Opinion pollmethods aims at collecting opinion from those who are supposed to possess knowledge of market e.g. Sales representatives , sales executives , professional marketing experts Opinion method Expert opinion method Delphi method Market studies and experiment
  • 33.
    (A)EXPERT OPINION METHOD Underthis method ,firms having good network of sales representatives can ask them to assess the demand of product in the areas or cities they represent As sales representatives are very close to customers they know about the future purchase plan ,their reaction to the market and introduction of new product Then all the estimated demand are added up to get the overall demand for a product
  • 34.
    Firms which donot have facility, gather information about the demand for their product through the professional market experts or consultants As this method is too simple and less costly ,it has its own limitations: Estimates provided them are not reliable Demand estimates involves the subjective judgments of the assessor
  • 35.
    (B)DELPHI METHOD It isan expansion of simple expert opinion poll method. It is used to consolidate the divergent expert opinions and to arrive at a compromise estimate of future demand Under this experts are provided information on estimates of forecast of other experts with the underlying assumptions. Then experts revise estimates in the light of forecast made by other experts
  • 36.
    Steps involved inDelphi method: First step involves the selection of experts . It draws a panel of experts including both inside and outside the organisation who are experts in diversified field Second step involves making independent predictions in the form of brief statements either by the way of questionnaire or an e-mail Third includes summarizing the statements after necessary editions and clarifications
  • 37.
    Contd. Fourth step involvesre-distributing the statements with new statements along with the feedback supplied by other experts Fifth step includes summarizing the statements again and developing new questions if required and re-distributing it again Last step includes repeating this several times (normally three rounds )till the time ,convergence is obtained
  • 38.
    contd. Example of Delphimethod  Technology forecasting is an example when there is no quantitative data and we predict future technology through Delphi method  Order of development machine language assembly language(first generation language) high level language(second generation languages) Third generation language(dbase-3) Fourth generation language(oracle)
  • 39.
    contd  So, inthis next level development would be clubbed under fifth generation ,but the features are yet to be known . If the objective is to predict the capabilities we use Delphi method
  • 40.
    (c)Market studies andexperiments It involves collecting necessary information regarding the current and future demand for a product . It carries out studies and experiments on consumer behavior under actual market conditions In this some areas of market are selected with similar features such as income level, cultural background, choice and preferences of consumers
  • 41.
    (2)Statistical methods This methoduses historical for estimating long term demand It is considered superior than any other techniques due to following reasons:  Method of estimation is scientific  Estimates are relatively more reliable  It involves small cost
  • 42.
  • 43.
    (1)Trend projection method Itis concerned with movements of variables through time ,it uses long and reliable time series data It is based on the assumption that factors responsible for past trends in the variable to be projected as they will continue to play their part in future in same way and to same extent in magnitude and direction It is applied to time series data on sales . Older firms can get data from their own sales department and new ones from older firms
  • 44.
    year sales 2001 20 200224 2003 22 2004 30 2005 36 2006 28 Time series data of XYZ organisation
  • 46.
    (A)GRAPHICAL METHOD This methodhelps in forecasting the future sales of an organisation with the help of an graph. The sales data is plotted on a graph and a line is drawn on plotted points and a free hand curve is drawn .
  • 48.
    (b)Fitting trend method Itmeans least square method in which a trend line (curve) is fitted to the time series data of sales with the help of statistical techniques Two types of trends: Linear trend Exponential trend
  • 49.
    (1)Linear trend When thetime series data shows a rising trend in the sales ,then the straight line trend equation is: y = a + b(X) Where, Y=annual sales, X=time(years), a and b are constants. Parameter B gives the measure of annual increase in sales
  • 51.
    (2)Exponential trend It impliesa trend when sales increase over the past years at an increasing rate or constant rate Exponential trend equation is: y= aT(b) where, y=annual sales T=time in years a and b are constants
  • 52.
    Converting into log: (1)semi logarithmic form: log y =log a + bT It is used when growth rate is constant (2)Double log trend of the firm: log Y =log a +b log T It is used when growth rate is increasing
  • 53.
    (C) BOX -JENKINSMETHOD It is used only for short term predictions. This method forecasts demand only with stationary time series data that does not reveal long term trend . It is used in those situation where time series data depicts monthly or seasonal variations with some degree of regularity For example-this can be used for estimating the sales forecast of woollen clothes during the winter season
  • 54.
    (2)Barometric method This methodis used to forecast trend in business activities . The technique is to construct an index of economic indicator and to forecast future trend on the basis of movement in the index of economic indicator This method was introduced by national bureau of economic research in 1930
  • 55.
    Three indicators used: Leading indicators: means those factors which move up or down with some other series Ex: baby powder leads to birth rate Leading indicators Coincidental indicators Lagging indicators
  • 56.
     Coincident series:are the ones that move up or down with the level of economic activity  Lagging series: those indicators which follow a change after some time lag
  • 57.
    (3)Econometric method It combinesstatistical tools with economic theories for forecasting. It is widely used for a product, for a group of product or for the economy as a whole Types of econometric method Regression method Simultaneous equation method
  • 58.
    (1)Regression method It isused to specify the determinants of demands and to determine the nature of relationship between the demand and its determinants It is the method by which quantity demanded and one or more independent variable is estimated.
  • 59.
    Two types ofregression method:  Simple regression method: When quantity demanded is estimated as a function of a single independent variable such as price  Multiple regression method: It is used to estimate demand as a function of two or more independent variables
  • 60.
    (2)Simultaneous equation method Itinvolves simultaneous consideration of all variables, as every variable influences other variable in economic decision environment There are two models endogenous and exogenous variable . We first determine these variables and after that necessary data is collected. After this model is estimated through some appropriate method
  • 61.
    Consumer survey method Testmarketing Life cycle segmentation analysis Bounding curves method Demand forecasting of new product
  • 62.
     Each producthas a LIFE CYCLE of introduction, growth, maturity, saturation and decline.  LIFE CYCLE of the same product may be processing at different stage of market segments.  Further the sales of a new product in any particular market segment tend to follow an S-shaped curve Life cycle segmentation method
  • 63.
    5 stages ofproduct life cycle Introduction Growth Maturity Saturation Decline
  • 64.
    Introduction: quality hasthe greater marketing impact, then advertising; but the price and service has the least impact. Growth: early the adopters have already purchased the goods; so advertising is most effective weapon and then the quality Maturity: rivals have entered the market; so price elasticity has become very much higher. So price is more essential, followed by advertising, quality and service.
  • 65.
    Saturation: price isno longer important because it has already income low; product differentiation in quality, packaging, or advertising becomes critical. Decline: the problem now is to find new product uses and to advertise them; quality and service will have some impact, but price has very little impact.
  • 67.
    This method isbased on market share. Market share data of all the existing brands. Market share Bounding curve method months J F M A M J J A S O N D Brand A 35 30 20 45 50 45 40 45 35 35 40 40 Brand B 25 25 20 10 10 5 15 20 25 30 30 30
  • 68.
    J-F F-M M-AA-M M-J J-J J-A A-S S-O O-N N-D Brand A -5 -10 +25 +5 -5 -5 +5 -10 ------- +5 ------- Brand B ------- -5 -10 ------- -5 +10 +5 +5 +5 ------- ------- Market change in market share
  • 69.
    QUALITY OF GOODDEMAND FORECASTING • simplicity • accuracy • Easy availability • economy • Capacity to update forecast
  • 70.
    IMPORTANCE OF DEMAND FORECASTING Planningof production Sales forecasting Control of business Control on business activities Policy making Useful for stability