Download to read offline
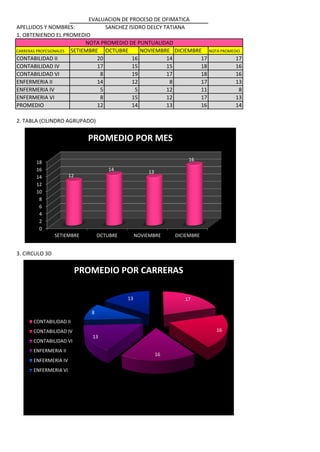


The document contains information about students' grades and personal data: 1. It shows the average grades by course and month, with the overall average being 14. 2. A bar graph depicts the average grades increasing from September to December. 3. A 3D pie chart illustrates the average grade by course, ranging from 8 to 17. 4. Two tables list students' names, ages, heights, weights, and health conditions, ordered first by age then by weight. 5. A grid displays numbers from 1 to 12 in cells with their monetary values.


