
More Related Content
Viewers also liked
Similar to Evaluacion de ofimatica
Similar to Evaluacion de ofimatica (13)
More from cristian_u_b
Evaluacion de ofimatica
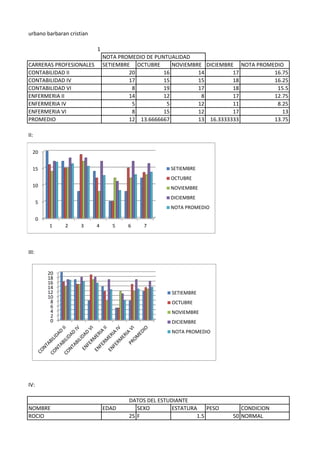
- 1. urbano barbaran cristian 1 NOTA PROMEDIO DE PUNTUALIDAD CARRERAS PROFESIONALES SETIEMBRE OCTUBRE NOVIEMBRE DICIEMBRE NOTA PROMEDIO CONTABILIDAD II 20 16 14 17 16.75 CONTABILIDAD IV 17 15 15 18 16.25 CONTABILIDAD VI 8 19 17 18 15.5 ENFERMERIA II 14 12 8 17 12.75 ENFERMERIA IV 5 5 12 11 8.25 ENFERMERIA VI 8 15 12 17 13 PROMEDIO 12 13.6666667 13 16.3333333 13.75 II: 20 15 SETIEMBRE OCTUBRE 10 NOVIEMBRE DICIEMBRE 5 NOTA PROMEDIO 0 1 2 3 4 5 6 7 III: 20 18 16 14 12 SETIEMBRE 10 8 OCTUBRE 6 4 NOVIEMBRE 2 0 DICIEMBRE NOTA PROMEDIO IV: DATOS DEL ESTUDIANTE NOMBRE EDAD SEXO ESTATURA PESO CONDICION ROCIO 25 F 1.5 50 NORMAL
- 2. LISSI 22 M 1.72 75 SOBREPESO TANIA 29 F 1.68 56 NORMAL MAX 35 F 1.51 50 NORMAL CRISTIAN 40 F 1.59 59 NORMAL DAVID 38 M 1.62 72 SOBRE PESO MICHAEL 50 M 1.65 45 NORMAL JENY 22 M 1.82 85 SOBRE PESO JUAN 33 F 1.62 66 NORMAL DORA 41 F 1.71 53 NORMAL PROMEDIO DATOS DEL ESTUDIANTE NOMBRE EDAD SEXO ESTATURA PESO CONDICION TANIA 50 F 1.5 85 NORMAL ROCIO 41 M 1.72 75 SOBREPESO MICHAEL 40 F 1.68 72 NORMAL MAX 38 F 1.51 66 NORMAL LISSI 35 F 1.59 59 NORMAL JUAN 33 M 1.62 56 SOBRE PESO JENY 29 M 1.65 53 NORMAL DORA 25 M 1.82 50 SOBRE PESO DAVID 22 F 1.62 50 NORMAL CRISTIAN 22 F 1.71 45 NORMAL PROMEDIO 33.5 16.42 61.1 V: 1 S/. 1.00 S/. 1,00 2 1 1 S/. 2.00 S/. 1.00 3 S/.3.00 S/. 2,00 4 2 S/. 4.00 5 2 S/. 5.00 S/. 2.00 S/. 3.00 6 3 S/. 6.00 7 S/. 7.00 S/. 4.00 8 4 3 S/. 8.00 S/. 3.00 9 S/. 9.00 S/. 5.00 10 5 S/. 10.00 11 4 S/. 11.00 S/. 4.00 S/. 6.00 12 6 S/. 12.00