Deficit plans 12.05.12
•Download as PPTX, PDF•
0 likes•156 views
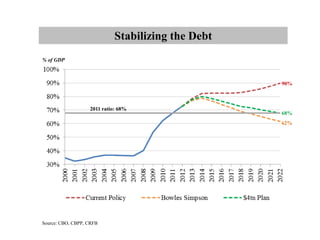
The document shows charts and graphs related to the US debt and deficit reduction plans. The first chart shows that the US debt as a percentage of GDP is projected to stabilize around 68-90% between 2011-2022. The second chart shows deficit reduction plans between 2013-2022, with around $4 trillion in projected savings. The third chart compares the deficit reduction plans of President Obama and Speaker Boehner, showing similar cuts to discretionary spending but differing approaches to revenues and mandatory spending.
Report
Share
Report
Share

Recommended
Tengowski - Viii 2 obama domestic policy
Obama pursued an aggressive domestic policy in response to the Great Recession, passing a large economic stimulus package and sweeping Wall Street reform. His signature achievement was the Affordable Care Act to provide health insurance to millions of uninsured Americans. However, this substantial spending contributed to increased budget deficits and national debt. Obama also advanced civil rights issues like repealing Don't Ask Don't Tell and supporting same-sex marriage. His domestic agenda faced partisan opposition in Congress, leading to a government shutdown, but the economy and job market gradually improved during his presidency.
Weekly news 15
- The S&P 500 rose 3% this week as signs of economic stabilization and optimism around Europe's debt crisis reassured investors.
- LIC plans to invest around Rs 61,000 crore in equity markets this fiscal year, up from Rs 9,400 crore earned last year from portfolio churning.
- The World Bank approved a $45 million loan to the National Highways Authority of India to improve operational efficiency as 40% of India's traffic uses the national highway network.
Annual Press Conference - PGCAR Presentation
Presentation by the Prince George's County Association of Realtors at the Annual Press Conference - held at the National Press Club in Washington DC on December 15, 2009.
Fiscal cliff v2
The document discusses periods of economic uncertainty in the United States, including the 9/11 attacks, Iraq War, 2011 debt ceiling debate, and financial crisis. It shows graphs depicting declines in business investment spending and consumer confidence during these uncertain times according to various economic indices and data sources.
Housing
Home prices in Las Vegas have fallen the most since August 2006 at -57.3%, while Washington D.C. saw the smallest decline at -3.7%. New housing starts dropped from 1,495,000 in January 2006 to 954,000 in January 2009. The 30-year mortgage rate fell from 6.63% in January 2006 to 3.38% in January 2009, providing some support. However, housing only contributed 0.31 percentage points to real GDP growth in Q4 2008, signaling the housing recession continued dragging on the economy.
Gdp final
The document discusses uneven GDP growth and stagnant wages in the US economy. Hourly wages for all private workers declined 0.1% year-over-year after adjusting for inflation. Meanwhile, prices continued rising with overall inflation at 2.1% according to the Bureau of Labor Statistics.
Intrade
The document shows polling data and predictions from Intrade on the 2020 US presidential election and key Senate races. Based on Intrade predictions, the Democratic candidate has a 70% chance of winning the presidential election and currently leads in the electoral college count 281 to 235. Several battleground states could determine the outcome and Intrade indicates the Democratic candidate is favored to win Senate races in Massachusetts, Missouri, Indiana, Connecticut and Virginia.
Congress
Congress has become increasingly polarized over the past 60+ years, with fewer bills passing and less ideological overlap between the parties. In the House and Senate, members have moved further apart ideologically since the late 1940s, with almost no ideological overlap remaining between the two parties in the Senate by the 2000s. The number of bills passed by each Congress has declined sharply since the 1960s as polarization has increased.
Jobs
The jobs report showed another month of slow jobs growth, with only 75,000 jobs added in May. While the establishment survey showed slow growth, the household survey showed a decline in employment. Additionally, wages have remained stagnant, growing only 0.3% after adjusting for inflation over the past year.
Jobs
The document contains three charts with no labels or titles showing year-over-year change in real hourly wages, six month deficit in billions, and labor force participation rate at 63.3%. The charts provide high-level economic indicators but lack details to fully understand trends or time periods depicted.
Unemployment benefits
The document compares long-term unemployment following three recessions in the United States - the 2007-09 recession, the 1981-82 recession, and the 1990-91 recession. It shows that the number of long-term unemployed (those unemployed for 27 weeks or more) was much higher following the 2007-09 recession at 4.9 million compared to 3.2 million after the 1981-82 recession and 1.3 million after the 1990-91 recession. It also shows that the longer a person is unemployed, the lower their chances are of finding a new job.
Debt ceiling & shutdown
The document discusses government spending proposals and cash levels, the cost to insure U.S. debt, and signs of skepticism from a European source. It provides data on proposed spending, cash levels of the government, the cost to insure U.S. debt, and skepticism about a policy measured in thousands of Euros from a European organization.
Obama vs. other presidents
Under Presidents Clinton and Carter, real GDP growth and job growth were the highest at around 13-12% and 12-9.9% respectively. In contrast, real hourly earnings declined the most under Presidents Carter and Obama at around -7.5% and -2.7%. Presidents Reagan and Bush 43 had moderate GDP growth around 12.6-9.2% but job growth was lower between 5-0.3% and real hourly earnings declined slightly under Reagan and increased the most under Bush 43 at 2.3%.
Deficit charts
The deficit has been reduced by $2.1 trillion so far through enacted measures. However, the debt ratio is projected to rise to 79% of GDP by 2022 without further actions. Healthcare costs, especially for Medicare and Medicaid, have been the main driver of rising deficits and are projected to increase to over 12% of GDP by 2022 if changes are not made.
Fiscal cliff v2
The document discusses periods of economic uncertainty in the United States including the 9/11 attacks, Iraq War, 2011 debt ceiling debate, and financial crisis. It shows graphs depicting declines in business investment spending and consumer confidence during these uncertain times according to data from the Commerce Department and University of Michigan surveys.
Retirement
Raising the Medicare eligibility age from 65 to 67 would be phased in gradually. This would require future seniors to either work longer or get private health insurance, increasing costs for Medicaid and Obamacare. Analysis from the Kaiser Family Foundation estimates around 5 million total beneficiaries would be affected by the higher eligibility age if implemented in 2014 along with provisions of the Affordable Care Act. Adopting a chained CPI to calculate Social Security benefits could reduce average annual benefits from around $17,220 to as low as $20,527 by 2022 according to data from the Washington Post, Bureau of Labor Statistics and Census Bureau.
Stock market
The stock market hit a record high of 16,086 according to data from the Bureau of Labor Statistics and Bloomberg. While corporate profits are rising, median household incomes have stagnated based on data from the Bureau of Economic Analysis, Bloomberg, and Sentier Research. A Gallup poll found that 52% of Americans do not invest in the stock market.
Manufacturing
The document contains 4 charts showing trends in US manufacturing from 2007-2013. The first chart shows that the number of manufacturing jobs declined steadily from 112.2 million in Dec-07 to 87.5 million in Dec-13. The second chart indicates that real hourly wages for production workers also fell from Jun-09 to Dec-13 after adjusting for inflation. The third chart displays that while US manufacturing pay is higher than most major economies, it is lower than countries like Germany and Belgium. And the fourth chart demonstrates that manufacturing now makes up a smaller portion of the US economy at around 12% compared to over 20% in countries like China, India and Germany.
Deficits
The document projects that federal deficits will rise between 2014 and 2024 according to CBO estimates, with discretionary spending declining as a percentage of GDP as war spending is drawn down. Medicare costs are also projected to moderate slightly as a percentage of GDP over this period.
Housing
Home prices in Las Vegas have fallen the most since August 2006 at -57.3%, while Washington D.C. saw the smallest decline at -3.7%. New housing starts dropped from 1,495,000 in January 2006 to 954,000 in January 2009. The 30-year mortgage rate fell from 6.63% in January 2006 to 3.38% in January 2009, providing some support. However, housing only contributed 0.31 percentage points to real GDP growth in Q4 2008, signaling the housing recession continued dragging on the economy.
Intrade
The document analyzes the results of the presidential election and key battleground states based on prediction market data from Intrade. It shows the Democratic candidate winning the national popular vote 70-30 and securing 303 electoral votes compared to the Republican candidate's 235. Several battleground states are listed as likely to be won by Democratic candidates like Warren, McCaskill, Donnelly, Murphy and Kaine, while Montana is predicted to go to the Republican Rehberg.
AspenPresentation_SteveRattner
The document summarizes issues facing capitalism today including jobs, wages, income inequality, and corporate short-termism. It finds that while the jobs picture has been strong, labor force participation is falling. Wages have barely risen despite rising productivity and corporate profits reaching near record highs. This is largely due to globalization, technology, tax policy, declining unionization, and "winners-take-all" labor markets. The U.S. also has the highest income inequality among developed nations and does less to redistribute income. However, business spending and R&D are better than perceived and firms that invest more in R&D see higher stock performance, suggesting corporations may not be as short-term as often believed.
Millennials website
Millennials are the most educated generation yet earn the least income of any generation. While 63% of 18-34 year olds have a college degree, their median earnings are only $35,000 - lower than previous generations despite higher costs of education. The high cost of college has risen 234% over inflation, leaving 71% of millennials in student loan debt averaging $15,000 per person.
Min wage final3
The document discusses how the real minimum wage has been declining when adjusted for inflation, cites cities that have hiked their minimum wages, and notes that as of May 2014, restaurant workers were among the lowest paid workers according to the Bureau of Labor Statistics.
Uber
Uber is replacing taxis as a transportation option, with 55% of US consumers having used Uber compared to 43% using taxis, and Uber is gaining market share across the US. The rise of Uber has also hurt taxi medallion prices, with data through January 2015 showing decreasing prices in cities like New York where Uber operates.
Greece final
Greece has high pension spending and low VAT collections compared to other European countries as of 2013. Greek government revenues and spending have both declined as of 2012 according to Eurostat, OECD, and WSJ data sources. The document discusses Greece's pension and tax revenue issues and declining government finances.
Greece final
Greece has experienced a worse recession than the Great Depression based on GDP decline from peak to trough. Greece also has the highest unemployment rate in Europe at 25.6%, which is significantly higher than other European countries such as Germany, the UK, and France. Additionally, Greece has a very high level of government debt as a percentage of GDP, making it one of the most heavily indebted countries in Europe.
Politicians nw final
The document compares the estimated net worth of 2016 presidential candidates Hillary Clinton and Donald Trump, as well as the average net worth of members of Congress versus average Americans. Hillary Clinton's estimated net worth is in the mid-point range of her disclosed assets plus estimated home values. Donald Trump claims a net worth of $9.2 billion, including $5.3 billion in real estate, $3.3 billion in brand value, and $0.3 billion each in cash and other assets, though Forbes estimates his worth to be $4.1 billion. The document also notes the average net worth of members of Congress compared to all Americans using data from the Center for Responsive Politics and Federal Reserve Survey of Consumer Finances.
Betting markets final
The document lists odds from PredictWise and Betfair for the 2016 GOP nomination, 2016 Democratic nomination, and odds of becoming President in 2016. It provides betting odds from two prediction markets on the outcomes of the 2016 United States presidential election primaries and general election.
More Related Content
Viewers also liked
Jobs
The jobs report showed another month of slow jobs growth, with only 75,000 jobs added in May. While the establishment survey showed slow growth, the household survey showed a decline in employment. Additionally, wages have remained stagnant, growing only 0.3% after adjusting for inflation over the past year.
Jobs
The document contains three charts with no labels or titles showing year-over-year change in real hourly wages, six month deficit in billions, and labor force participation rate at 63.3%. The charts provide high-level economic indicators but lack details to fully understand trends or time periods depicted.
Unemployment benefits
The document compares long-term unemployment following three recessions in the United States - the 2007-09 recession, the 1981-82 recession, and the 1990-91 recession. It shows that the number of long-term unemployed (those unemployed for 27 weeks or more) was much higher following the 2007-09 recession at 4.9 million compared to 3.2 million after the 1981-82 recession and 1.3 million after the 1990-91 recession. It also shows that the longer a person is unemployed, the lower their chances are of finding a new job.
Debt ceiling & shutdown
The document discusses government spending proposals and cash levels, the cost to insure U.S. debt, and signs of skepticism from a European source. It provides data on proposed spending, cash levels of the government, the cost to insure U.S. debt, and skepticism about a policy measured in thousands of Euros from a European organization.
Obama vs. other presidents
Under Presidents Clinton and Carter, real GDP growth and job growth were the highest at around 13-12% and 12-9.9% respectively. In contrast, real hourly earnings declined the most under Presidents Carter and Obama at around -7.5% and -2.7%. Presidents Reagan and Bush 43 had moderate GDP growth around 12.6-9.2% but job growth was lower between 5-0.3% and real hourly earnings declined slightly under Reagan and increased the most under Bush 43 at 2.3%.
Deficit charts
The deficit has been reduced by $2.1 trillion so far through enacted measures. However, the debt ratio is projected to rise to 79% of GDP by 2022 without further actions. Healthcare costs, especially for Medicare and Medicaid, have been the main driver of rising deficits and are projected to increase to over 12% of GDP by 2022 if changes are not made.
Fiscal cliff v2
The document discusses periods of economic uncertainty in the United States including the 9/11 attacks, Iraq War, 2011 debt ceiling debate, and financial crisis. It shows graphs depicting declines in business investment spending and consumer confidence during these uncertain times according to data from the Commerce Department and University of Michigan surveys.
Retirement
Raising the Medicare eligibility age from 65 to 67 would be phased in gradually. This would require future seniors to either work longer or get private health insurance, increasing costs for Medicaid and Obamacare. Analysis from the Kaiser Family Foundation estimates around 5 million total beneficiaries would be affected by the higher eligibility age if implemented in 2014 along with provisions of the Affordable Care Act. Adopting a chained CPI to calculate Social Security benefits could reduce average annual benefits from around $17,220 to as low as $20,527 by 2022 according to data from the Washington Post, Bureau of Labor Statistics and Census Bureau.
Stock market
The stock market hit a record high of 16,086 according to data from the Bureau of Labor Statistics and Bloomberg. While corporate profits are rising, median household incomes have stagnated based on data from the Bureau of Economic Analysis, Bloomberg, and Sentier Research. A Gallup poll found that 52% of Americans do not invest in the stock market.
Manufacturing
The document contains 4 charts showing trends in US manufacturing from 2007-2013. The first chart shows that the number of manufacturing jobs declined steadily from 112.2 million in Dec-07 to 87.5 million in Dec-13. The second chart indicates that real hourly wages for production workers also fell from Jun-09 to Dec-13 after adjusting for inflation. The third chart displays that while US manufacturing pay is higher than most major economies, it is lower than countries like Germany and Belgium. And the fourth chart demonstrates that manufacturing now makes up a smaller portion of the US economy at around 12% compared to over 20% in countries like China, India and Germany.
Deficits
The document projects that federal deficits will rise between 2014 and 2024 according to CBO estimates, with discretionary spending declining as a percentage of GDP as war spending is drawn down. Medicare costs are also projected to moderate slightly as a percentage of GDP over this period.
Housing
Home prices in Las Vegas have fallen the most since August 2006 at -57.3%, while Washington D.C. saw the smallest decline at -3.7%. New housing starts dropped from 1,495,000 in January 2006 to 954,000 in January 2009. The 30-year mortgage rate fell from 6.63% in January 2006 to 3.38% in January 2009, providing some support. However, housing only contributed 0.31 percentage points to real GDP growth in Q4 2008, signaling the housing recession continued dragging on the economy.
Intrade
The document analyzes the results of the presidential election and key battleground states based on prediction market data from Intrade. It shows the Democratic candidate winning the national popular vote 70-30 and securing 303 electoral votes compared to the Republican candidate's 235. Several battleground states are listed as likely to be won by Democratic candidates like Warren, McCaskill, Donnelly, Murphy and Kaine, while Montana is predicted to go to the Republican Rehberg.
Viewers also liked (14)
More from rattnerfamily
AspenPresentation_SteveRattner
The document summarizes issues facing capitalism today including jobs, wages, income inequality, and corporate short-termism. It finds that while the jobs picture has been strong, labor force participation is falling. Wages have barely risen despite rising productivity and corporate profits reaching near record highs. This is largely due to globalization, technology, tax policy, declining unionization, and "winners-take-all" labor markets. The U.S. also has the highest income inequality among developed nations and does less to redistribute income. However, business spending and R&D are better than perceived and firms that invest more in R&D see higher stock performance, suggesting corporations may not be as short-term as often believed.
Millennials website
Millennials are the most educated generation yet earn the least income of any generation. While 63% of 18-34 year olds have a college degree, their median earnings are only $35,000 - lower than previous generations despite higher costs of education. The high cost of college has risen 234% over inflation, leaving 71% of millennials in student loan debt averaging $15,000 per person.
Min wage final3
The document discusses how the real minimum wage has been declining when adjusted for inflation, cites cities that have hiked their minimum wages, and notes that as of May 2014, restaurant workers were among the lowest paid workers according to the Bureau of Labor Statistics.
Uber
Uber is replacing taxis as a transportation option, with 55% of US consumers having used Uber compared to 43% using taxis, and Uber is gaining market share across the US. The rise of Uber has also hurt taxi medallion prices, with data through January 2015 showing decreasing prices in cities like New York where Uber operates.
Greece final
Greece has high pension spending and low VAT collections compared to other European countries as of 2013. Greek government revenues and spending have both declined as of 2012 according to Eurostat, OECD, and WSJ data sources. The document discusses Greece's pension and tax revenue issues and declining government finances.
Greece final
Greece has experienced a worse recession than the Great Depression based on GDP decline from peak to trough. Greece also has the highest unemployment rate in Europe at 25.6%, which is significantly higher than other European countries such as Germany, the UK, and France. Additionally, Greece has a very high level of government debt as a percentage of GDP, making it one of the most heavily indebted countries in Europe.
Politicians nw final
The document compares the estimated net worth of 2016 presidential candidates Hillary Clinton and Donald Trump, as well as the average net worth of members of Congress versus average Americans. Hillary Clinton's estimated net worth is in the mid-point range of her disclosed assets plus estimated home values. Donald Trump claims a net worth of $9.2 billion, including $5.3 billion in real estate, $3.3 billion in brand value, and $0.3 billion each in cash and other assets, though Forbes estimates his worth to be $4.1 billion. The document also notes the average net worth of members of Congress compared to all Americans using data from the Center for Responsive Politics and Federal Reserve Survey of Consumer Finances.
Betting markets final
The document lists odds from PredictWise and Betfair for the 2016 GOP nomination, 2016 Democratic nomination, and odds of becoming President in 2016. It provides betting odds from two prediction markets on the outcomes of the 2016 United States presidential election primaries and general election.
Ct final
The document summarizes tax rates and economic indicators for the top 10 and bottom 10 states according to the 2015 State Business Tax Climate Index. The top 10 states had an average unemployment rate of 4.8% with GDP per capita of $49,956 and GDP growth of 2.5%, while the bottom 10 states had higher average unemployment of 5.2% with GDP per capita of $52,346 and lower GDP growth of 1.7%. Specific states like Florida, New Hampshire, and Texas had more favorable business climates and economic indicators than states like Connecticut and New York.
Ceo pay
CEO pay and Wall Street compensation have increased dramatically in recent years. While average American wages have grown modestly, top executives and bankers have seen their incomes skyrocket. This growing inequality threatens shared prosperity and economic security for working families.
Testimony steven rattner
Steven Rattner testified before the Senate Finance Committee on the need for tax reform. He argued that the tax code has deteriorated without reform in over 30 years, allowing lawyers and accountants to legally ease tax burdens for their wealthy clients. For example, the 400 highest income Americans saw their tax rate drop from 30% to 17% from 1995 to 2012 due largely to low capital gains and dividend rates. Rattner advocated achieving greater fairness and revenue by reducing the number of tax rates, eliminating special treatment of capital gains and dividends, and reducing loopholes that disproportionately benefit the wealthy.
Obamacare
Enrollment in Obamacare exchanges exceeded expectations, with over 8 million signing up in the 2014-2015 period. The number of uninsured Americans dropped significantly as a result of the Affordable Care Act, falling from over 40 million uninsured to around 28 million. The law expanded access to health insurance and lowered the rate of uninsured Americans.
Economy final
This document contains 3 sources from government agencies on economic indicators during economic recoveries: the Bureau of Economic Analysis on real GDP growth, the Bureau of Labor Statistics on job growth, and the Census Bureau on growth in real incomes.
Middle class final
Middle class wages have stagnated over the past few decades, growing only 40.6% compared to 6.1% growth for the top 1% and declining -5.3% for the bottom 20%. More recently, middle class wages have begun declining, falling -1.7% in recent years compared to further growth of 3.3% for the top 1% and a larger decline of -4.3% for the bottom 20%. Additionally, fewer Americans now think they belong to the middle class according to a recent poll.
Names final
A document from Verdant Labs lists popular names for Democrats and Republicans. For Republicans, common male names are Randy, Don, Kent, Wayne, and Dale, while common female names are Terry, Tammy, Becky, Patsy, and Debbie. For Democrats, common male names are Irving, Joshua, Jonathan, Robin, and Adam, while common female names are Kate, Naomi, Alexandra, Annie, and Miriam.
Names final
The document lists popular names associated with Republicans and Democrats. For Republicans, the top male names are Randy, Don, Kent, Wayne, and Dale. The top female names are Terry, Tammy, Becky, Patsy, and Debbie. For Democrats, the top male names are Irving, Joshua, Jonathan, Robin, and Adam. The top female names are Kate, Naomi, Alexandra, Annie, and Miriam.
Gdp
The U.S. economy grew at an annual rate of 6.9% in the fourth quarter of 2021, according to new data from the Bureau of Economic Analysis. This marked the strongest quarterly growth since the third quarter of 2020 and reflected continued recovery from the economic downturn caused by the COVID-19 pandemic. Consumer spending and business investment drove much of the growth in the final three months of the year.
Jobs final
Job growth has been strong over the past year averaging 192,000 new jobs per month according to the Bureau of Labor Statistics. However, labor force participation has declined to 62.8% and inflation-adjusted hourly wages have grown only 0.6% year-over-year, indicating stagnant wage growth despite low unemployment.
Russian economy final
The Russian stock market declined significantly as economic forecasts worsened. Russia's GDP growth is projected to slow to 6.2% in 2022 and 1.0% in 2023, down from previous estimates of 5.6% and 3.6% respectively. Russia relies heavily on oil and gas exports, with fossil fuels accounting for more than 60% of export revenue and 30% of the country's GDP as of 2012, according to data from the EIA and AEI.
Deficits final
The document projects that federal deficits will rise between 2014 and 2024 according to CBO estimates, with discretionary spending declining as a percentage of GDP as war spending is drawn down. Medicare costs are also projected to moderate slightly as a percentage of GDP over this period.
More from rattnerfamily (20)
Deficit plans 12.05.12
- 1. Stabilizing the Debt % of GDP 90% 2011 ratio: 68% 68% 62% Source: CBO, CBPP, CRFB
- 2. Deficit Reduction (2013-22) In trillions Source: CRFB, Obama/Boehner latest plans
- 3. Obama vs. Boehner Plans Note: Discretionary spending cuts include those enacted under the Budget Control Act of 2011 Source: Obama, Boehner latest plans