Decision tree flow chart powerpoint ppt templates.
•
1 like•752 views

The document contains several flow chart diagrams showing different processes and decision points. The flow charts include shapes representing steps like start/end, process, decision, and storage connected by arrows to show the flow. Some diagrams are annotated with descriptions of the processes they depict, such as catching a bus for school. Others are more conceptual examples intended to demonstrate how to construct a flow chart.

Recommended
More Related Content
Viewers also liked
Similar to Decision tree flow chart powerpoint ppt templates.
Similar to Decision tree flow chart powerpoint ppt templates. (20)
More from SlideTeam.net
More from SlideTeam.net (20)
Recently uploaded
Recently uploaded (20)
Decision tree flow chart powerpoint ppt templates.
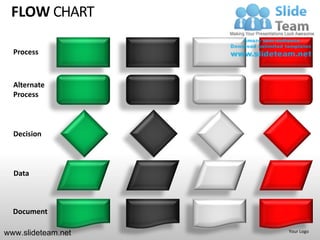
- 1. FLOW CHART Process Alternate Process Decision Data Document www.slideteam.net Your Logo
- 2. FLOW CHART Start 1 Start 2 Internal Storage Storage Data www.slideteam.net Your Logo
- 3. FLOW CHART Predefined Process Summary Delay Or www.slideteam.net Your Logo
- 4. FLOW CHART Multi Document Part/ Device/ Extract Completed Form Program Modification www.slideteam.net Your Logo
- 5. FLOW CHART Manual Input Punched Tape Card Direct Access Storage Sequential Access Storage www.slideteam.net Your Logo
- 6. FLOW CHART Display Manual Operation Off Page Connector Collate Sort www.slideteam.net Your Logo
- 7. FLOW CHART Terminator Merge Loop Limit Connector Example Text Example Text Example Text Example Text www.slideteam.net Your Logo
- 8. FLOW CHART www.slideteam.net Your Logo
- 9. FLOW CHART Inbox Project Example Is It No No Is It a Important? Want? Yes Yes @Someday/ May be Trash No Is It Is It Is It No No Actionable? Reference Urgent? Material? Yes Yes Yes @File Can I Do No Delegate No @Waiting For it now? it Yes Do it now www.slideteam.net Your Logo
- 10. FLOW CHART - Example www.slideteam.net Your Logo
- 11. FLOW CHART - 3D Example www.slideteam.net Your Logo
- 12. FLOW CHART – Catch Bus For School Leave home for School Check road for bus and for traffic No Yes Traffic jam No Walk Bus Coming in front quickly of bus Yes Take your time Catch bus www.slideteam.net Your Logo
- 13. FLOW CHART – 3D Flowchart To Catch Bus For School www.slideteam.net Your Logo
- 14. FLOW CHART - Example FLOW CHART Process Flowchart Start Example Alarm Delay Set for 5 Min. Rings Ready to No Hit Snooze Average 3 Get Up ? Button times Yes Climb Out of Bed End www.slideteam.net Your Logo
- 15. FLOW CHART - Example Start Alarm Delay Set for 5 Min. Rings Ready to No Hit Snooze Average 3 Get Up ? Button times Yes Climb Out of Bed End www.slideteam.net Your Logo
- 16. FLOW CHART – 3D Example www.slideteam.net Your Logo
- 17. FLOW CHART – CHART TOOL TEXT EXAMPLE TEXT EXAMPLE TEXT TEXT TEXT TEXT This is a example EXAMPLE TEXT EXAMPLE EXAMPLE EXAMPLE text. Go ahead EXAMPLE replace it with your own text. TEXT This is a example TEXT text. EXAMPLE EXAMPLE This is a example text. Go ahead replace it with your own text. This is a example text. www.slideteam.net Your Logo
- 18. FLOW CHART – CHART TOOL TEXT EXAMPLE TEXT TEXT TEXT EXAMPLE A TEXT EXAMPLE EXAMPLE EXAMPLE This is a example text. Go ahead replace it with your own text. TEXT This is a example EXAMPLE text. TEXT EXAMPLE This is a example text. Go ahead replace it with your own text. This is a example text. www.slideteam.net Your Logo
- 19. FLOW CHART – CHART TOOL TEXT TEXT TEXT TEXT EXAMPLE A TEXT This is a example EXAMPLE EXAMPLE EXAMPLE EXAMPLE text. Go ahead replace it with your own text. This is a example TEXT text. EXAMPLE This is a example text. Go ahead replace it with your own text. This is a example text. www.slideteam.net Your Logo
- 20. FLOW CHART – START TO FINISH 1 TEXT EXAMPLE TEXT TEXT TEXT B TEXT EXAMPLE 2 EXAMPLE EXAMPLE EXAMPLE This is a example text. Go ahead replace it with your own text. TEXT This is a example EXAMPLE text. TEXT EXAMPLE 1- Add Start of Flow chart and then add further Data, Document, Process, Connectors 2- Move further by taking decision yes or no and change shape colors as required. www.slideteam.net Your Logo
- 21. FLOW CHART www.slideteam.net Your Logo
- 22. FLOW CHART www.slideteam.net Your Logo
- 23. FLOW CHART www.slideteam.net Your Logo
- 24. FLOW CHART – CONVERT TO 3D FLOW CHART 1 2 3 1. Select the All shapes used in the Flow Chart, make First group of these shapes. 2. Select All text boxes and make a separate second group of these text boxes. 3. Select All Lines and make a separate third group of these Lines. www.slideteam.net Your Logo
- 25. FLOW CHART 3 1 2 1. Select First and second group combined, Right Click the groups . 2. Choose “Format Object “ in the dialog box. 3. Choose “3D Rotation” in the Format Object box then “Presets” depending on the appearance of the object. www.slideteam.net Your Logo
- 26. FLOW CHART – CONVERT TO 3D FLOW CHART 3 1 2 1. Select Third group of lines , Right Click the group. 2. Choose “Format Shape“ in the dialog box. 3. Choose “3D Rotation” in the Format Shape box then “Presets” depending on the appearance of the object. 4. After That adjust the lines according to your Flow Chart and change the colour of www.slideteam.net becomes lighter in colour. lines , if lines
- 27. All images are 100% editable in Powerpoint “Change color, size and orientation of any icon to your liking” www.slideteam.net
- 28. Ungrouping the object 2 1 3 1. Right click the object. 2. Choose Group and then Ungroup. 3. Click beside the object and drag the arrow over it. www.slideteam.net
- 29. Edit Color 2 3 1 1. Right click the object 2. Choose Format Shape in the dialog box 3. Choose “Fill” in the Format Shape box then “Solid” or “Gradient” depending on the appearance of the object. Change colour as shown in the picture. www.slideteam.net