David King received an overall performance rating of 4.0 out of 5 for his work as a Sales Analyst at Panasonic Electric Works from April 2009 to March 2010. He exceeded expectations on objectives to develop new reporting systems in ACES, update pricing information, and deliver monthly and weekly sales reports. The supervisor praised his leadership, communication skills, time management, and innovative approaches to reporting. Key future objectives are to automate reporting delivery and prioritize reports at the beginning of each month.
To ensure processes are working as expected, it's a good idea to pick a handful of metrics that measure key aspects. Some processes will be more critical to the delivery of value for your company.
The group of KPIs for your organization will become a dashboard for working in the business and working on the business discussions.
Facing problems in creating a presentation on supply chain management? Here we present our ready to use supply chain management performance PowerPoint presentation slides. Our order fulfilment PowerPoint templates will add value to your Presentation. This inventory management presentation slides will be helpful for operations managers to impress their middle management. This SCM presentation covers slides on inventory ratio, financial and non-financial measures, inventory KPIs, work-in-progress, inventory management, operational management. It also covers logistics, procurement and marketing, mind map and additional slides etc. This product development PowerPoint presentation can be used for the related topics inventory management, supply chain logistics flow, material management, raw-material management performance, circular supply chain management, goods and service flow, etc. Download our supply chain management performance PowerPoint Presentation template and impress your viewers. Folks feel intensely grateful due to our Supply Chain Management Performance PowerPoint Presentation Slides. They appreciate your gift of good advice.
Als generatie X zit je tussen twee onbegrijpelijke generaties in. Toch? Ik mocht een kampvuur sessie over dit onderwerp leiden obv kennis die ik bij verschillende opdrachten heb opgedaan. Hierbij de plaatjes voor iedereen die er niet bij was. Ik wil het best nog wel eens voorlezen voor het slapen gaan...
Hoe gebruik je de Sociale Media voor de promotie van een festival of evenement?Edwin Korver
Delen is vermenigvuldigen: "Hoe krijg je meer bezoekers naar de Nederlandse Jazzfestivals?". Meer in het algemeen geldt dit natuurlijk voor alle festivals en evenementen.
Sponzu cause related marketing and video advertising Sponzu
Cause-related marketing has exploded over the past few years, especially in times of corporate mistrust and heightened public awareness of the negative effect that big businesses have on the environment. Brands are increasingly looking to provide public awareness of its values and willingness to support good causes. To facilitate this demand Sponzu offers two sponsorship packages described in this presentation.
Assignment 1 LASA 2—Company Analysis ReportReview the following.docxtrippettjettie
Assignment 1: LASA 2—Company Analysis Report
Review the following scenario:
Assume that you have recently been hired as the director of continuous improvement of a company. You are an outside hire with limited history of the firm and personal capital at the firm, and you are responsible for lean production, total quality management (TQM), six sigma, and best practice implementation.
Lean production means doing more with less, such as less inventory, fewer workers, or less space. A recent trade in quality management is lean six sigma (also known as lean sigma) that integrates six sigma and lean production.
The capacity for which you were hired has existed for three years with a direct line of report to the vice-president of operations and dotted line of report to the head of information technology (IT), the chief information officer (CIO), and the director of internal controls and audit. You are the second person to fill in this position. You have a team of internal consultants; half of your team has six sigma black belt or equivalent capabilities with the remainder having a solid understanding of operations and IT. You also have a budget for two external vendor resources.
You have taken six months to familiarize yourself with the organization and its people, mission, goals, strategy, and structure. In this time, you have also evaluated current operations. At the end of this period, you are assigned to deliver a report identifying the three most promising avenues for achieving best practices within the company. You have already been told that the company suffers from both aging and complex information systems and that your recommendation must include a major upgrade of those systems. The executive officers anticipate major investments in IT over the next several years. Your best practice implementations, coupled with new technology, must be measurable in terms of speed, quality, productivity, and efficiency or other key performance indicators that you identify in your report.
For this assignment, you will choose a company with which you are familiar. You are encouraged to choose a company for which you currently work or have worked, but you may choose some other firm if you believe it will be a compelling analysis.
You may choose one area of the company, such as a manufacturing plant or product design, to focus on if you can make a strong case. Your recommendations should have the following features.
· Repeatable: If you “fix” three things in a manufacturing plant, you should be able to tackle the “next” three in iteration.
· Scalable: If they work in one plant, they should work in all of them.
· Replicable: Your process for improvement should be repeatable in different, disparate parts of the organization.
This is a key initiative at the “C” level, and your recommendation will reach the board of directors.
Your paper must include the following sections:
1. Strategic Overview: (1 page)
Provide a brief description of the following elements:
a. ...
BENEDICTINE UNIVERSITY
MBA 671: STRATEGIC MANAGEMENT
TEAM: Bomb Dot Com
BUSINESS SIMULATION PRESENTATION
1
Strategic Vision
AS AN ORGANIZATION, WE ARE MOTIVATED BY DEVOTION TO OUR WORK. WE ARE PROFESSIONALS IN FOOTWEAR IN OUR FIELD AND INCLUDE THE ENTIRE SUPPLY CHAIN IN ALL EXTENTS OF OUR BUSINESS, FROM INDUSTRIAL TO RETAIL.THESE SUCCESSES ARE THE RESULT OF OUR DEDICATION AND PLEDGE TO TRUTHFUL RELATIONS WITH THOSE WHO SHARE OUR GOAL.
OUR BUSINESS IMAGE HAS LED US TO NEW TASKS AND QUALIFIED US TO DISTRIBUTE THE BEST KEYS FOR EACH CONSUMER.
WE ARE ALWAYS LOOKING FORWARD, PROTECTED IN THE INFORMATION THAT OUR INVOLVEMENT HAS BROUGHT US THE PRINCIPLE AND CONSISTENCE NEEDED TO SELECT THE FINEST ROUTES.
2
Bomb dot com Performance for all the Decision Rounds
Bomb dot com is seeing great success with the company
Year over year, we have seen an increase in our company’s credit rating with a stable image rating.
ROE slightly increased with a stock price increase to $87.80 from $30.00 and net revenues went up for a total of 589,933 from 432,646.
SQ rating saw a significant increase from 4.0 to 7.6. EPS continue to rise year after year.
3
The Company’s Present Strategy and Its Evolution
Tell the story of how you got here from the beginning of the class.
Matthew
4
Your Companies Closest Competitors
Explain which companies in the group are your closet competitors and why.
Matthew
5
New Strategic Decisions to Win Market Share
If the game continued, some strategies to win market share would include
Re-finance loans – If the company continues to be successful, it will be important to re-finance loans in order to increase cash flow.
Predict Material Prices – This is based on supply and demand functions. This will be accomplished by watching SQ ratings. If ratings are increasing, so will material prices and vice versa.
Check Price Elasticity – We will set forecasts and test slightly higher price points on wholesale to ensure we are not missing out on any additional profit.
6
Trends in Annual Revenues
Stock Price has continued to see an increase
Earnings Per Share showing progress and growing year over year
Net Revenues have seen an increase in all three categories with a stable number for private label
7
Trends in Annual EPS
Use the bar graphs in the Performance Summary.
Employ a few discuss points – 2 to 4 or so – your choice.
Matthew
8
Trends in Annual ROE
Use the bar graphs in the Performance Summary.
Employ a few discuss points – 2 to 4 or so – your choice.
Matthew
9
Trends in Annual Credit Rating
Use the bar graphs in the Performance Summary.
Employ a few discuss points – 2 to 4 or so – your choice.
Michelle
10
Trends in Annual Year End Stock Price
Use the bar graphs in the Performance Summary.
Employ a few discuss points – 2 to 4 or so – your choice.
Michelle
11
Trends in Annual Image Rating
Use the bar graphs in the Performance Summary.
Employ a few discuss point.
David Stack: Financial Reporting: Building a Strong StructureDavid Stack
David Stack is a chief financial officer with over 20 years of success in leading global financial operations for growing companies, particularly those in the software as a service (SaaS) industry. In this presentation, David shares 6 essential categories of data that every financial advisor should use to identify upcoming trends in their business/organization.
David Stack: Reporting for Duty: The Case for a Strong Reporting Structure David Stack
From David Stack: "A critical aspect of a CFO’s role at a startup is facilitating the creation and implementation of a strong, comprehensive reporting structure. This reporting algorithm should evaluate the current health of the business by identifying key sensitivities in the business model, tracking progress in scaling the company, providing a useful dashboard for each separate department, and serving as a tool both the CEO and management team can use to grow the business. Additionally, a great reporting package will allow you to analyze your current data to identify upcoming trends."
Best Practices for Enterprise Performance ManagementPerficient, Inc.
A special webinar for Finance professionals
Looking forward to budget season? For many managers, the budget process is a painful, manual process driven by disconnected Excel spreadsheets that are error-prone, static, and generally non-collaborative. The result is a budget that becomes irrelevant as soon as the new fiscal year begins.
A more nimble response is needed. Budgeting and planning should be a continuous, flexible exercise based on rolling forecasts, and supported by systems that can adapt as the business climate changes.
Join us as we discuss how applying best practices and using an automated Enterprise Performance Management system can help intelligent enterprises reap the benefits of flexible budgeting, accurate forecasting and dynamic planning. By implementing best practices for budgeting and planning, you can:
- Make the budget process less painful
- Replace spreadsheets with web forms
- Automate the budget roll-up process
- Create budgets based on key business drivers
- Link strategic goals to operational decisions
- Integrate financial “actuals” with budget and forecast data
- Provide easy, real-time variance reporting
- Access a single version of the truth for financial information
Presenter Emil Fernandez is General Manager of Perficient's national Enterprise Performance Management practice.
Objective: Contracted as an outside auditor, the objective was to perform an analysis for opportunities to enhance data analytics and measurement of campaign performance for several Elanco pet brands from available data repositories including evolving dashboard environments and brand websites.
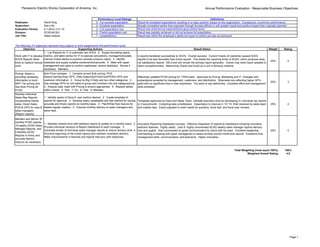
1. Panasonic Electric Works Corporation of America, Inc. Annual Performance Evaluation - Measurable Business Objectives
Performance Level Ratings
Employee:
David King
5 - Far exceeds expectation
Supervisor:
Dan Litts
4 - Exceeds expectation
Evaluation Period:
4-1-09 to 3-31-10
3 - Full expectation met
Division:
PCSD/ACSD
2 - Partial expectation met
Job Title:
Sales Analyst
1 - Unsatisfactory
Objective
Result Status
Weight
Rating
Work with IT to develop ACES Reports (Real time) to replace manual work.
4 reports transfered successfully to ACES. Overall success. Current Oracle v9 restraints caused ACES reports to be less favorable than Excel reports. This tested the reporting limits of ACES, which produces okay, not satisfactory reports. MS Excel will remain the primary report generator. Oracle may need future updates to retain competitiveness. Maximizing Oracle and Excel as a unit is followup initiative.
25%
4
Pricing: Assist in providing necessary information to build MPP Tier pricing and new Bulk Pricing for PCSD.
Effectively updated PCSD pricing for 17000 parts. Approved by Pricing, Marketing and IT. Changes and explanations accepted by management, customers, and distributors. Shipments are reflecting higher GP% parts with no significant loss in total shipments. Too early to say definitively. Excellent effort and management skills exhibited.
25%
3
Develop individual Sales Rep Reports incorporating Global sales, Direct Sales, POS & GP% for reps & sales managers (Region reports)
Templates approved by Dave and Sales Team. Ultimate execution time for developing 31 individual rep reports is 3 hours/month. Compiling data is bottleneck. Expectation to improve in 1H '10. Well received by sales team and outside reps. Easily adjusted to meet needs for quarterly, fiscal half, and fiscal year reviews.
25%
4
Maintain and deliver 35 monthly PCSD reports, 16 weekly ACSD Sales Manager Reports, and 5 Monthly ACSD Reports in timely and accurate fashion. Improve as necessary.
Innovative Reporting Dashboard concept. Effective integration of reports to Dashboard including innovative selection features. Highly useful. Josh A. highly commended ACSD weekly sales manager reports delivery time and quality. Also commented on great communication by David with his team. Excellent leadership commanding a meeting with upper managemen to lessen anxiety around month-end reports. Excellend time management skills, communication, and teamwork. Highly innovative.
25%
5
Total Weighting (must equal 100%):
100%
Weighted Overall Rating:
4.0
1. Maintain shared drive with standard reports & update on a monthly basis. 2. Provide individual versions of Report Dashboard to each manager. 3. Automate emails of individual sales manager reports to reduce delivery time. 4. Prioritize beginning of the month reports and maintain consistent delivery. Make improvements in features and reports that sync with objectives.
The following 3-4 objectives represent key projects or work assignments this performance cycle.
Definitions
Result far exceeded expectations resulting in a major positive impact on the organization. Exceptional, uncommon performance.
Results completed earlier than expected through focused efforts or with greater result and positive impact than originally planned.
Result was achieved as expected/solid good performance.
Result was partially achieved or did not achieve full expectation.
Result was within the employee's ability and span of control yet was not achieved.
Supporting Actions
1. List Reports for IT to automate into ACES. 2. Supply formatting specs, metrics, and table names for IT to execute calculations, manage/manipulate internal Oracle tables to produce correctly produce output. 3. Identify obstacles and supply suitable solutions/workarounds. 4. Meet with upper management and sales to confirm usefulness, receive feedback. Revise if necessary. Maintain.
Bulk Price Increase: 1. Compile current Bulk pricing, POS Sales/Cost/Qty/Disty GP%, Disty Sales/Qty/Price/Cost/PEWA GP% and customer information. 2. Group by Big 3 Disty and two other categories. 3. Use average GP% by unit sales to group part numbers into one category/price. 4. Analyze data, meet with Pricing to ensure appropriate. 5. Replace tables within Oracle. 6. Test. 7. Fix. 8. Test. 9. Maintain.
1. Identify needs of Dave K. and metrics desired. 2. Create template of reports for approval. 3. Develop easily updateable and fast method for issuing accurate and timely reports on monthly basis. 4. Plan/Write/Test macros for fastest regular creation. 5. Execute monthly delivery to sales managers and sales reps.
Page 1