Download to read offline


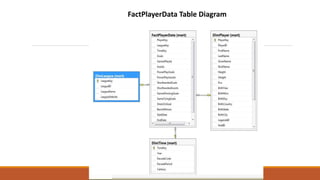
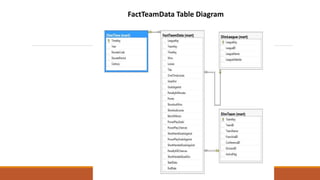
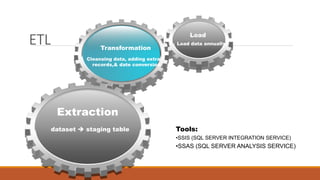


This document summarizes a presentation about analyzing hockey statistics from various teams and players over multiple years. It discusses designing dimension and fact tables to store the data, extracting and transforming the raw data using SSIS and SSAS, and answering business questions by demonstrating OLAP on metrics like power play conversion percentages and physical capacity. The presentation concludes with a Q&A section.


