CHAPTER 2
CHAPTER 2
DatabaseDesign:
Database Design:
Data Modeling and Normalization
Data Modeling and Normalization
2.
IN THIS CHAPTER. . .
IN THIS CHAPTER . . .
You will learn about database
You will learn about database
modeling techniques.
modeling techniques.
You will work with symbols and E-R
You will work with symbols and E-R
diagrams (ERD) for representation of
diagrams (ERD) for representation of
entities and relationships.
entities and relationships.
Types of dependencies within a
Types of dependencies within a
table.
table.
Reduction of data redundancy and
Reduction of data redundancy and
the process of normalization.
the process of normalization.
3.
DATA MODELING
DATA MODELING
A model is a simplified version of real-life, complex
A model is a simplified version of real-life, complex
objects. Databases are complex, and data modeling is a
objects. Databases are complex, and data modeling is a
tool to represent the various components and their
tool to represent the various components and their
relationships. The entity - relationship (E-R) model is a
relationships. The entity - relationship (E-R) model is a
very popular modeling tool among many such tools
very popular modeling tool among many such tools
available today. Many tools are available for data
available today. Many tools are available for data
modeling with E-R. All tools have some variations in
modeling with E-R. All tools have some variations in
representation of components. The E-R model provides:
representation of components. The E-R model provides:
An excellent communication tool.
An excellent communication tool.
A simple graphical representation of data.
A simple graphical representation of data.
The E-R model uses
The E-R model uses E-R diagrams (ERD
E-R diagrams (ERD) for graphical
) for graphical
representation of the database components. An
representation of the database components. An entity
entity (or
(or
an entity set) is represented by a rectangle. The name of
an entity set) is represented by a rectangle. The name of
the entity (set) is written within the rectangle. Some tools
the entity (set) is written within the rectangle. Some tools
prefer to use uppercase letters only for entities. The name
prefer to use uppercase letters only for entities. The name
of an entity set is a singular noun.
of an entity set is a singular noun.
4.
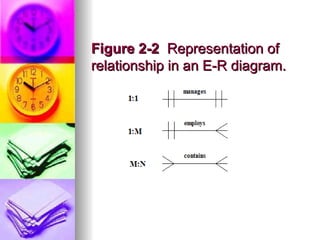
A line representsrelationship between the two entities. The
A line represents relationship between the two entities. The
name of the relationship is an active verb in lowercase
name of the relationship is an active verb in lowercase
letters. For example,
letters. For example, works,
works, manages,
manages, and
and employs
employs are
are
active verbs. Passive verbs can be used, but active verbs are
active verbs. Passive verbs can be used, but active verbs are
preferable (see textbook Fig. 2-2).
preferable (see textbook Fig. 2-2).
The types of relationships (1:1, 1:M, and M:N) between
The types of relationships (1:1, 1:M, and M:N) between
entities are called connectivity or multiplicity. The connectivity
entities are called connectivity or multiplicity. The connectivity
is shown with vertical or angled lines next to each entity, as
is shown with vertical or angled lines next to each entity, as
shown in Figure 2-2.
shown in Figure 2-2.
For example:
For example:
An EMPLOYEE supervises a DEPARTMENT, and a
An EMPLOYEE supervises a DEPARTMENT, and a
DEPARTMENT has one EMPLOYEE supervisor.
DEPARTMENT has one EMPLOYEE supervisor.
A DIVISION contains many FACULTY members, but a
A DIVISION contains many FACULTY members, but a
FACULTY works for one DIVISION.
FACULTY works for one DIVISION.
An INVOICE contains many ITEMS and an ITEM can be in
An INVOICE contains many ITEMS and an ITEM can be in
more than one INVOICE.
more than one INVOICE.
5.
Figure 2-2
Figure 2-2Representation of
Representation of
relationship in an E-R diagram.
relationship in an E-R diagram.
6.
The relationshipbetween two entities can be given using
the lower and upper limits. This information is called the
cardinality. The cardinality is written next to each entity
in the form (n,m), where n is the minimum number and
m is the maximum number.
For example, (1,1) next to EMPLOYEE means that an
employee can supervise a minimum of one and a
maximum of one department. Similarly, (1,1) next to
DEPARTMENT says that one and only one employee
supervises the department. The value (1,N) means a
minimum of one and a maximum equal to any number
(see textbook Fig. 2-4).
Some modern tools do not show cardinality in an E-R
diagram. In reality, corporations set rules for the
minimum and maximum values for cardinality. A
corporation may decide that a department must have a
minimum of 10 employees and a maximum of 25
employees, which results in cardinality of (10,25). A
college decides that a computer-science course section
must have at minimum 5 students to recover the cost
incurred and at maximum 35 students, because the
computer lab contains only 35 terminals. An employee
can be part of zero or more than one department, and
an item may not be in any invoice! These types of
decisions are known as business rules.
7.
In reallife, it is possible to have an entity that is not related to
another entity at all times. The relationship becomes optional
in such a case. In the example of a video rental store, a
customer can rent video movies. In this caser, there are times
when the customer has not rented any movie, and there are
times when the customer has rented one or more
movies. Similarly, there can be a movie in the database that is
or is not rented at a particular time. These are called optional
relationships and are shown with a small circle next to the
optional entity (textbook Fig. 2-5). The optional relationship
can occur in 1:1, 1:M, or M:N relationships, and it can occur
on one or both sides of the relationship.
In relational databases, many-to-many (M:N) relationships are
allowed, but they are not easy to implement. For example, an
invoice has many items and an item can be in many invoices.
The decomposition from M:N to 1:M involves a third entity,
known as a composite entity or an associative entity. The
composite entity is created with the primary key from both
tables with M:N relationships. The new entity has a composite
key, which is a combination of primary keys from the original
two entities. In the E-R diagram, a composite entity is drawn
as a diamond within a rectangle (see Fig. 2-6). The composite
entity has a composite primary key with two columns, each of
them being foreign keys referencing the other two entities in
the database. For example, the foreign key INVOICENO in
the INVITEM table references the INVOICENO column in the
INVOICE table, and the foreign key ITEMNO in the INVITEM
table references the ITEMNO column in the ITEM table.
8.
Some of theother elements
considered in the database design
are:
Simple attributes—attributes that cannot be subdivided;
for example, last name, city, or gender.
Composite attributes—attributes that can be subdivided,
into atomic form; for example, a full name can be
subdivided into the last name, first name, and middle
initial.
Single-valued attributes—attributes with a single value;
for example, Employee ID, Social Security number, or date
of birth.
Multivalued attributes—attributes with multiple values; for
example, degree codes or course registration. The
multivalued attributes have to be given special
consideration. They can be entered into one attribute with
a value separator mark, or they can be entered in separate
attributes with names like Course1, Course2, Course3,
and so on. Alternatively, a separate composite entity can
be created.
9.
DEPENDENCY
DEPENDENCY
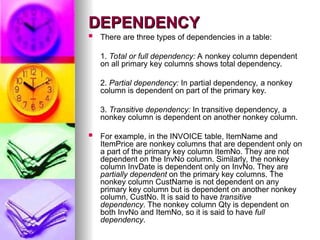
There arethree types of dependencies in a table:
1. Total or full dependency: A nonkey column dependent
on all primary key columns shows total dependency.
2. Partial dependency: In partial dependency, a nonkey
column is dependent on part of the primary key.
3. Transitive dependency: In transitive dependency, a
nonkey column is dependent on another nonkey column.
For example, in the INVOICE table, ItemName and
ItemPrice are nonkey columns that are dependent only on
a part of the primary key column ItemNo. They are not
dependent on the InvNo column. Similarly, the nonkey
column InvDate is dependent only on InvNo. They are
partially dependent on the primary key columns. The
nonkey column CustName is not dependent on any
primary key column but is dependent on another nonkey
column, CustNo. It is said to have transitive
dependency. The nonkey column Qty is dependent on
both InvNo and ItemNo, so it is said to have full
dependency.
10.
DATABASE DESIGN
DATABASE DESIGN
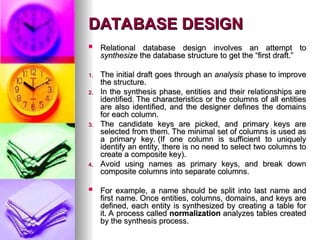
Relational database design involves an attempt to
Relational database design involves an attempt to
synthesize
synthesize the database structure to get the “first draft.”
the database structure to get the “first draft.”
1.
1. The initial draft goes through an
The initial draft goes through an analysis
analysis phase to improve
phase to improve
the structure.
the structure.
2.
2. In the synthesis phase, entities and their relationships are
In the synthesis phase, entities and their relationships are
identified. The characteristics or the columns of all entities
identified. The characteristics or the columns of all entities
are also identified, and the designer defines the domains
are also identified, and the designer defines the domains
for each column.
for each column.
3.
3. The candidate keys are picked, and primary keys are
The candidate keys are picked, and primary keys are
selected from them. The minimal set of columns is used as
selected from them. The minimal set of columns is used as
a primary key. (If one column is sufficient to uniquely
a primary key. (If one column is sufficient to uniquely
identify an entity, there is no need to select two columns to
identify an entity, there is no need to select two columns to
create a composite key).
create a composite key).
4.
4. Avoid using names as primary keys, and break down
Avoid using names as primary keys, and break down
composite columns into separate columns.
composite columns into separate columns.
For example, a name should be split into last name and
For example, a name should be split into last name and
first name. Once entities, columns, domains, and keys are
first name. Once entities, columns, domains, and keys are
defined, each entity is synthesized by creating a table for
defined, each entity is synthesized by creating a table for
it. A process called
it. A process called normalization
normalization analyzes tables created
analyzes tables created
by the synthesis process.
by the synthesis process.
11.
NORMAL FORMS
NORMAL FORMS
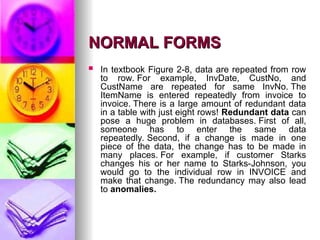
In textbook Figure 2-8, data are repeated from row
to row. For example, InvDate, CustNo, and
CustName are repeated for same InvNo. The
ItemName is entered repeatedly from invoice to
invoice. There is a large amount of redundant data
in a table with just eight rows! Redundant data can
pose a huge problem in databases. First of all,
someone has to enter the same data
repeatedly. Second, if a change is made in one
piece of the data, the change has to be made in
many places. For example, if customer Starks
changes his or her name to Starks-Johnson, you
would go to the individual row in INVOICE and
make that change. The redundancy may also lead
to anomalies.
12.
NORMAL FORMS -ANOMALIES
NORMAL FORMS - ANOMALIES
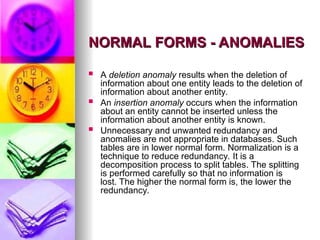
A deletion anomaly results when the deletion of
information about one entity leads to the deletion of
information about another entity.
An insertion anomaly occurs when the information
about an entity cannot be inserted unless the
information about another entity is known.
Unnecessary and unwanted redundancy and
anomalies are not appropriate in databases. Such
tables are in lower normal form. Normalization is a
technique to reduce redundancy. It is a
decomposition process to split tables. The splitting
is performed carefully so that no information is
lost. The higher the normal form is, the lower the
redundancy.
13.
NORMAL FORMS –
NORMALFORMS –
First Normal Form (1NF)
First Normal Form (1NF)
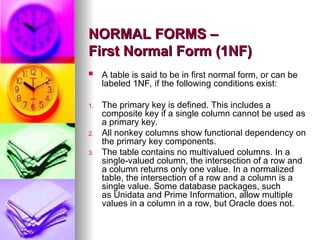
A table is said to be in first normal form, or can be
labeled 1NF, if the following conditions exist:
1. The primary key is defined. This includes a
composite key if a single column cannot be used as
a primary key.
2. All nonkey columns show functional dependency on
the primary key components.
3. The table contains no multivalued columns. In a
single-valued column, the intersection of a row and
a column returns only one value. In a normalized
table, the intersection of a row and a column is a
single value. Some database packages, such
as Unidata and Prime Information, allow multiple
values in a column in a row, but Oracle does not.
14.
NORMAL FORMS –
NORMALFORMS –
Second Normal Form (2NF)
Second Normal Form (2NF)
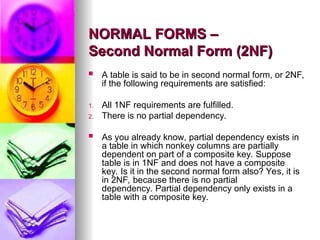
A table is said to be in second normal form, or 2NF,
if the following requirements are satisfied:
1. All 1NF requirements are fulfilled.
2. There is no partial dependency.
As you already know, partial dependency exists in
a table in which nonkey columns are partially
dependent on part of a composite key. Suppose
table is in 1NF and does not have a composite
key. Is it in the second normal form also? Yes, it is
in 2NF, because there is no partial
dependency. Partial dependency only exists in a
table with a composite key.
15.
NORMAL FORMS –
NORMALFORMS –
Third Normal Form (3NF)
Third Normal Form (3NF)
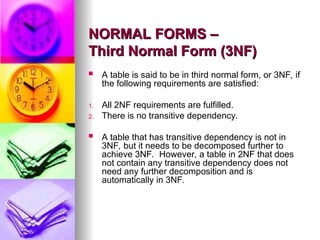
A table is said to be in third normal form, or 3NF, if
the following requirements are satisfied:
1. All 2NF requirements are fulfilled.
2. There is no transitive dependency.
A table that has transitive dependency is not in
3NF, but it needs to be decomposed further to
achieve 3NF. However, a table in 2NF that does
not contain any transitive dependency does not
need any further decomposition and is
automatically in 3NF.
16.
DEPENDENCY DIAGRAMS
DEPENDENCY DIAGRAMS
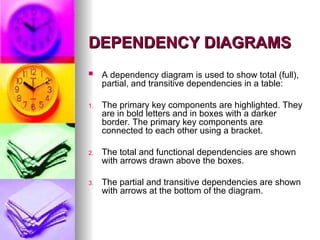
A dependency diagram is used to show total (full),
partial, and transitive dependencies in a table:
1. The primary key components are highlighted. They
are in bold letters and in boxes with a darker
border. The primary key components are
connected to each other using a bracket.
2. The total and functional dependencies are shown
with arrows drawn above the boxes.
3. The partial and transitive dependencies are shown
with arrows at the bottom of the diagram.
17.
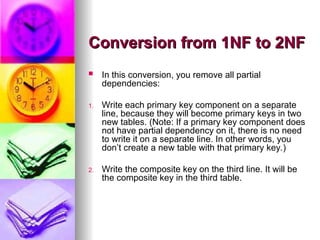
Conversion from 1NFto 2NF
Conversion from 1NF to 2NF
In this conversion, you remove all partial
dependencies:
1. Write each primary key component on a separate
line, because they will become primary keys in two
new tables. (Note: If a primary key component does
not have partial dependency on it, there is no need
to write it on a separate line. In other words, you
don’t create a new table with that primary key.)
2. Write the composite key on the third line. It will be
the composite key in the third table.
18.
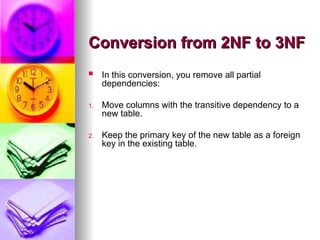
Conversion from 2NFto 3NF
Conversion from 2NF to 3NF
In this conversion, you remove all partial
dependencies:
1. Move columns with the transitive dependency to a
new table.
2. Keep the primary key of the new table as a foreign
key in the existing table.
19.
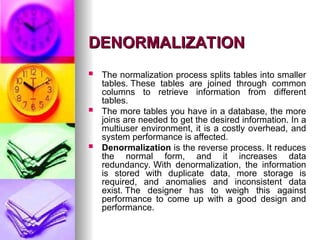
DENORMALIZATION
DENORMALIZATION
The normalizationprocess splits tables into smaller
tables. These tables are joined through common
columns to retrieve information from different
tables.
The more tables you have in a database, the more
joins are needed to get the desired information. In a
multiuser environment, it is a costly overhead, and
system performance is affected.
Denormalization is the reverse process. It reduces
the normal form, and it increases data
redundancy. With denormalization, the information
is stored with duplicate data, more storage is
required, and anomalies and inconsistent data
exist. The designer has to weigh this against
performance to come up with a good design and
performance.