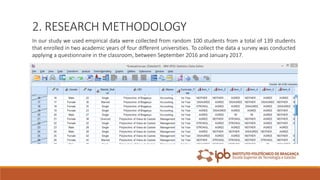
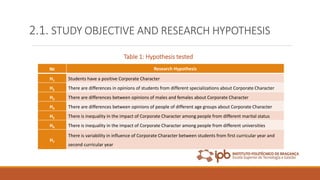
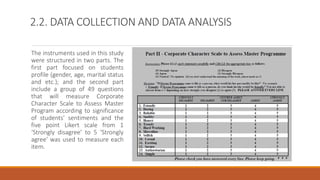
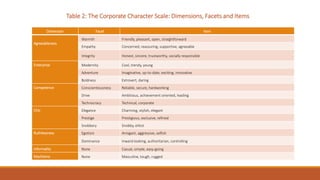
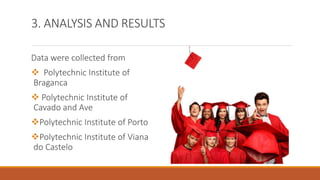
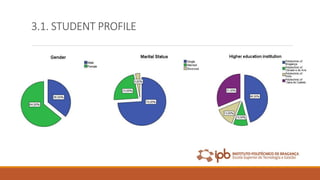
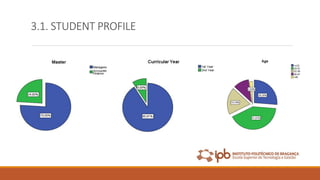
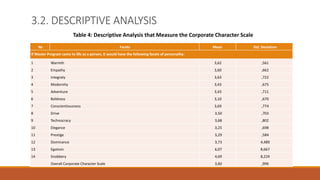
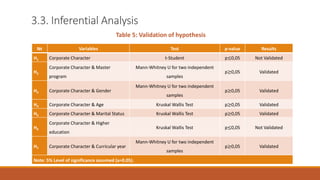
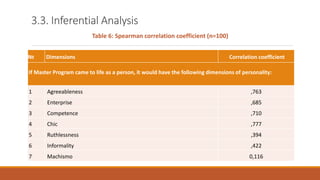
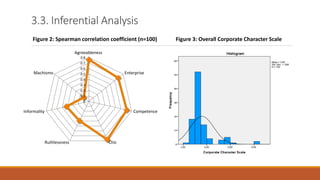
SlideShare a Scribd company logo
1 of 21
The sentiments of Corporate Character Scale among students
from different universities towards to Master program
Project submitted for assessment of the Curricular Unit:
Data Analysis
of the Master Program in Management
Elena Trubacheva (Kuban State Agrarian University, Krasnodar, Russia)
Pratik Iyengar (Instituto Polytechnico De Braganca, Braganca, Portugal)
Salman Khan Raza (Instituto Polytechnico De Braganca, Braganca, Portugal)
2016/2017
CONTENT
• Introduction
• Literature review
• Research methodology
• Analysis and results
• Conclusion
INTRODUCTION
Higher education has emerged as an indispensable
experience in the life of an individual seeking
knowledge and expertise in today’s world by the
virtue of the versatility necessitated by the
Corporate World from Students who choose a
particular specialization whilst advancing from the
Bachelor level to the Masters level of studies.
In order to ensure a detailed
understanding of the relationship
between students and their choices
of Master programs, it is imperative
for Deans or Management Boards of
Higher Education Institutions to be
well aware of all possible sentiments
of the Corporate Character Scale
(CCS) and their significance among
students across different Universities
towards Master programs.
OBJECTIVE
1. LITERATURE REVIEW
Student's roles in the higher education system are the subject of many discussions in the higher
education quality literature. Some authors argue that students are customers, as in other
service industries, because they pay a significant amount for their education (Kanji & Tambi,
2009). Other researchers claim that students are products of the higher education system
(Harris, 1992). Recent studies accept the definition of students-as-a-customers in higher
education, pointing out that students share responsibility for the results they obtain in the
education process (Eagle & Brennan, 2007; Elassy, 2013).
1. LITERATURE REVIEW
Allen Brown (1997) thinks that over the past few years the number of universities the world over has
increased as a result of polytechnics and some colleges of higher education being reclassified as
universities. Consequently there are now considerably more opportunities in all aspects of higher
education, including education to Master’s degree level. There is every indication that this expansion will
continue for foreseeable future.
In order to ensure a detailed understanding of the relationship between students and their choices of
Master programs, it is imperative for Deans or Management Boards of Higher Education Institutions to be
well aware of all possible sentiments of the Corporate Character Scale (CCS) and their significance among
students across different Universities towards Master programs.
2. RESEARCH METHODOLOGY
In our study we used empirical data were collected from random 100 students from a total of 139 students
that enrolled in two academic years of four different universities. To collect the data a survey was conducted
applying a questionnaire in the classroom, between September 2016 and January 2017.
2.1. STUDY OBJECTIVE AND RESEARCH HYPOTHESIS
Table 1: Hypothesis tested
№ Research Hypothesis
H1 Students have a positive Corporate Character
H2 There are differences in opinions of students from different specializations about Corporate Character
H3 There are differences between opinions of males and females about Corporate Character
H4 There are differences between opinions of people of different age groups about Corporate Character
H5 There is inequality in the impact of Corporate Character among people from different marital status
H6 There is inequality in the impact of Corporate Character among people from different universities
H7
There is variability in influence of Corporate Character between students from first curricular year and
second curricular year
The instruments used in this study
were structured in two parts. The
first part focused on students
profile (gender, age, marital status
and etc.); and the second part
include a group of 49 questions
that will measure Corporate
Character Scale to Assess Master
Program according to significance
of students’ sentiments and the
five point Likert scale from 1
‘Strongly disagree’ to 5 ‘Strongly
agree’ was used to measure each
item.
2.2. DATA COLLECTION AND DATA ANALYSIS
Dimension Facet Item
Agreeableness
Warmth Friendly, pleasant, open, straightforward
Empathy Concerned, reassuring, supportive, agreeable
Integrity Honest, sincere, trustworthy, socially responsible
Enterprise Modernity Cool, trendy, young
Adventure Imaginative, up-to-date, exciting, innovative
Boldness Extrovert, daring
Competence Conscientiousness Reliable, secure, hardworking
Drive Ambitious, achievement oriented, leading
Technocracy Technical, corporate
Chic Elegance Charming, stylish, elegant
Prestige Prestigious, exclusive, refined
Snobbery Snobby, elitist
Ruthlessness Egotism Arrogant, aggressive, selfish
Dominance Inward-looking, authoritarian, controlling
Informality None Casual, simple, easy-going
Machismo None Masculine, tough, rugged
Table 2: The Corporate Character Scale: Dimensions, Facets and Items
3. ANALYSIS AND RESULTS
Data were collected from
 Polytechnic Institute of
Braganca
 Polytechnic Institute of
Cavado and Ave
Polytechnic Institute of Porto
Polytechnic Institute of Viana
do Castelo
3.1. STUDENT PROFILE
3.2. DESCRIPTIVE ANALYSIS
№ Facets Mean Std. Deviation
If Master Program came to life as a person, it would have the following facets of personality:
1 Warmth 3,62 ,561
2 Empathy 3,60 ,662
3 Integraty 3,63 ,722
4 Modernity 3,43 ,675
5 Adventure 3,43 ,711
6 Boldness 3,10 ,670
7 Conscientiousness 3,69 ,774
8 Drive 3,50 ,703
9 Technocracy 3,68 ,802
10 Elegance 3,25 ,698
11 Prestige 3,29 ,584
12 Dominance 3,73 4,489
13 Egotism 6,07 8,667
14 Snobbery 4,69 8,224
Overall Corporate Character Scale 3,60 ,996
Table 4: Descriptive Analysis that Measure the Corporate Character Scale
№ Variables Test p-value Results
H1 Corporate Character t-Student p≤0,05 Not Validated
H2
Corporate Character & Master
program
Mann-Whitney U for two independent
samples
p≥0,05 Validated
H3 Corporate Character & Gender
Mann-Whitney U for two independent
samples
p≥0,05 Validated
H4 Corporate Character & Age Kruskal Wallis Test p≥0,05 Validated
H5 Corporate Character & Marital Status Kruskal Wallis Test p≥0,05 Validated
H6
Corporate Character & Higher
education
Kruskal Wallis Test p≤0,05 Not Validated
H7 Corporate Character & Curricular year
Mann-Whitney U for two independent
samples
p≥0,05 Validated
Note: 5% Level of significance assumed (a=0.05).
3.3. Inferential Analysis
Table 5: Validation of hypothesis
№ Dimensions Correlation coefficient
If Master Program came to life as a person, it would have the following dimensions of personality:
1 Agreeableness ,763
2 Enterprise ,685
3 Competence ,710
4 Chic ,777
5 Ruthlessness ,394
6 Informality ,422
7 Machismo 0,116
3.3. Inferential Analysis
Table 6: Spearman correlation coefficient (n=100)
3.3. Inferential Analysis
0
0.1
0.2
0.3
0.4
0.5
0.6
0.7
0.8
Agreeableness
Enterprise
Competence
ChicRuthlessness
Informality
Machismo
Figure 2: Spearman correlation coefficient (n=100) Figure 3: Overall Corporate Character Scale
CONCLUSION
It was discovered that the Corporate Character of our respondents is dominated
by positive dimensions of agreeableness and chic, however chic has snobbery as
the only negative facet associated with it and almost dimensions have a positive
and strong relationship with Corporate Character of Master Program.
In this end it is possible to say with
a statistical significance that there
is a positive relationship between
dimensions and Corporate
Character of Master Program.
References
• Alves, H., & Raposo, M. (2007). Conceptual Model of Student Satisfaction
in Higher Education. Total Quality Management & Business Excellence,
18(5): 571-588.
• Allen Brown (1997). Gaining the Master’s degree: How do invest in your
own future. Student handbooks, 15-16.
• Asif, M., & Searcy; C. (2014). Determining the Key Capabilities Required
for Performance
• Excellence in Higher Education. Total Quality Management & Business
Excellence, 25(1-2): 22-35.
• Clinton Conrad, Jenifer Grant Haworth ,Susan Bolyard Millar (1993). A
Silent Success: Master’s Education in the United States. The Johns
Hopkins University Press, 24-25.
• Churchill, G.A., Jr. (1979) ‘A paradigm for developing better measures of
marketing constructs’, Journal of Marketing Research, 64–73.
• Dave Ellis (2014). Becoming a Master Student . 15th Edition. Cengage
learning, 265-267. Duque, L.C. (2013). A framework for analyzing higher
education performance: Students’ satisfaction, perceived learning
outcomes, and dropout intention. Total Quality Management and
Business Excellence, 25(1–2), 1–21.
References
• Eagle, L., & Brennan, R. (2007). Are students customers? TQM and
marketing perspectives. Quality Assurance in Education, 15(1), 44–60.
• Elassy, N. (2013). A model of student involvement in the quality
assurance system at institutional level. Quality Assurance in Education,
21(2), 162–198.
• Kanji, G.K., & Tambi, A.M.A. (1999). Total quality management in UK
higher education institutions. Total Quality Management, 10(1), 129–153.
• Owlia, M.S., & Aspinwall, E.M. (1996). Quality in higher education – a
survey. Total Quality Management, 7(2), 161–171.
• Quinn, A., Lemay, G., Larsen, P., & Johnson, D.M. (2009). Service quality in
higher education. Total Quality Management, 20(2), 139–152.
• Sahney, S., Banwet, D.K., & Karunes, S. (2004). Conceptualizing total
quality management in higher education. The TQM Magazine, 16(2),
145–159.
• Spector, P.E. (1992) ‘Summation Rating Scale Construction: An
Introduction’, Sage Publications, Newbury Park, CA.
Elena Trubacheva (Kuban State Agrarian University, Krasnodar, Russia)
Pratik Iyengar (Instituto Polytechnico De Braganca, Braganca, Portugal)
Salman Khan Raza (Instituto Polytechnico De Braganca, Braganca, Portugal)
2016/2017

More Related Content

What's hot

Module 4b assessment
Module 4b assessmentModule 4b assessment
Module 4b assessment
melanielayttu
 
Teaching to a_test_worth_teaching_to_reformat_
Teaching to a_test_worth_teaching_to_reformat_Teaching to a_test_worth_teaching_to_reformat_
Teaching to a_test_worth_teaching_to_reformat_
wahinescholar
 
11.descriptive evaluation of the primary schools an overview
11.descriptive evaluation of the primary schools an overview11.descriptive evaluation of the primary schools an overview
11.descriptive evaluation of the primary schools an overview
Alexander Decker
 
Descriptive evaluation of the primary schools an overview
Descriptive evaluation of the primary schools an overviewDescriptive evaluation of the primary schools an overview
Descriptive evaluation of the primary schools an overview
Alexander Decker
 
Adjustment for guessing
Adjustment for guessingAdjustment for guessing
Adjustment for guessing
cik noorlyda
 
Aed 6335 value added presentation
Aed 6335 value added presentationAed 6335 value added presentation
Aed 6335 value added presentation
Malika Mims
 
Using assessment data
Using assessment dataUsing assessment data
Using assessment data
fcaristo
 

What's hot (18)

Steps and challenges in evaluation ppt
Steps and challenges in evaluation pptSteps and challenges in evaluation ppt
Steps and challenges in evaluation ppt
 
Life Science Students’ Expectations on the Importance and Impact of Education...
Life Science Students’ Expectations on the Importance and Impact of Education...Life Science Students’ Expectations on the Importance and Impact of Education...
Life Science Students’ Expectations on the Importance and Impact of Education...
 
Module 4b assessment
Module 4b assessmentModule 4b assessment
Module 4b assessment
 
Teaching to a_test_worth_teaching_to_reformat_
Teaching to a_test_worth_teaching_to_reformat_Teaching to a_test_worth_teaching_to_reformat_
Teaching to a_test_worth_teaching_to_reformat_
 
Final Year Research
Final Year ResearchFinal Year Research
Final Year Research
 
measure student learning
measure student learningmeasure student learning
measure student learning
 
measurement assessment and evaluation
measurement assessment and evaluationmeasurement assessment and evaluation
measurement assessment and evaluation
 
Basic Concepts of Teaching, Evaluation, Measurement, And Tests.
Basic Concepts of Teaching, Evaluation, Measurement, And Tests.Basic Concepts of Teaching, Evaluation, Measurement, And Tests.
Basic Concepts of Teaching, Evaluation, Measurement, And Tests.
 
Sedere Recent Trends in Assessment in Higher Education
Sedere Recent Trends in Assessment in Higher EducationSedere Recent Trends in Assessment in Higher Education
Sedere Recent Trends in Assessment in Higher Education
 
Extended GAPs Model to Assess the Quality of Education for Higher Educational...
Extended GAPs Model to Assess the Quality of Education for Higher Educational...Extended GAPs Model to Assess the Quality of Education for Higher Educational...
Extended GAPs Model to Assess the Quality of Education for Higher Educational...
 
11.descriptive evaluation of the primary schools an overview
11.descriptive evaluation of the primary schools an overview11.descriptive evaluation of the primary schools an overview
11.descriptive evaluation of the primary schools an overview
 
Descriptive evaluation of the primary schools an overview
Descriptive evaluation of the primary schools an overviewDescriptive evaluation of the primary schools an overview
Descriptive evaluation of the primary schools an overview
 
Adjustment for guessing
Adjustment for guessingAdjustment for guessing
Adjustment for guessing
 
PSE 2014 Results
PSE 2014 ResultsPSE 2014 Results
PSE 2014 Results
 
PARCC.Results
PARCC.ResultsPARCC.Results
PARCC.Results
 
Measurement and evaluation
Measurement and evaluationMeasurement and evaluation
Measurement and evaluation
 
Aed 6335 value added presentation
Aed 6335 value added presentationAed 6335 value added presentation
Aed 6335 value added presentation
 
Using assessment data
Using assessment dataUsing assessment data
Using assessment data
 

Viewers also liked

Viewers also liked (7)

DOC076.PDF
DOC076.PDFDOC076.PDF
DOC076.PDF
 
PZ-final-version-PratikZanetaPaulina
PZ-final-version-PratikZanetaPaulinaPZ-final-version-PratikZanetaPaulina
PZ-final-version-PratikZanetaPaulina
 
Proof of Enrollment
Proof of EnrollmentProof of Enrollment
Proof of Enrollment
 
ATMpresentation
ATMpresentationATMpresentation
ATMpresentation
 
ElenaPratikSalman DA
ElenaPratikSalman DAElenaPratikSalman DA
ElenaPratikSalman DA
 
Ratio Analysis
Ratio AnalysisRatio Analysis
Ratio Analysis
 
THE-MOST-FINAL-PROJECT-
THE-MOST-FINAL-PROJECT-THE-MOST-FINAL-PROJECT-
THE-MOST-FINAL-PROJECT-
 

Similar to Data-Analysis

Connecticut mesuring and modeling growth
Connecticut   mesuring and modeling growthConnecticut   mesuring and modeling growth
Connecticut mesuring and modeling growth
John Cronin
 
Connecticut mesuring and modeling growth
Connecticut   mesuring and modeling growthConnecticut   mesuring and modeling growth
Connecticut mesuring and modeling growth
John Cronin
 
Fuzzy Measurement of University Students Importance Indexes by Using Analytic...
Fuzzy Measurement of University Students Importance Indexes by Using Analytic...Fuzzy Measurement of University Students Importance Indexes by Using Analytic...
Fuzzy Measurement of University Students Importance Indexes by Using Analytic...
IRJESJOURNAL
 
Ed Reform Lecture - University of Arkansas
Ed Reform Lecture - University of ArkansasEd Reform Lecture - University of Arkansas
Ed Reform Lecture - University of Arkansas
John Cronin
 
Assessment Selection Paper-Herman_Heritage_Goldschmidt (2011)
Assessment Selection Paper-Herman_Heritage_Goldschmidt (2011)Assessment Selection Paper-Herman_Heritage_Goldschmidt (2011)
Assessment Selection Paper-Herman_Heritage_Goldschmidt (2011)
Research in Action, Inc.
 
2010 c-washington (future of assessments) - rev 1.1
2010 c-washington (future of assessments) - rev 1.12010 c-washington (future of assessments) - rev 1.1
2010 c-washington (future of assessments) - rev 1.1
OECD
 
What_does_quality_in_higher_education_mean_Perce.pdf
What_does_quality_in_higher_education_mean_Perce.pdfWhat_does_quality_in_higher_education_mean_Perce.pdf
What_does_quality_in_higher_education_mean_Perce.pdf
ThanhTonLm
 
Maximizing What Students Get Out Of College
Maximizing What Students Get Out Of CollegeMaximizing What Students Get Out Of College
Maximizing What Students Get Out Of College
Amanda Walker
 
Change Leadership In Education
Change Leadership In EducationChange Leadership In Education
Change Leadership In Education
Mark Luffman
 

Similar to Data-Analysis (20)

Connecticut mesuring and modeling growth
Connecticut   mesuring and modeling growthConnecticut   mesuring and modeling growth
Connecticut mesuring and modeling growth
 
Connecticut mesuring and modeling growth
Connecticut   mesuring and modeling growthConnecticut   mesuring and modeling growth
Connecticut mesuring and modeling growth
 
Connecticut mesuring and modeling growth
Connecticut   mesuring and modeling growthConnecticut   mesuring and modeling growth
Connecticut mesuring and modeling growth
 
Assessing Critical Thinking In Higher Education Current State And Directions...
Assessing Critical Thinking In Higher Education  Current State And Directions...Assessing Critical Thinking In Higher Education  Current State And Directions...
Assessing Critical Thinking In Higher Education Current State And Directions...
 
Fuzzy Measurement of University Students Importance Indexes by Using Analytic...
Fuzzy Measurement of University Students Importance Indexes by Using Analytic...Fuzzy Measurement of University Students Importance Indexes by Using Analytic...
Fuzzy Measurement of University Students Importance Indexes by Using Analytic...
 
Ed Reform Lecture - University of Arkansas
Ed Reform Lecture - University of ArkansasEd Reform Lecture - University of Arkansas
Ed Reform Lecture - University of Arkansas
 
Assessment Selection Paper-Herman_Heritage_Goldschmidt (2011)
Assessment Selection Paper-Herman_Heritage_Goldschmidt (2011)Assessment Selection Paper-Herman_Heritage_Goldschmidt (2011)
Assessment Selection Paper-Herman_Heritage_Goldschmidt (2011)
 
Measuring Graduate Attributes - Lit Review for Tracker
Measuring Graduate Attributes - Lit Review for TrackerMeasuring Graduate Attributes - Lit Review for Tracker
Measuring Graduate Attributes - Lit Review for Tracker
 
The Impact of Employee-Sponsored Leadership Development Programming on Colleg...
The Impact of Employee-Sponsored Leadership Development Programming on Colleg...The Impact of Employee-Sponsored Leadership Development Programming on Colleg...
The Impact of Employee-Sponsored Leadership Development Programming on Colleg...
 
2010 c-washington (future of assessments) - rev 1.1
2010 c-washington (future of assessments) - rev 1.12010 c-washington (future of assessments) - rev 1.1
2010 c-washington (future of assessments) - rev 1.1
 
Furtwengler PhD candidacy project proposal
Furtwengler PhD candidacy project proposalFurtwengler PhD candidacy project proposal
Furtwengler PhD candidacy project proposal
 
Evaluating higher education learning outcomes presentation to ces
Evaluating higher education learning outcomes presentation to cesEvaluating higher education learning outcomes presentation to ces
Evaluating higher education learning outcomes presentation to ces
 
What_does_quality_in_higher_education_mean_Perce.pdf
What_does_quality_in_higher_education_mean_Perce.pdfWhat_does_quality_in_higher_education_mean_Perce.pdf
What_does_quality_in_higher_education_mean_Perce.pdf
 
E assessment
E assessmentE assessment
E assessment
 
Zeine et al. Customer Service Focus and Mission Articulation in HEd., Oxford ...
Zeine et al. Customer Service Focus and Mission Articulation in HEd., Oxford ...Zeine et al. Customer Service Focus and Mission Articulation in HEd., Oxford ...
Zeine et al. Customer Service Focus and Mission Articulation in HEd., Oxford ...
 
Teal Modern and Minimalist Thesis Defense Presentation (2).pptx
Teal Modern and Minimalist Thesis Defense Presentation (2).pptxTeal Modern and Minimalist Thesis Defense Presentation (2).pptx
Teal Modern and Minimalist Thesis Defense Presentation (2).pptx
 
The Impact of Employment Progression on Students Towards Higher Education
The Impact of Employment Progression on Students Towards Higher EducationThe Impact of Employment Progression on Students Towards Higher Education
The Impact of Employment Progression on Students Towards Higher Education
 
Maximizing What Students Get Out Of College
Maximizing What Students Get Out Of CollegeMaximizing What Students Get Out Of College
Maximizing What Students Get Out Of College
 
Change Leadership In Education
Change Leadership In EducationChange Leadership In Education
Change Leadership In Education
 
EMPLOYABILITY OF BA-ECONOMICS GRADUATES: A TRACER STUDY
EMPLOYABILITY OF BA-ECONOMICS GRADUATES: A TRACER STUDYEMPLOYABILITY OF BA-ECONOMICS GRADUATES: A TRACER STUDY
EMPLOYABILITY OF BA-ECONOMICS GRADUATES: A TRACER STUDY
 

Data-Analysis

  • 1. The sentiments of Corporate Character Scale among students from different universities towards to Master program Project submitted for assessment of the Curricular Unit: Data Analysis of the Master Program in Management Elena Trubacheva (Kuban State Agrarian University, Krasnodar, Russia) Pratik Iyengar (Instituto Polytechnico De Braganca, Braganca, Portugal) Salman Khan Raza (Instituto Polytechnico De Braganca, Braganca, Portugal) 2016/2017
  • 2. CONTENT • Introduction • Literature review • Research methodology • Analysis and results • Conclusion
  • 3. INTRODUCTION Higher education has emerged as an indispensable experience in the life of an individual seeking knowledge and expertise in today’s world by the virtue of the versatility necessitated by the Corporate World from Students who choose a particular specialization whilst advancing from the Bachelor level to the Masters level of studies.
  • 4. In order to ensure a detailed understanding of the relationship between students and their choices of Master programs, it is imperative for Deans or Management Boards of Higher Education Institutions to be well aware of all possible sentiments of the Corporate Character Scale (CCS) and their significance among students across different Universities towards Master programs. OBJECTIVE
  • 5. 1. LITERATURE REVIEW Student's roles in the higher education system are the subject of many discussions in the higher education quality literature. Some authors argue that students are customers, as in other service industries, because they pay a significant amount for their education (Kanji & Tambi, 2009). Other researchers claim that students are products of the higher education system (Harris, 1992). Recent studies accept the definition of students-as-a-customers in higher education, pointing out that students share responsibility for the results they obtain in the education process (Eagle & Brennan, 2007; Elassy, 2013).
  • 6. 1. LITERATURE REVIEW Allen Brown (1997) thinks that over the past few years the number of universities the world over has increased as a result of polytechnics and some colleges of higher education being reclassified as universities. Consequently there are now considerably more opportunities in all aspects of higher education, including education to Master’s degree level. There is every indication that this expansion will continue for foreseeable future. In order to ensure a detailed understanding of the relationship between students and their choices of Master programs, it is imperative for Deans or Management Boards of Higher Education Institutions to be well aware of all possible sentiments of the Corporate Character Scale (CCS) and their significance among students across different Universities towards Master programs.
  • 7. 2. RESEARCH METHODOLOGY In our study we used empirical data were collected from random 100 students from a total of 139 students that enrolled in two academic years of four different universities. To collect the data a survey was conducted applying a questionnaire in the classroom, between September 2016 and January 2017.
  • 8. 2.1. STUDY OBJECTIVE AND RESEARCH HYPOTHESIS Table 1: Hypothesis tested № Research Hypothesis H1 Students have a positive Corporate Character H2 There are differences in opinions of students from different specializations about Corporate Character H3 There are differences between opinions of males and females about Corporate Character H4 There are differences between opinions of people of different age groups about Corporate Character H5 There is inequality in the impact of Corporate Character among people from different marital status H6 There is inequality in the impact of Corporate Character among people from different universities H7 There is variability in influence of Corporate Character between students from first curricular year and second curricular year
  • 9. The instruments used in this study were structured in two parts. The first part focused on students profile (gender, age, marital status and etc.); and the second part include a group of 49 questions that will measure Corporate Character Scale to Assess Master Program according to significance of students’ sentiments and the five point Likert scale from 1 ‘Strongly disagree’ to 5 ‘Strongly agree’ was used to measure each item. 2.2. DATA COLLECTION AND DATA ANALYSIS
  • 10. Dimension Facet Item Agreeableness Warmth Friendly, pleasant, open, straightforward Empathy Concerned, reassuring, supportive, agreeable Integrity Honest, sincere, trustworthy, socially responsible Enterprise Modernity Cool, trendy, young Adventure Imaginative, up-to-date, exciting, innovative Boldness Extrovert, daring Competence Conscientiousness Reliable, secure, hardworking Drive Ambitious, achievement oriented, leading Technocracy Technical, corporate Chic Elegance Charming, stylish, elegant Prestige Prestigious, exclusive, refined Snobbery Snobby, elitist Ruthlessness Egotism Arrogant, aggressive, selfish Dominance Inward-looking, authoritarian, controlling Informality None Casual, simple, easy-going Machismo None Masculine, tough, rugged Table 2: The Corporate Character Scale: Dimensions, Facets and Items
  • 11. 3. ANALYSIS AND RESULTS Data were collected from  Polytechnic Institute of Braganca  Polytechnic Institute of Cavado and Ave Polytechnic Institute of Porto Polytechnic Institute of Viana do Castelo
  • 14. 3.2. DESCRIPTIVE ANALYSIS № Facets Mean Std. Deviation If Master Program came to life as a person, it would have the following facets of personality: 1 Warmth 3,62 ,561 2 Empathy 3,60 ,662 3 Integraty 3,63 ,722 4 Modernity 3,43 ,675 5 Adventure 3,43 ,711 6 Boldness 3,10 ,670 7 Conscientiousness 3,69 ,774 8 Drive 3,50 ,703 9 Technocracy 3,68 ,802 10 Elegance 3,25 ,698 11 Prestige 3,29 ,584 12 Dominance 3,73 4,489 13 Egotism 6,07 8,667 14 Snobbery 4,69 8,224 Overall Corporate Character Scale 3,60 ,996 Table 4: Descriptive Analysis that Measure the Corporate Character Scale
  • 15. № Variables Test p-value Results H1 Corporate Character t-Student p≤0,05 Not Validated H2 Corporate Character & Master program Mann-Whitney U for two independent samples p≥0,05 Validated H3 Corporate Character & Gender Mann-Whitney U for two independent samples p≥0,05 Validated H4 Corporate Character & Age Kruskal Wallis Test p≥0,05 Validated H5 Corporate Character & Marital Status Kruskal Wallis Test p≥0,05 Validated H6 Corporate Character & Higher education Kruskal Wallis Test p≤0,05 Not Validated H7 Corporate Character & Curricular year Mann-Whitney U for two independent samples p≥0,05 Validated Note: 5% Level of significance assumed (a=0.05). 3.3. Inferential Analysis Table 5: Validation of hypothesis
  • 16. № Dimensions Correlation coefficient If Master Program came to life as a person, it would have the following dimensions of personality: 1 Agreeableness ,763 2 Enterprise ,685 3 Competence ,710 4 Chic ,777 5 Ruthlessness ,394 6 Informality ,422 7 Machismo 0,116 3.3. Inferential Analysis Table 6: Spearman correlation coefficient (n=100)
  • 18. CONCLUSION It was discovered that the Corporate Character of our respondents is dominated by positive dimensions of agreeableness and chic, however chic has snobbery as the only negative facet associated with it and almost dimensions have a positive and strong relationship with Corporate Character of Master Program. In this end it is possible to say with a statistical significance that there is a positive relationship between dimensions and Corporate Character of Master Program.
  • 19. References • Alves, H., & Raposo, M. (2007). Conceptual Model of Student Satisfaction in Higher Education. Total Quality Management & Business Excellence, 18(5): 571-588. • Allen Brown (1997). Gaining the Master’s degree: How do invest in your own future. Student handbooks, 15-16. • Asif, M., & Searcy; C. (2014). Determining the Key Capabilities Required for Performance • Excellence in Higher Education. Total Quality Management & Business Excellence, 25(1-2): 22-35. • Clinton Conrad, Jenifer Grant Haworth ,Susan Bolyard Millar (1993). A Silent Success: Master’s Education in the United States. The Johns Hopkins University Press, 24-25. • Churchill, G.A., Jr. (1979) ‘A paradigm for developing better measures of marketing constructs’, Journal of Marketing Research, 64–73. • Dave Ellis (2014). Becoming a Master Student . 15th Edition. Cengage learning, 265-267. Duque, L.C. (2013). A framework for analyzing higher education performance: Students’ satisfaction, perceived learning outcomes, and dropout intention. Total Quality Management and Business Excellence, 25(1–2), 1–21.
  • 20. References • Eagle, L., & Brennan, R. (2007). Are students customers? TQM and marketing perspectives. Quality Assurance in Education, 15(1), 44–60. • Elassy, N. (2013). A model of student involvement in the quality assurance system at institutional level. Quality Assurance in Education, 21(2), 162–198. • Kanji, G.K., & Tambi, A.M.A. (1999). Total quality management in UK higher education institutions. Total Quality Management, 10(1), 129–153. • Owlia, M.S., & Aspinwall, E.M. (1996). Quality in higher education – a survey. Total Quality Management, 7(2), 161–171. • Quinn, A., Lemay, G., Larsen, P., & Johnson, D.M. (2009). Service quality in higher education. Total Quality Management, 20(2), 139–152. • Sahney, S., Banwet, D.K., & Karunes, S. (2004). Conceptualizing total quality management in higher education. The TQM Magazine, 16(2), 145–159. • Spector, P.E. (1992) ‘Summation Rating Scale Construction: An Introduction’, Sage Publications, Newbury Park, CA.
  • 21. Elena Trubacheva (Kuban State Agrarian University, Krasnodar, Russia) Pratik Iyengar (Instituto Polytechnico De Braganca, Braganca, Portugal) Salman Khan Raza (Instituto Polytechnico De Braganca, Braganca, Portugal) 2016/2017