Download to read offline


![• Make
• NIKON CORPORATION
• Model
• NIKON D90
• Orientation
• 0
• X Resolution
• 72 dots per inch
• Y Resolution
• 72 dots per inch
• Resolution Unit
• Inch
• Software
• Picasa 3.0
• Date/Time
• 2010:05:25 22:53:43
• YCbCr Positioning
• Center of pixel array
• Reference Black/White
• [0,0,0] [255,255,255]
• Exposure Time
• 1/400 sec
• F-Number
• F9
• Exposure Program
• Aperture priority
• ISO Speed Ratings
• 400
• Exif Version
• 2.20
• Date/Time Original
• 2010:05:01 17:43:53
• Date/Time Digitized
• 2010:05:01 17:43:53
• Components Configuration
• YCbCr
• Exposure Bias Value
• 0 EV
• Max Aperture Value
• F5.1
• Metering Mode
• Multi-segment
• Light Source
• Unknown
• Flash
• Flash did not fire
• Focal Length
• 80.0 mm
• User Comment
• Sub-Sec Time
• 00
• Sub-Sec Time Original
• 00
• Sub-Sec Time Digitized
• 00
• FlashPix Version
• 1.00
• Color Space
• Undefined
• Exif Image Width
• 4288 pixels
• Exif Image Height
• 2848 pixels
• Sensing Method
• One-chip color area sensor
• File Source
• Digital Still Camera (DSC)
• Scene Type
• Directly photographed image
• CFA Pattern
• 0 2 0 2 1 2 0 1
• Custom Rendered
• Normal process
• Exposure Mode
• Auto exposure
• White Balance
• Auto white balance
• Digital Zoom Ratio
• 1
• Focal Length 35
• 120mm
• Scene Capture Type
• Standard
• Gain Control
• Low gain up
• Contrast
• None
• Saturation
• None
• Sharpness
• None
• Subject Distance Range
• Unknown
• Compression
• JPEG (old-style)
• Thumbnail Offset
• 10912 bytes
• Thumbnail Length
• 6090 bytes
• Thumbnail Data
• [6090 bytes of thumbnail data]
• Firmware Version
• 2.10
• ISO
• ISO 400
• Quality & File Format
• RAW
• White Balance
• AUTO
• AF Type
• AF-A
• White Balance Fine
• 0 0
• White Balance RB Coefficients
• 178515625/100000000 139453125/100000000 1/1 1/1
• Unknown 01
• 0 1 6 0
• Unknown 02
• 0 1 12 0
• Unknown 03
• 9694
• ISO
• 0 400
• Unknown 24
• 0
• Unknown 04
• 14
• Lens
• 18-200mm f/3.5-5.6
• Unknown 05
• 0
• Unknown 07
• 0
• Unknown 20
• 2
• Unknown 08
• 64 1 12 0
• Unknown 09
• 73 48 0 0 0 0 0 0 0 0 0 0 0 0 0 0 0 0 0 0 0 0 0 0 0 0 0 0 0 0 0 0 0 0 0 0 0 0 0 0 0 0 0 0 0 0 0 0 0 0 0 0 0 0 0 0 0 0 0 0 0 0 0 0 0 0 0 0 0 0 0 0 0 0 0 0 0 0 0 0 0 0 0 0 0 0 0 0 0 0 0 0 0 0 0 0 0 0 0 0 0 0 0 0 0 0 0 0 0 0 0 0 0 0 0 0 0 0 0 0 0 0 0 0 0 0 0 0 0 0 0 0 0 0 0 0 0 0 0 0 0 0 0 0 0 0 0 0 0 0 0 0 0 0 0 0 0 0 0 0 0 0 0 0 0 0 0 0 0 0 0 0 0 0 0 0 0 0 0 0 0 0 0 0 0 0 0 0 0 0 0 0 0 0 0 0 0 0 0 0 0 0 0 0 0 0 0 0 0 0 0 0 0 0 0 0 0 0 0 0 0 0 0 0 0 0 0 0 0 0 0 0 0 0 0 0 0 0 0 0 0 0 0 0 0 0 0 0 0 0 0 0 0 0 0 0 0 0 0 0 0 0 0 0 0 0 0 0 0 0 0 0 0 0 0 0 0 0 0 0 0 0 0 0 0 0 0 0 0 0 0 0 0 0 0 0 0 0 0 0 0 0 0 0 0 0 0 0 0 0 0 0 0 0 0 0 0 0 0 0 0 0 0 0 0 0 0 0 0 0 0 0 0 0 0 0 0 0 0 0 0 0 0 0 0 0 0 0 0 0 0 0 0 0 0 0 0 0 0 0 0 0 0 0 0 0 0 0 0 0 0 0 0 0 0 0 0 0 0 0 0 0 0
0 0 0 0 0 0 0 0 0 0 0 0 0 0 0 0 0 0 0 0 0 0 0 0 0 0 0 0 0 0 0 0 0 0 0 0 0 0 0 0 0 0 0 0 0 0 0 0 0 0 0 0 0 0 0 0 0 0 0 0 0 0 0 0 0 0 0 0 0 0 0 0 0 0 0 0 0 0 0 0 0 0 0 0 0 0 0 0 0 0 0 0 0 0 0 0 0 0 0 0 0 0 0 0 0 0 0 0 0 0 0 0 0 0 0 0 0 0 0 0 0 0 0 0 0 0 0 0 0 0 0 0 0 0 0 0 0 0 0 0 0 0 0 0 0 0 0 0 0 0 0 0 0 0 0 0 0 0 0 0 0 0 0 0 0 0 0 0 0 0 0 0 0 0 0 0 0 0 0 0 0 0 0 0 0 0 0 0 0 0 0 0 0 0 0
• Unknown 11
• 48 50 49 51 -91 85 -103 46 -77 -35 23 -93 -11 -85 17 -62 -74 -21 115 58 76 -86 65 34 82 -61 127 -126 4 -101 -46 -75 83 -39 -76 123 -5 -81 -39 46 -55 -120 -41 72 2 -55 69 -46 -96 -73 -93 -104 -68 -13 113 16 118 -63 46 -17 34 103 92 45 -98 -63 -5 119 116 27 9 62 -70 125 -121 -39 112 77 117 -112 -106 -111 -45 92 44 67 -95 13 50 101 -33 -96 -88 -9 -115 106 -91 64 -93 78 -28 107 57 78 -86 77 55 104 -32 -98 -91 74 -122 97 -125 -20 -100 -109 -47 86 34 53 -113 48 24 71 -67 122 62 -119 113 30 85 -70 104 95 -80 28 -51 -7 81 -18 -44 3 126 -40 39 124 13 99 6 -17 -17 94 63 -37 -119 23 -18 -33 110 -104 11 -58 -59 11 102 110 -118 -83 105 12 -64 -76 31 -46 -103 1 -29 76 124 50 49 -70 2 43 -18 65 -8 -25 29 -102 94 105 -69 84 52 91
-55 126 122 -67 71 24 48 -113 53 34 -102 29 -109 -100 -20 -125 97 -122 -14 -91 -97 -32 104 55 77 -86 78 57 107 -28 -92 -85 -39 -114 -107 -37 -9 51 -65 -33 69 114 74 40 -67 -20 92 19 -114 -106 -62 53 79 -89 -40 81 125 33 62 -87 27 91 20 -34 41 -101 90 78 -89 57 16 47 -107 66 54 112 -13 -72 0 -17 -46 -55 -38 -4 -1 0 72 -49 -83 -53 47 -105 -53 4 -124 127 88 115 -75 -13 87 -56 76 -77 58 -83 -37 -63 92 -77 -61 23 -15 -74 -63 48 -81 -112 -71 -6 -35 -38 31 -21 123 -108 -12 94 -119 -66 59 -63 7 88 -16 -34 -11 98 22 117 83 34 -83 -46 33 10 -77 56 95 36 40 119 13 38 -62 -75 -25 -24 -88 39 117 2 -26 1 123 36 -84 -45 -23 -66 -54 45 -49 -96 -48 -33 -99 26 110 121 -61 124 84 11 -15 54 50 -123 23 120 24 -9 37 18 -42 81 -85 -76 28 -93 -103 78 58 125 127 48 64 -81 77 42 94 73 -70 67 10 18 110 8 -21
26 -119 68 68 -117 25 -18 12 27 23 8 67 -102 122 109 25 -27 99 -116 -6 -59 -79 -10 -127 112 -112 47 -121 3 -99 26 -40 -97 59 -44 -73 -2 -74 1 5 89 -44 -9 -72 -73 -90 -51 -34 -23 0 115 100 -69 -14 105 122 -100 12 15 -32 14 -34 69 -58 0 -8 11 44 -110 106 97 -30 -76 100 71 40 -26 -27 -78 -58 33 -48 -61 -44 -14 2 121 106 84 -36 -97 80 -90 -18 85 -74 40 100 11 106 -71 86 -31 36 31 -40 71 110 109 -22 61 72 51 115 60 76 -118 65 38 82 -20 127 -128 -56 126 45 74 -82 112 75 -124 0 -86 -39 46 -50 -52 -41 72 4 -98 69 -46 -94 -96 34 -42 -67 -23 112 44 67 -113 47 16 56 -89 93 -81 -98 -36 -5 -31 116 -18 8 41 -69 106 -122 -49 113 88 116 12 -105 127 -46 -78 45 -83 -95 70 50 101 -33 -96 -88 -9 -115 106 -114 -7 -85 -92 -28 107 57 78 -86 77 55 104 -32 -97 -91 -14 -122 97 -125 -20 -100 -109 -47 86 34 53 -
113 48 24 71 -67 122 126 -55 91 52 84 -69 105 94 -102 29 -25 -8 80 -17 -43 2 118 49 51 124 12 -29 1 102 18 5 63 -64 -120 -105 -19 -118 110 -103 11 -60 -60 11 -103 110 -118 -19 -105 -120 -32 63 49 90 -124 39 -33 16 124 103 49 118 -32 -43 -17 96 -8 -25 19 -50 109 79 -88 59 60 -30 -55 126 -119 -68 125 44 48 -113 53 34 112 -47 -109 -100 -20 -125 97 -124 -37 -67 -97 -32 3 87 -54 -94 78 57 107 -63 41 -92 -60 -117 -80 -19 51 -86 -94 -45 117 51 -71 95 126 -24 40 -45 -111 80 44 -118 -79 53 -13 -83 125 -70 66 50 -101 -78 -21 -124 -42 -31 -91 -93 -15 -57 -18 18 -22 -67 -55 14 12 67 -98 16 62 -39 45 58 0 127 -114 -98 105 -88 46 -39 -53 4 -123 74 -90 81 -75 -46 85 -92 127 -128 58 73 38 72 35 -116 56 115 14 73 115 69 77 -111 -67 39 -35 -38 30 -87 123 -124 -11 -97 -35 -84 6 -67 -121 91 -16 -49 -
11 98 22 5 64 84 -116 67 93 -46 -117 98 95 -88 67 23 -122 -86 35 -7 7 24 -103 -46 -83 -89 50 -86 -73 -24 96 28 38 117 6 -32 3 44 28 19 21 74 -20 -71 15 -80 -72 -57 61 -7 -2 73 -5 -76 -36 59 -23 -50 -104 -103 35 120 -48 86 -59 -126 -10 -79 -77 -43 -123 106 -63 -25 -110 -121 -65 80 8 23 109 10 -18 27 -117 68 71 -117 25 -18 10 109 23 8 64 63 -123 -110 -26 -127 99 -116 -3 -77 -77 -10 5 -8 -25 -69 24 103 -97 24 65 77 -92 112 20 115 -18 93 92 -102 99 57 42 -112 23 53 77 -51 -117 -124 98 111 -123 100 22 71 56 47 96 63 69 -94 106 89 -52 20 -69 18 100 -20 -21 15 119 40 32 95 -27 78 -63 33 -61 -89 92 83 120 22 16 -88 -59 -11 90 2 -1 63 65 -113 -101 -108 62 20 -85 37 -41 -35 39 -72 -112 -81 21 -62 -74 -15 115 60 76 -93 65 38 82 -59 127 -128 -56 87 45 74 -82 89 75 -124 21 -99 -39 46 -56 -117 -
42 -60 1 40 69 -26 89 44 -36 11 67 38 113 51 66 -107 -48 -49 -57 92 93 82 97 -5 4 -17 -127 17 24 -12 -68 16 -127 92 118 13 114 -112 -112 -23 -43 110 43 117 -89 -86 52 32 -39 70 -81 -67 -118 61 -122 -105 -84 65 -29 102 62 40 -94 126 63 -3 -24 25 -83 -125 -127 -100 -117 -50 -108 -28 -39 -35 -35 37 112 45 -25 103 66 103 -128 45 -91 -21 -85 -3 -106 108 101 88 24 -85 -81 -46 42 44 -119 10 -52 77 -13 -36 -2 37 -19 50 -64 -6 119 -38 18 -49 -111 -41 -12 -122 59 52 102 82 117 110 104 20 63 -4 -6 100 -103 -57 28 -85 -125 -11 -50 -93 -3 25 16 -11 7 55 -30 113 -95 -70 68 -72 -53 -31 54 -45 -123 116 -72 -57 -49 86 -54 -57 -87 50 108 71 19 103 -98 110 -103 -91 -97 -32 104 55 77 -86 78 57 107 -28 -92 -85 -7 -114 104 -85 -10 38 -95 8 101 6 -71 76 -68 -21 -93 6 -111 -109 -30 117 -80 -81 39 124 125 -
78 -63 -37 -28 -113 -31 -31 56 84 92 50 -95 -84 22 119 -110 57 48 3 -11 -120 -53 9 -57 122 -44 122 -7 -31 79 -19 -86 -122 38 -77 -52 -33 -125 76 94 -50 66 29 95 94 -120 -5 -51 57 33 -82 -85 80 52 6 -7 58 61 1 80 -120 71 1 34 -54 -32 126 -123 117 11 -33 118 -117 -59 -66 -8 16 15 -32 10 82 -23 45 -84 -19 83 -2 -34 -123 77 -33 -96 27 -41 60 -14 -84 -15 41 -44 97 -101 -85 70 -113 -43 -78 72 113 -97 -85 -38 4 -7 46 -4 -10 -29 -36 -82 0 93 119 -16 46 103 19 -62 31 1 -101 36 93 43 -122 22 115 -27 81 -104 -89 47 -74 -86 100 9 110 76 39 115 -122 126 15 -7 -123 -65 64 8 23 109 10 -18 25 -117 68 68 -117 25 -18 8 75 22 113 65 98 -123 -91 25 94 -100 34 3 124 -79 -15 -126 84 -112 5 -121 -109 -99 18 33 56 -60 44 65 -47 88 52 -4 80 -63 28 -74 77 -78 -48 -48 41 21 46 107 53 -25 -22 116 96 25 -122 -17
-3 -54 125 -58 -41 -20 -127 35 38 126 104 -30 62 127 -67 40 -39 -19 -61 -63 -36 -53 -114 -44 36 25 -99 -99 -27 48 -19 -89 39 2 39 64 109 101 43 107 61 86 44 37 -104 -40 -21 111 -110 -22 -20 73 -54 -116 13 -77 -100 -66 101 -83 -14 -128 -70 55 26 -46 15 81 23 -76 -58 -5 -12 38 18 53 46 40 -44 -1 60 -70 -92 89 7 -36 107 67 53 -114 -29 -67 89 -48 -75 -57 119 -94 -79 97 -6 4 -8 -117 -95 -10 -109 69 -76 120 7 -113 -106 -118 7 105 114 44 -121 -45 -89 94 -82 89 101 -33 -96 -88 -9 -115 106 -114 -7 -85 -92 -28 107 57 78 -86 77 55 104 -32 -97 -58 -74 -122 97 -32 -15 -100 -109 -75 88 34 53 -113 49 5 90 66 -123 126 -55 75 -112 84 -69 69 -10 -102 29 -25 -8 80 -17 -43 2 118 49 51 124 12 -81 77 -77 18 42 -108 -107 -120 -105 -19 -118 110 -103 11 -60 -60 11 -103 110 -127 -31 -105 -120 -64 63 5 18 102 1
-29 2 125 49 60 117 6 -37 -22 81 -6 -22 30 -98 80 108 -69 84 52 91 -55 126 122 -67 71 24 48 -113 53 34 86 -47 -109 -100 -20 -125 97 -122 -14 -91 -97 -32 104 55 77 -86 78 57 107 -28 -92 -85 -7 -114 106 -115 -9 -88 -96 -33 101 50 70 -95 67 44 92 -45 -109 -30 -30 117 77 7 -40 -121 127 63 62 9 25 -14 20 -5 43 15 90 93 -91 -119 16 47 -105 -13 54 113 -112 -70 -52 35 -94 -81 -46 69 -100 23 72 -41 -50 -35 46 -39 -88 39 -124 75 58 -19 74 45 52 -117 -128 127 -59 82 38 65 -93 76 60 115 -15 -74 -62 21 -81 -112 -72 39 -35 -38 30 -87 123 -108 -12 -101 -119 -66 58 -3 7 88 -16 -49 -11 98 22 17 83 -36 -84 -61 33 -58 -78 -27 95 32 40 119 13 -22 14 121 43 36 100 -21 -71 -50 42 -51 -73 -24 96 31 37 114 6 -31 3 108 28 19 81 -42 -94 -75 15 -80 -104 -57 61 -6 -2 73 -37 -76 -44 59 -23 -34 26 -99 103 120 -48
111 85 -126 -10 -79 -77 -4 -116 99 -127 -26 -110 -123 -65 64 8 23 109 10 -18 25 -117 68 68 -117 25 -18 10 109 23 8 64 -65 -123 -110 -26 -127 99 -116 -4 -77 -79 -10 -126 85 111 -48 120 103 -99 26 -34 -23 59 -44 -76 -37 73 -2 -6 61 -57 -104 -80 15 -75 -94 -42 81 19 28 108 3 -31 6 114 37 31 96 -24 -73 -51 42 -50 -71 -21 100 36 43 121 14 -22 13 119 40 32 95 -27 -78 -58 33 -61 -84 -36 108 -18 48 98 -9 -12 72 88 7 -3 65 -66 -74 102 67 -108 124 78 -52 -38 -35 38 -63 -112 -81 21 -16 -74 -15 119 -71 76 -96 -109 -14 82 -59 127 79 -56 87 33 -88 -82 85 -21 -20 4 -53 -37 19 -54 -83 -41 122 0 -1 85 -63 -90 -63 35 -16 112 92 -67 -103 -67 106 -48 -17 -57 88 -94 -91 97 -42 4 -21 -117 -28 -10 -63 69 -126 120 39 -113 -80 -118 29 105 110 44 -93 -45 -68 94 -71 -51 -102 32 95 87 8 114 -107 113 6 84 91 27 -
108 57 78 85 -78 -56 -105 31 96 90 13 121 -98 124 19 99 108 46 -87 -35 -54 112 -49 -25 -72 66 -123 -127 54 -92 -53 -85 68 -106 -95 101 -30 24 7 -81 16 42 -3 -119 -50 -52 -125 -13 28 -2 -103 -19 -6 -64 63 119 104 18 117 -111 102 -12 59 59 -12 102 -111 117 18 104 119 63 -64 -6 -19 -103 -2 28 -13 -125 -52 -50 -119 -3 42 16 -81 7 24 -30 101 -95 -106 68 -85 -53 -92 54 -127 -123 66 -72 -25 -49 112 -54 -35 -87 46 108 99 19 124 -98 121 13 90 96 31 -105 -56 -78 85 -79 -58 -108 27 91 84 6 113 -107 114 8 87 95 32 -102 -51 -71 94 -68 -45 -93 44 110 105 29 -118 -80 -113 39 120 -126 69 -63 -10 -28 -117 -21 4 -42 97 -91 -94 88 -57 -17 -48 106 -67 -55 -114 12 67 51 -36 62 89 45 -70 0 -1 -73 40 82 53 -47 38 52 -5 123 -76 -90 81 -75 -46 -88 55 127 -128 58 -83 -39 -66 92 -77 -61 -116 14 73 61 -22 80
111 71 -40 34 37 -31 86 -124 107 11 100 118 65 -59 2 -8 -89 15 48 10 -99 -23 -18 -84 35 83 60 -34 57 77 26 -96 -33 -41 -120 -14 21 -15 -122 -44 -37 -101 20 70 49 -43 50 72 23 -97 -32 -38 -115 -7 30 -4 -109 -29 -20 -82 41 93 74 -32 79 103 56 -62 5 1 -74 36 75 43 -60 22 33 -27 98 -104 -121 47 -112 -86 125 9 78 76 3 115 -100 126 25 109 122 64 -65 -9 -24 -110 -11 17 -26 116 -69 -69 116 -26 17 -11 -110 -24 -9 -65 64 122 109 25 126 -100 115 3 76 78 9 125 -86 -112 47 -121 -104 98 -27 33 22 -60 43 75 36 -74 1 5 -62 56 103 79 -16 74 93 41 -82 -20 -29 -109 -4 30 -7 -115 -38 -32 -97 23 72 50 -43 49 70 20 -101 -37 -44 -122 -15 21 -14 -120 -41 -33 -96 26 77 57 -34 60 83 35 -84 -18 -23 -99 10 48 15 -89 -8 2 -59 65 118 100 11 107 -124 86 -31 37 34 -40 71 111 80 -22 61 73 14 -116 -61 -77 92 -66 -39
-83 58 -128 127 55 -88 -46 -75 81 -90 -76 123 -5 52 38 -47 53 82 40 -73 -1 0 -70 45 89 62 -36 51 67 12 -114 -55 -67 106 -48 -17 -57 88 -94 -91 97 -42 4 -21 -117 -28 -10 -63 69 -126 120 39 -113 -80 -118 29 105 110 44 -93 -45 -68 94 -71 -51 -102 32 95 87 8 114 -107 113 6 84 91 27 -108 -58 -79 85 -78 -56 -105 31 96 90 13 121 -98 124 19 99 108 46 -87 -35 -54 112 -49 -25 -72 66 -123 -127 54 -92 -53 -85 68 -106 -95 101 -30 24 7 -81 16 42 -3 -119 -50 -52 -125 -13 28 -2 -103 -19 -6 -64 63 119 104 18 117 -111 102 -12 59 59 -12 102 -111 117 18 104 119 63 -64 -6 -19 -103 -2 28 -13 -125 -52 -50 -119 -3 42 16 -81 7 24 -30 101 -95 -106 68 -85 -53 -92 54 -127 -123 66 -72 -25 -49 112 -54 -35 -87 46 108 99 19 124 -98 121 13 90 96 31 -105 -56 -78 85 -79 -58 -108 27 91 84 6 113 -107 114 8 87 95 32 -
102 -51 -71 94 -68 -45 -93 44 110 105 29 -118 -80 -113 39 120 -126 69 -63 -10 -28 -117 -21 4 -42 97 -91 -94 88 -57 -17 -48 106 -67 -55 -114 12 67 51 -36 62 89 45 -70 0 -1 -73 40 82 53 -47 38 52 -5 123 -76 -90 81 -75 -46 -88 55 127 -128 58 -83 -39 -66 92 -77 -61 -116 14 73 61 -22 80 111 71 -40 34 37 -31 86 -124 107 11 100 118 65 -59 2 -8 -89 15 48 10 -99 -23 -18 -84 35 83 60 -34 57 77 26 -96 -33 -41 -120 -14 21 -15 -122 -44 -37 -101 20 70 49 -43 50 72 23 -97 -32 -38 -115 -7 30 -4 -109 -29 -20 -82 41 93 74 -16 79 103 56 -62 5 1 -74 36 75 43 -60 22 33 -27 98 -104 -121 47 -112 -86 125 9 78 76 3 115 -100 126 25 109 122 64 -65 -9 -24 -110 -11 17 -26 116 -69 -69 116 -26 17 -11 -110 -24 -9 -65 64 122 109 25 126 -100 115 3 76 78 9 125 -86 -112 47 -121 -104 98 -27 33 22 -60 43 75 36 -74 1 5 -
62 56 103 79 -16 74 93 41 -82 -20 -29 -109 -4 30 -7 -115 -38 -32 -97 23 72 50 -43 49 70 20 -101 -37 -44 -122 -15 21 -14 -120 -41 -33 -96 26 77 57 -34 60 83 35 -84 -18 -23 -99 10 48 15 -89 -8 2 -59 65 118 100 11 107 -124 86 -31 37 34 -40 67 111 80 -22 61 73 14 -116 -61 -77 92 -66 -39 -83 58 -128 127 55 -88 -46 -75 81 -90 -76 123 -5 52 38 -47 53 82 40 -73 -1 0 -70 45 89 62 -36 51 67 12 -114 -55 -67 106 -48 -17 -57 88 -94 -91 97 -42 4 -21 -117 -28 -10 -63 69 -126 120 39 -113 -80 -118 29 105 110 44 -93 -45 -68 94 -71 -51 -102 32 95 87 8 114 -107 113 6 84 91 27 -108 -58 -79 85 -78 -56 -105 31 96 90 13 121 -98 124 19 99 108 46 -87 -35 -54 112 -49 -25 -72 66 -123 -127 54 -92 -53 -85 68 -106 -95 101 -30 24 7 -81 16 42 -3 -119 -50 -52 -125 -13 28 -2 -103 -19 -6 -64 63 119 104 18 117 -111 102 -
12 59 59 -12 102 -111 117 18 104 119 63 -64 -6 -19 -103 -2 28 -13 -125 -52 -50 -119 -3 42 16 -81 7 24 -30 101 -95 -106 68 -85 -53 -92 54 -127 -123 66 -72 -25 -49 112 -54 -35 -87 46 108 99 19 124 -98 121 13 90 96 31 -105 -56 -78 85 -79 -58 -108 27 91 84 6 113 -107 114 8 87 95 32 -102 -51 -71 94 -68 -45 -93 44 110 105 29 -118 -80 -113 39 120 -126 69 -63 -10 -28 -117 -21 4 -42 97 -91 -94 88 -57 -17 -48 106 -67 -55 -114 12 67 51 -36 62 89 45 -70 0 -1 -73 40 82 53 -47 38 52 -5 123 -76 -90 81 -75 -46 -88 55 127 -128 58 -83 -39 -66 92 -77 -61 -116 14 73 61 -22 80 111 71 -40 34 37 -31 86 -124 107 11 100 118 65 -59 2 -8 -89 15 48 10 -99 -23 -18 -84 35 83 60 -34 57 77 26 -96 -33 -41 -120 -14 21 -15 -122 -44 -37 -101 20 70 49 -43 50 72 23 -97 -32 -38 -115 -7 30 -4 -109 -29 -20 -82 41 93 74 -16
79 103 56 -62 5 1 -74 36 75 43 -60 22 33 -27 98 -104 -121 47 -112 -86 125 9 78 76 3 115 -100 126 25 109 122 64 -65 -9 -24 -110 -11 17 -26 116 -69 -69 116 -26 17 -11 -110 -24 -9 -65 64 122 109 25 126 -100 115 3 76 78 9 125 -86 -112 47 -121 -104 98 -27 33 22 -60 43 75 36 -74 1 5 -62 56 103 79 -16 74 93 41 -82 -20 -29 -109 -4 30 -7 -115 -38 -32 -97 23 72 50 -43 49 70 20 -101 -37 -44 -122 -15 21 -14 -120 -41 -33 -96 26 77 57 -34 60 83 35 -84 -18 -23 -99 10 48 15 -89 -8 2 -59 65 118 100 11 107 -124 86 -31 37 34 -40 71 111 80 -22 61 73 14 -116 -61 -77 92 -66 -39 -83 58 -128 127 55 -88 -46 -75 81 -90 -76 123 -5 52 38 -47 53 82 40 -73 -1 0 -70 45 89 62 -36 51 67 12 -114 -55 -67 106 -48 -17 -57 88 -94 -91 97 -42 4 -21 -117 -28 -10 -63 69 -126 120 39 -113 -80 -118 29 105 110 44 -93 -45 -68 94
-71 -51 -102 32 95 87 8 114 -107 113 6 84 91 27 -108 -58 -79 85 -78 -56 -105 31 96 90 13 121 -98 124 19 99 108 46 -87 -35 -54 112 -49 -25 -72 66 -123 -127 54 -92 -53 -69 68 -106 -95 101 -30 24 7 -81 16 42 -3 -119 -50 -52 -125 -13 28 -2 -103 -19 -6 -64 63 119 104 18 117 -111 102 -12 59 59 -12 102 -111 117 18 104 119 63 -64 -6 -19 -103 -2 28 -13 -125 -52 -50 -119 -3 42 16 -81 7 24 -30 101 -95 -106 68 -85 -53 -92 54 -127 -123 66 -72 -25 -49 112 -54 -35 -87 46 108 99 19 124 -98 121 13 90 96 31 -105 -56 -78 85 -79 -58 -108 27 91 84 6 113 -107 114 8 87 95 32 -102 -51 -71 94 -68 -45 -93 44 110 105 29 -118 -80 -113 39 120 -126 69 -63 -10 -28 -117 -21 4 -42 97 -91 -94 88 -57 -17 -48 106 -67 -55 -114 12 67 51 -36 62 89 45 -70 0 -1 -73 40 82 53 -47 38 52 -5 123 -76 -90 81 -75 -46 -88 55 127 -
128 58 -83 -39 -66 92 -77 -61 -116 14 73 61 -22 80 111 71 -40 34 37 -31 86 -124 107 11 100 118 65 -59 2 -8 -89 15 48 10 -99 -23 -18 -84 35 83 60 -34 57 77 26 -96 -33 -41 -120 -14 21 -15 -122 -44 -37 -101 20 70 49 -43 50 72 23 -97 -32 -38 -115 -7 30 -4 -109 -29 -20 -82 41 93 74 -16 79 103 56 -62 5 1 -74 36 75 43 -60 22 33 -27 98 -104 -121 47 -112 -86 125 9 78 76 3 115 -100 126 25 109 122 64 -65 -73 -24 -110 -11 17 -26 116 -69 -69 116 -26 17 -11 -110 -24 -9 -65 64 122 109 25 126 -100 115 3 76 78 9 125 -86 -112 47 -121 -104 98 -27 33 22 -60 43 75 36 -74 1 5 -62 56 103 79 -16 74 93 41 -82 -20 -29 -109 -4 30 -7 -115 -38 -32 -97 23 72 50 -43 49 70 20 -101 -37 -44 -122 -15 21 -14 -120 -41 -33 -96 26 77 57 -34 60 83 35 -84 -18 -23 -99 10 48 15 -89 -8 2 -59 65 118 100 11 107 -124 86 -31 37
34 -40 71 111 80 -22 61 73 14 -116 -61 -77 92 -66 -39 -83 58 -128 127 55 -88 -46 -75 81 -90 -76 123 -5 52 38 -47 53 82 40 -73 -1 0 -70 45 89 62 -36 51 67 12 -114 -55 -67 106 -48 -17 -57 88 -94 -91 97 -42 4 -21 -117 -28 -10 -63 69 -126 120 39 -113 -80 -118 29 105 110 44 -93 -45 -68 94 -71 -51 -102 32 95 87 8 114 -107 113 6 84 91 27 -108 -58 -79 85 -78 -56 -105 31 96 90 13 121 -98 124 19 99 108 46 -87 -35 -54 112 -49 -25 -72 66 -123 -127 54 -92 -53 -85 68 -106 -95 101 -30 24 7 -81 16 42 -3 -119 -50 -52 -125 -13 28 -2 -103 -19 -6 -64 63 119 104 18 117 -111 102 -12 59 59 -12 102 -111 117 18 104 119 63 -64 -6 -19 -103 -2 28 -13 -125 -52 -50 -119 -3 42 16 -81 7 24 -30 101 -95 -106 68 -85 -53 -92 54 -127 -123 66 -72 -25 -49 112 -54 -35 -87 46 108 99 19 124 -98 121 13 90 96 31 -105 -56 -78
85 -79 -58 -108 27 91 84 6 113 -107 114 8 87 95 32 -102 -51 -71 94 -68 -45 -93 44 110 105 29 -118 -80 -113 39 120 -126 69 -63 -10 -28 -117 -21 4 -42 97 -91 -94 88 -57 -17 -48 106 -67 -55 -114 12 67 51 -36 62 89 45 -70 0 -1 -73 40 82 53 -47 38 52 -5 123 -76 -90 81 -75 -46 -88 55 127 -128 58 -83 -39 -66 92 -77 -61 -116 14 73 61 -22 80 111 71 -40 34 37 -31 86 -124 107 11 100 118 65 -59 2 -8 -89 15 48 10 -99 -23 -18 -84 35 83 60 -34 57 77 26 -96 -33 -41 -120 -14 21 -15 -122 -44 -37 -101 20 70 49 -43 50 72 23 -97 -32 -38 -115 -7 30 -4 -109 -29 -20 -82 41 93 74 -16 79 103 56 -62 5 1 -74 36 75 43 -60 22 33 -27 98 -104 -121 47 -112 -86 125 9 78 76 3 115 -100 126 25 109 122 64 -65 -9 -24 -110 -11 17 -26 116 -69 -69 116 -26 17 -11 -110 -24 -9 -65 64 122 109 25 126 -100 115 3 76 78 9 125 -86 -
112 47 -121 -104 98 -27 33 22 -60 43 75 36 -74 1 5 -62 56 103 79 -16 74 93 41 -82 -20 -29 -109 -4 30 -7 -115 -38 -32 -97 23 72 50 -43 49 70 20 -101 -37 -44 -122 -15 21 -14 -120 -41 -33 -96 26 77 57 -34 60 83 35 -84 -18 -23 -99 10 48 15 -89 -8 2 -59 65 118 100 11 107 -124 86 -31 37 34 -40 71 111 80 -22 61 73 14 -116 -61 -77 92 -66 -39 -83 58 -128 127 55 -88 -46 -75 81 -90 -76 123 -5 52 38 -47 53 82 40 -73 -1 0 -70 45 89 62 -36 51 67 12 -114 -55 -67 106 -48 -17 -57 88 -94 -91 97 -42 4 -21 -117 -28 -10 -63 69 -126 120 39 -113 -80 -118 29 105 110 44 -93 -45 -68 94 -71 -51 -102 32 95 87 8 114 -107 113 6 84 91 27 -108 -58 -79 85 -78 -56 -105 31 96 90 13 121 -98 124 19 99 108 46 -87 -35 -54 112 -49 -25 -72 66 -123 -127 54 -92 -53 -85 68 -106 -95 101 -30 24 7 -81 16 42 -3 -119 -50 -52 -125 -
13 28 -2 -103 -19 -6 -64 63 119 104 18 117 -111 102 -12 59 59 -12 102 -111 117 18 104 119 63 -64 -6 -19 -103 -2 28 -13 -125 -52 -50 -119 -3 42 16 -81 7 24 -30 101 -95 -106 68 -85 -53 -92 54 -127 -123 66 -72 -25 -49 112 -54 -35 -87 46 108 99 19 124 -98 121 13 90 96 31 -105 -56 -78 85 -79 -58 -108 27 91 84 6 113 -107 114 8 87 95 32 -102 -51 -71 94 -68 -45 -93 44 110 105 29 -118 -80 -113 39 120 -126 69 -63 -10 -28 -117 -21 4 -42 97 -91 -94 88 -57 -17 -48 106 -67 -55 -114 12 67 51 -36 62 89 45 -70 0 -1 -73 40 82 53 -47 38 52 -5 123 -76 -90 81 -75 -46 -88 55 127 -128 58 -83 -39 -66 92 -77 -61 -116 14 73 61 -22 80 111 71 -40 34 37 -31 86 -124 107 11 100 118 65 -59 2 -8 -89 15 48 10 -99 -23 -18 -84 35 83 60 -34 57 77 26 -96 -33 -41 -120 -14 21 -15 -122 -44 -37 -101 20 70 49 -43 50 72 23 -
97 -32 -38 -115 -7 30 -4 -109 -29 -20 -82 41 93 74 -16 79 103 56 -62 5 1 -74 36 75 43 -60 22 33 -27 98 -104 -121 47 -112 -86 125 9 78 76 3 115 -100 126 25 109 122 64 -65 -9 -24 -110 -11 17 -26 116 -69 -69 116 -26 17 -11 -110 -24 -9 -65 64 122 109 25 126 -100 115 3 76 78 9 125 -86 -112 47 -121 -104 98 -27 33 22 -60 43 75 36 -74 1 5 -62 56 103 79 -16 74 93 41 -82 -20 -29 -109 -4 30 -7 -115 -38 -32 -97 23 72 50 -43 49 70 20 -101 -37 -44 -122 -15 21 -14 -120 -41 -33 -96 26 77 57 -34 60 83 35 -84 -18 -23 -99 10 48 15 -89 -8 2 -59 65 118 100 11 107 -124 86 -31 37 34 -40 71 111 80 -22 61 73 14 -116 -61 -77 92 -66 -39 -83 58 -128 127 55 -88 -46 -75 81 -90 -76 123 -5 52 38 -47 53 82 40 -73 -1 0 -70 45 89 62 -36 51 67 12 -114 -55 -67 106 -48 -17 -57 88 -94 -91 97 -42 4 -21 -117 -28 -10 -63 69 -
126 120 39 -113 -80 -118 29 105 110 44 -93 -45 -68 94 -71 -51 -102 32 95 87 8 114 -107 113 6 84 91 27 -108 -58 -79 85 -78 -56 -105 31 96 90 13 121 -98 124 19 99 108 46 -87 -35 -54 112 -49 -25 -72 66 -123 -127 54 -92 -53 -85 68 -106 -95 101 -30 24 7 -81 16 42 -3 -119 -50 -52 -125 -13 28 -2 -103 -19 -6 -64 63 119 104 18 117 -111 102 -12 59 59 -12 102 -111 117 18 104 119 63 -64 -6 -19 -103 -2 28 -13 -125 -52 -50 -119 -3 42 16 -81 7 24 -30 101 -95 -106 68 -85 -53 -92 54 -127 -123 66 -72 -25 -49 112 -54 -35 -87 46 108 99 19 124 -98 121 13 90 96 31 -105 -56 -78 85 -79 -58 -108 27 91 84 6 113 -107 114 8 87 95 32 -102 -51 -71 94 -68 -45 -93 44 110 105 29 -118 -80 -113 39 120 -126 69 -63 -10 -28 -117 -21 4 -42 97 -91 -94 88 -57 -17 -48 106 -67 -55 -114 12 67 51 -36 62 89 45 -70 0 -1 -73 40
82 53 -47 38 52 -5 123 -76 -90 81 -75 -46 -88 55 127 -128 58 -83 -39 -66 92 -77 -61 -116 14 73 61 -22 80 111 71 -40 34 37 -31 86 -124 107 11 100 118 65 -59 2 -8 -89 15 48 10 -99 -23 -18 -84 35 83 60 -34 57 77 26 -96 -33 -41 -120 -14 21 -15 -122 -44 -37 -101 20 70 49 -43 50 72 23 -97 -32 -38 -115 -7 30 -4 -109 -29 -20 -82 41 93 74 -16 79 103 56 -62 5 1 -74 36 75 43 -60 22 33 -27 98 -104 -121 47 -112 -86 125 9 78 76 3 115 -100 126 25 109 122 64 -65 -9 -24 -110 -11 17 -26 116 -69 -69 116 -26 17 -11 -110 -24 -9 -65 64 122 109 25 126 -100 115 3 76 78 9 125 -86 -112 47 -121 -104 98 -27 33 22 -60 43 75 36 -74 1 5 -62 56 103 79 -16 74 93 41 -82 -20 -29 -109 -4 30 -7 -115 -38 -32 -97 23 72 50 -43 49 70 20 -101 -37 -44 -122 -15 21 -14 -120 -41 -33 -96 26 77 57 -34 60 83 35 -84 -18 -23 -99 10
48 15 -89 -8 2 -59 65 118 100 11 107 -124 86 -31 37 34 -40 71 111 80 -22 61 73 14 -116 -61 -77 92 -66 -39 -83 58 -128 127 55 -88 -46 -75 81 -90 -76 123 -5 52 38 -47 53 82 40 -73 -1 0 -70 45 89 62 -36 51 67 12 -114 -55 -67 106 -48 -17 -57 88 -94 -91 97 -42 4 -21 -117 -28 -10 -63 69 -126 120 39 -113 -80 -118 29 105 110 44 -93 -45 -68 94 -71 -51 -102 32 95 87 8 114 -107 113 6 84 91 27 -108 -58 -79 85 -78 -56 -105 31 96 90 13 121 -98 124 19 99 108 46 -87 -35 -54 112 -49 -25 -72 66 -123 -127 54 -92 -53 -85 68 -106 -95 101 -30 24 7 -81 16 42 -3 -119 -50 -52 -125 -13 28 -2 -103 -19 -6 -64 63 119 104 18 117 -111 102 -12 59 59 -12 102 -111 117 18 104 119 63 -64 -6 -19 -103 -2 28 -13 -125 -52 -50 -119 -3 42 16 -81 7 24 -30 101 -95 -106 68 -85 -53 -92 54 -127 -123 66 -72 -25 -49 112 -54 -35 -87
46 108 99 19 124 -98 121 13 90 96 31 -105 -56 -78 85 -79 -58 -108 27 91 84 6 113 -107 114 8 87 95 32 -102 -51 -71 94 -68 -45 -93 44 110 105 29 -118 -80 -113 39 120 -126 69 -63 -10 -28 -117 -21 4 -42 97 -91 -94 88 -57 -17 -48 106 -67 -55 -114 12 67 51 -36 62 89 45 -70 0 -1 -73 40 82 53 -47 38 52 -5 123 -76 -90 81 -75 -46 -88 55 127 -128 58 -83 -39 -66 92 -77 -61 -116 14 73 61 -22 80 111 71 -40 34 37 -31 86 -124 107 11 100 118 65 -59 2 -8 -89 15 48 10 -99 -23 -18 -84 35 83 60 -34 57 77 26 -96 -33 -41 -120 -14 21 -15 -122 -44 -37 -101 20 70 49 -43 50 72 23 -97 -32 -38 -115 -7 30 -4 -109 -29 -20 -82 41 93 74 -16 79 103 56 -62 5 1 -74 36 75 43 -60 22 33 -27 98 -104 -121 47 -112 -86 125 9 78 76 3 115 -100 126 25 109 122 64 -65 -9 -24 -110 -11 17 -26 116 -69 -69 116 -26 17 -11 -110 -24 -9 -
65 64 122 109 25 126 -100 115 3 76 78 9 125 -86 -112 47 -121 -104 98 -27 33 22 -60 43 75 36 -74 1 5 -62 56 103 79 -15 74 93 41 -82 -20 -29 -109 -4 30 -7 -115 -38 -32 -97 23 72 50 -43 49 70 20 -101 -37 -44 -122 -15 21 -14 -120 -41 -33 -96 26 77 57 -34 60 83 35 -84 -18 -23 -99 10 48 15 -89 -8 2 -59 65 118 100 11 107 -124 86 -31 37 34 -40 71 111 80 -22 61 73 14 -116 -61 -77 92 -66 -39 -83 58 -128 127 55 -88 -46 -75 81 -90 -76 123 -5 52 38 -47 53 82 40 -73 -1 0 -70 45 89 62 -36 51 67 12 -114 -55 -67 106 -48 -17 -57 88 -94 -91 97 -42 4 -21 -117 -28 -10 -63 69 -126 120 39 -113 -80 -118 29 105 110 44 -93 -45 -68 94 -71 -51 -102 32 95 87 8 114 -107 113 6 84 91 27 -108 -58 -79 85 -78 -56 -105 31 96 90 13 121 -98 124 19 99 108 46 -87 -35 -54 112 -49 -25 -72 66 -123 -127 54 -92 -53 -85 68 -
106 -95 101 -30 24 7 -81 16 42 -3 -119 -50 -52 -125 -13 28 -2 -103 -19 -6 -64 63 119 104 18 117 -111 102 -12 59 59 -12 102 -111 117 18 104 119 63 -64 -6 -19 -103 -2 28 -13 -125 -52 -50 -119 -3 42 16 -81 7 24 -30 101 -95 -106 68 -85 -53 -92 54 -127 -123 66 -72 -25 -49 112 -54 -35 -87 46 108 115 19 124 -98 121 13 90 96 31 -105 -56 -78 85 -79 -58 -108 27 91 84 6 113 -107 114 8 87 95 32 -102 -51 -71 94 -68 -45 -93 44 110 105 29 -118 -80 -113 39 120 -126 69 -63 -10 -28 -117 -21 4 -42 97 -91 -94 88 -57 -17 -48 106 -67 -55 -114 12 67 51 -36 62 89 45 -70 0 -1 -73 40 82 53 -47 38 52 -5 123 -76 -90 81 -75 -46 -88 55 127 -128 58 -83 -39 -66 92 -77 -61 -116 14 73 61 -22 80 111 71 -40 34 37 -31 86 -124 107 11 100 118 65 -59 2 -8 -89 15 48 10 -99 -23 -18 -84 35 83 60 -34 57 77 26 -96 -33 -41 -120
-14 21 -15 -122 -44 -37 -101 20 70 49 -43 50 72 87 -97 -32 -38 -115 -7 30 -4 -109 -29 -20 -82 41 93 74 -16 79 103 56 -62 5 1 -74 36 75 43 -60 22 33 -27 98 -104 -121 47 -112 -86 125 9 78 76 3 115 -100 126 25 109 122 64 -65 -9 -24 -110 -11 17 -26 116 -69 -69 116 -26 17 -11 -110 -24 -9 -116 16 73 61 25 126 -100 115 3 76 78 9 125 -86 -112 47 -121 -104 98 -27 33 22 -60 43 75 36 -74 1
• Noise Reduction
• OFF
• Unknown 12
• 48 50 49 49 0 0 0 0 0 0 0 0 0 0 0 0 0 0 0 0 0 0 0 0 0 0 0 0 0 0 0 0 0 0 0 0 0 0 0 0 0 0 0 0 0 0 0 0 0 0 0 0 0 0 0 0 0 0 0 0 0 0 0 0 0 0 0 0 0 0 0 0 0 0 0 0 0 0 0 0 0 0 0 0 0 0 0 0 0 0 0 0 0 0 0 0 0 0 0 0 0 0 0 0 0 0 0 0 0 0 0 0 0 0 0 0 0 0 0 0 0 0 0 0 0 0 0 0 0 0 0 0 0 0 0 0 0 0 0 0 0 0 0 0 0 0 0 0 0 0 0 0 0 0 0 0 0 0 0 0 0 0 0 0 0 0 0 0 0 0 0 0 0 0 0 0 0 0 0 0 0 0 0 0 0 0 0 0 0 0 0 0 0 0 0 0 0 0 0 0 0 0 0 0 0 0 0 0 0 0 0 0 0 0 0 0 0 0 0 0 0 0 0 0 0 0 0 0 0 0 0 0 0 0 0 0 0 0 0 0 0 0 0 0 0 0 0 0 0 0 0 0 0 0 0 0 0 0 0 0 0 0 0 0 0 0 0 0 0 0 0 0 0 0 0 0 0 0 0 0 0 0 0 0 85 55 -119 30 -54 29 44 -104 -112 -81 21 -62 -74 -15 115 60 77 -93 64 -17 83 -96 126 -128 -56 87 45 75 -66 -109 64 -96 20 -40 -39 18 -54 -67 40 -73 2 -3 71 -48 -92 -63 35 -56 -68 -41 113
-36 82 -107 43 46 40 -19 93 86 -114 45 -1 5 100 22 9 51 -86 15 -125 -67 116 17 101 -100 -106 -79 -45 116 47 -81 -79 82 50 81 -49 -4 -84 -33 -119 -94 -121 -99 -86 112 -9 -5 46 -18 -95 125 60 -72 -7 63 -73 -62 -119 -98 -121 -20 -100 -109 -47 86 34 53 -117 48 24 71 -67 122 126 -55 95 52 85 -86 104 94 -102 123 -25 120 80 111 -43 6 118 50 115 83 12 -29 0 103 83 70 121 -126 -120 -107 -19 -94 110 -101 11 -54 -60 95 -99 110 -118 -19 -105 -120 -64 63 1 18 102 1 -29 12 124 51 53 118 2 -43 111 -48 120 103 29 108 94 -123 -69 -72 52 -73 -55 -110 123 -67 70 24 49 -113 52 34 87 -59 -110 -105 -19 -120 96 -122 -14 81 -97 12 104 -37 76 -86 79 57 106 -28 -91 -85 -7 116 106 115 -9 86 -96 33 100 50 71 -95 67 -64 92 63 -111 96 -30 -125 78 112 -39 -121 125 -70 62 9 27 116 20 -5 41 -98 90 93 -89 56
16 47 -107 66 54 113 -13 -68 -52 35 -61 -93 -46 69 -1 0 72 -41 -83 -54 46 -39 -53 4 -124 75 89 -82 74 45 87 -56 -128 127 -59 82 38 65 -93 76 60 115 -15 -74 -62 21 -81 -102 -72 45 -35 -48 30 -67 123 -128 -12 -113 -119 -86 58 -3 7 88 -16 -49 -11 98 22 5 83 -56 -84 -55 33 -52 -78 -27 95 32 40 119 13 -22 14 121 43 46 100 -31 -71 -50 42 -51 -73 -24 96 31 37 114 6 -31 3 108 28 19 81 -42 -94 -75 15 -80 -104 -57 60 -6 -1 73 -38 -76 -43 59 -24 -34 27 -99 102 108 -47 123 84 -126 -9 -79 -77 10 -116 -107 -127 27 -109 -123 -66 64 9 23 108 0 -17 25 -118 68 69 -117 25 18 10 -101 23 -28 65 -65 -124 -110 -25 -127 98 -116 -3 -77 -80 -10 -125 85 110 -48 121 103 -99 26 -34 -23 59 -44 -76 -37 73 -2 -6 61 -57 -104 -80 15 -75 -94 -42 81 19 28 108 3 -31 6 114 37 31 96 -24 -73 -51 42 -50 -71 -21 100 36 43 121
14 -22 13 119 40 32 95 -27 -78 -58 33 -61 -84 -36 83 17 22 98 -11 -49 -16 88 7 -3 58 -66 -119 -101 -12 -108 123 -87 30 -38 -35 39 -72 -112 -81 21 -62 -74 -15 115 60 76 -93 65 38 82 -59 127 -128 -56 87 45 74 -82 89 75 -124 4 -53 -39 46 -54 -83 -41 72 0 -1 69 -46 -90 -63 35 -52 -68 -13 113 54 66 -107 47 16 56 -89 92 90 -97 41 -6 20 117 27 8 62 -69 125 -122 -40 113 79 116 -30 -105 -111 -46 92 45 67 -96 70 51 101 -34 -96 -87 -9 -116 106 -113 -7 -86 -92 -27 107 56 78 -85 77 54 104 -31 -97 -92 -14 -121 97 -126 -20 -99 -109 -48 86 35 53 -114 48 25 71 -68 122 127 -55 90 52 85 -69 104 94 -101 29 -26 -8 81 -17 -44 2 119 49 50 124 13 -29 0 102 19 5 62 -64 -119 -105 -20 -118 111 -103 10 -60 -59 11 -104 110 -117 -19 -106 -120 -63 63 4 18 103 1 -30 12 125 51 48 118 3 -43 -18 80 -7 -25 18 101 81 -
106 -76 -85 59 -92 -58 -127 117 66 72 -25 63 112 58 -35 89 46 -100 99 -29 124 110 121 -3 90 -112 31 103 -56 66 85 65 -58 100 27 -85 84 -10 113 101 114 -8 87 -81 32 106 -51 73 94 76 -45 83 44 -98 105 -19 -118 64 -113 -41 120 114 69 49 -10 20 -117 27 4 38 97 85 -94 -88 -57 31 -48 -102 -67 57 -114 -4 67 -61 -36 -50 89 -35 -70 -16 -1 71 40 -94 53 33 38 -60 -5 -124 75 89 -82 74 45 87 -56 -128 127 -59 82 38 65 -93 76 60 115 -15 -74 -62 21 -81 -112 -72 39 -35 -38 30 -87 123 -108 -12 -101 -119 -66 58 -3 7 88 -16 -49 -11 98 22 17 83 -36 -84 -61 33 -58 -77 -28 30 99 110 53 15 -84 12 63 41 98 100 -23 -71 -26 42 -50 -73 -24 96 104 37 38 7 40 2 9 24 23 66 -42 -93 -75 14 121 -103 -94 60 -6 -2 72 -34 -73 -47 57 -24 -1 26 -99 104 125 -48 111 84 -111 -10 -79 -77 -4 -116 96 -122 -26 -110 -123 -65 64
8 23 94 62 -18 25 -117 68 70 -119 -26 17 -11 -110 -24 -9 -65 64 122 109 25 126 -100 115 3 76 78 9 125 -86 -112 47 -121 -104 98 -27 33 22 -60 43 75 36 -74 1 5 -62 56 103 79 -16 74 93 41 -82 -20 -29 -109 -4 30 -7 -115 -38 -32 -97 23 72 50 -43 49 70 20 -101 -37 -44 -122 -15 21 -14 -120 -41 -33 -96 26 77 57 -34 60 83 35 -84 -18 -23 98 10 48 15 -89 -8
• Unknown 13
• 48 50 48 52 -128 66 46 30 82 -99 76 -40 27 -17 56 66 -102 -51 -114 5 88 -54 89 65 82 -59 127 -125 -53 80 45 75 -82
• Unknown 14
• 2176 1434
• Unknown 26
• 3582651
• Unknown 27
• 0
• Exposure Sequence Number
• 553
• Unknown 30
• Unknown 16
• 9788
• Interoperability Index
• Recommended Exif Interoperability Rules (ExifR98)
• Interoperability Version
• .
• GPS Version ID
• 0 0 2 2
• GPS Latitude Ref
• N
• GPS Latitude
• 46"4'2.9489136
• GPS Longitude Ref
• E
• GPS Longitude
• 11"9'30.461657
• GPS Altitude Ref
• Sea level
• GPS Altitude
• 0 metres
• Data Precision
• 8 bits
• Image Height
• 2848 pixels
• Image Width
• 4288 pixels
• Number of Components
• 3
• Component 1
• Y component: Quantization table 0, Sampling factors 1 horiz/1 vert
• Component 2
• Cb component: Quantization table 1, Sampling factors 1 horiz/1 vert
• Component 3
• Cr component: Quantization table 1, Sampling factors 1 horiz/1 vert
Make: NIKON CORPORATION
Model: NIKON D90
Orientation: 0X
Resolution: 72 dots per inch
Y Resolution: 72 dots per inch
Resolution Unit: Inch
Software: Picasa 3.0
Date/Time: 2010:05:25 22:53:43
YCbCr Positioning: Center of pixel array
Reference Black/White: [0,0,0] [255,255,255]
Exposure Time: 1/400 sec
Image Height: 2848 pixels
Image Width: 4288 pixels
Number of Components: 3
Component 1
Y component: Quantization table 0, Sampling factors 1 horiz/1 vert
Component 2
Cb component: Quantization table 1, Sampling factors 1 horiz/1 vert
Component 3
Cr component: Quantization table 1, Sampling factors 1 horiz/1 vert
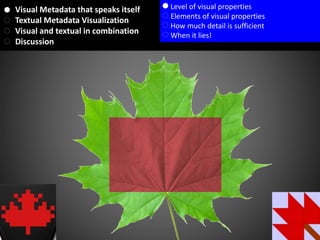
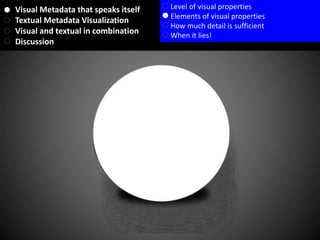
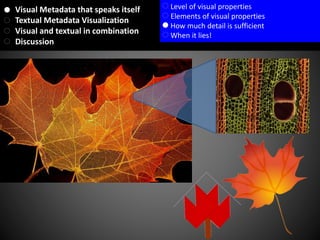
Visual Metadata that speaks itself
Textual Metadata Visualization
Visual and textual in combination
Discussion
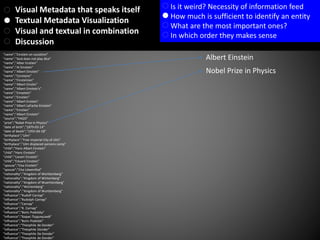
Is it weird? Necessity of information feed
How much is sufficient to identify an entity
What are the most important ones?
In which order they makes sense](https://image.slidesharecdn.com/data-metadatavisualization-141226071143-conversion-gate01/85/Data-metadata-visualization-12-320.jpg)


The document discusses different types of metadata visualization including visual metadata, textual metadata, and combinations of visual and textual metadata. It notes that visual metadata representation should provide sufficient detail while avoiding deception, and that textual metadata used to identify entities should include the most important information elements in a sensible order.


