Download to read offline

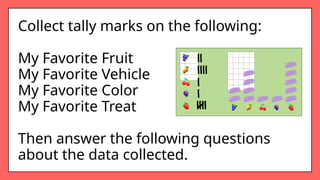
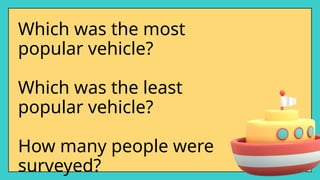
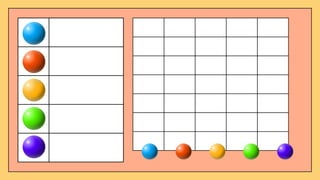
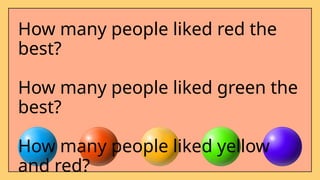
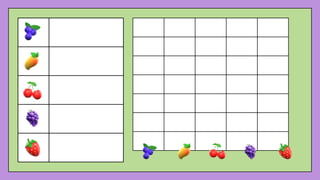
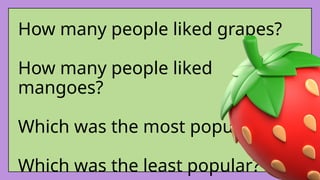
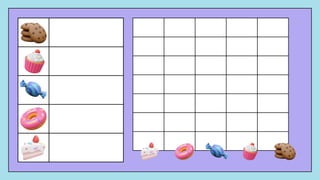
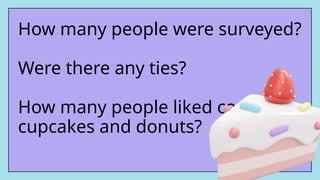
The document outlines a presentation focused on data mathematics through collecting, graphing, and analyzing preferences regarding fruit, vehicles, colors, and treats. It includes activities such as tally marking and questions aimed at understanding popularity and survey demographics. Key inquiries involve identifying most and least favorite items, total respondents, and potential ties in preferences.


