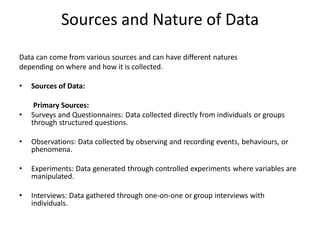
Sources and Natureof Data
Data can come from various sources and can have different natures
depending on where and how it is collected.
• Sources of Data:
Primary Sources:
• Surveys and Questionnaires: Data collected directly from individuals or groups
through structured questions.
• Observations: Data collected by observing and recording events, behaviours, or
phenomena.
• Experiments: Data generated through controlled experiments where variables are
manipulated.
• Interviews: Data gathered through one-on-one or group interviews with
individuals.
4.
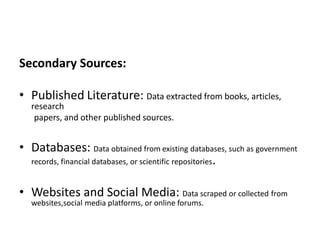
Secondary Sources:
• PublishedLiterature: Data extracted from books, articles,
research
papers, and other published sources.
• Databases: Data obtained from existing databases, such as government
records, financial databases, or scientific repositories.
• Websites and Social Media: Data scraped or collected from
websites,social media platforms, or online forums.
5.
Sources and Natureof Data
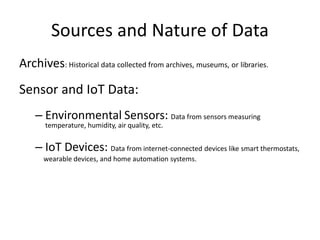
Archives: Historical data collected from archives, museums, or libraries.
Sensor and IoT Data:
– Environmental Sensors: Data from sensors measuring
temperature, humidity, air quality, etc.
– IoT Devices: Data from internet-connected devices like smart thermostats,
wearable devices, and home automation systems.
6.
Sources of Data
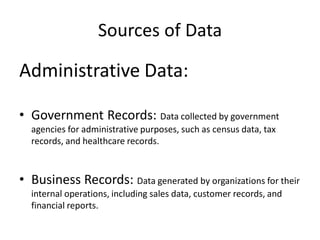
AdministrativeData:
• Government Records: Data collected by government
agencies for administrative purposes, such as census data, tax
records, and healthcare records.
• Business Records: Data generated by organizations for their
internal operations, including sales data, customer records, and
financial reports.
7.
Sources of Data
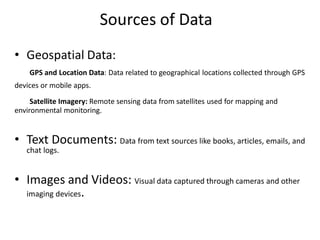
•Geospatial Data:
GPS and Location Data: Data related to geographical locations collected through GPS
devices or mobile apps.
Satellite Imagery: Remote sensing data from satellites used for mapping and
environmental monitoring.
• Text Documents: Data from text sources like books, articles, emails, and
chat logs.
• Images and Videos: Visual data captured through cameras and other
imaging devices.
8.
Nature of Data
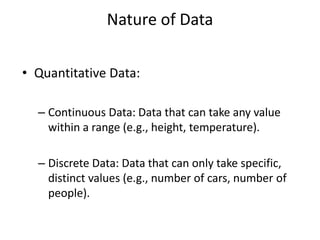
•Quantitative Data:
– Continuous Data: Data that can take any value
within a range (e.g., height, temperature).
– Discrete Data: Data that can only take specific,
distinct values (e.g., number of cars, number of
people).
9.
Qualitative Data
• NominalData: Data with categories that have no
inherent order (e.g., colors, gender).
• Ordinal Data: Data with categories that have a
meaningful order (e.g., education levels,customer
satisfaction ratings).
• Time-Series Data: Data collected at regular intervals
over time, often used for analyzing trends and patterns
(e.g., stock prices, weather data).
10.
Qualitative Data
• SpatialData: Data associated with specific
geographical locations (e.g., coordinates, GIS data).
• Categorical Data: Data that falls into distinct
categories (e.g., types of fruits, vehicle makes).
• Binary Data: Data with only two possible values (e.g.,
yes/no, true/false).
• Text Data: Data in the form of text, which can be
analyzed through natural language processing
techniques.
11.
Qualitative Data
• MultimodalData: Data that combines multiple
types of data, such as text, images, and sensor
readings.
• Understanding the source and nature of data is
crucial for data collection,storage, analysis, and
interpretation in various fields, including data
science, research, and decision-making
processes.
12.
Classification of Data
Datacan be classified into three main categories based on its structure and organization:
structured data, semi-structured data, and unstructured data.
• Structured Data:
• Definition: Structured data is highly organized and formatted data that follows a
specific, predefined schema. It is typically stored in relational databases or
spreadsheets.
• Characteristics:
– Each data element has a well-defined data type.
– Data is organized into rows and columns.
– Data can be easily queried, analyzed, and processed using SQL or other database
management systems.
13.
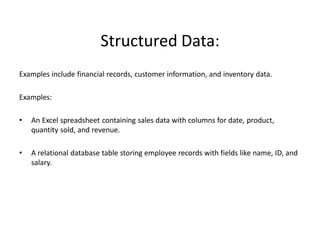
Structured Data:
Examples includefinancial records, customer information, and inventory data.
Examples:
• An Excel spreadsheet containing sales data with columns for date, product,
quantity sold, and revenue.
• A relational database table storing employee records with fields like name, ID, and
salary.
14.
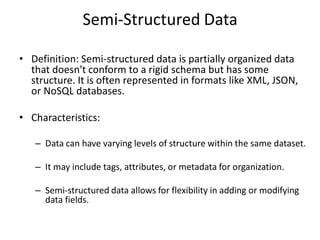
Semi-Structured Data
• Definition:Semi-structured data is partially organized data
that doesn't conform to a rigid schema but has some
structure. It is often represented in formats like XML, JSON,
or NoSQL databases.
• Characteristics:
– Data can have varying levels of structure within the same dataset.
– It may include tags, attributes, or metadata for organization.
– Semi-structured data allows for flexibility in adding or modifying
data fields.
15.
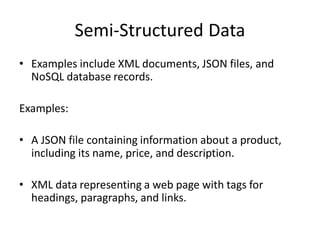
Semi-Structured Data
• Examplesinclude XML documents, JSON files, and
NoSQL database records.
Examples:
• A JSON file containing information about a product,
including its name, price, and description.
• XML data representing a web page with tags for
headings, paragraphs, and links.
16.
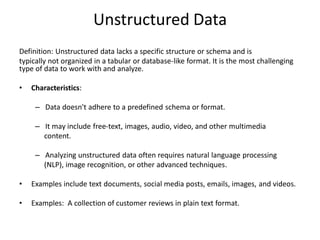
Unstructured Data
Definition: Unstructureddata lacks a specific structure or schema and is
typically not organized in a tabular or database-like format. It is the most challenging
type of data to work with and analyze.
• Characteristics:
– Data doesn't adhere to a predefined schema or format.
– It may include free-text, images, audio, video, and other multimedia
content.
– Analyzing unstructured data often requires natural language processing
(NLP), image recognition, or other advanced techniques.
• Examples include text documents, social media posts, emails, images, and videos.
• Examples: A collection of customer reviews in plain text format.
17.
Need of Dataanalytics
• Data analytics is essential in today's world for several reasons:
• Informed Decision-Making: Data analytics provides organizations
with the ability to make data-driven decisions. By analyzing data,
businesses can gain insights into customer behavior, market trends,
and operational efficiency, enabling them to make more informed
and strategic choices.
• Competitive Advantage: Companies that effectively harness data
analytics gain a competitive edge. They can identify opportunitiesand
threats quickly, respond to market changes, and adapt their
strategies to stay ahead of competitors.
18.
Need of Dataanalytics
• Cost Reduction: Data analytics can help identify areas where cost
savings are possible. By optimizing processes and resource allocation based on
data analysis, organizations can reduce unnecessary expenditures and improve
their overall efficiency.
• Customer Insights: Understanding customer preferences,
behaviour, and feedback is crucial for businesses. Data analytics allows
companies to segment their customer base, tailor products or services,
and create personalized marketing campaigns, enhancing customer
satisfaction and loyalty.
19.
Need of Dataanalytics
• Risk Management: Data analytics is valuable for identifying
potential risks and fraud. By analyzing data patterns, organizations can detect
anomalies and fraudulent activities, reducing financial losses and reputational
damage.
• Operational Efficiency: Data analytics can optimize supply
chain management, resource allocation, and production processes. It helps
organizations streamline their operations, reduce waste, and improve
productivity.
20.
Need of Dataanalytics
• Predictive Analytics: Predictive analytics uses historical data
to forecast future trends and outcomes. This capability is
particularly useful in areas like sales forecasting, demand planning,
and preventive maintenance, enabling organizations to proactively
address issues and seize opportunities.
• Market Research: Data analytics aids in understanding market
dynamics, customer sentiment, and competitive landscapes. It
helps businesses tailor their marketing strategies, product
development, and market positioning to meet consumer demands
effectively.
21.
• Healthcare andLife Sciences: In healthcare,
data analytics is crucial for patient care, drug
development, disease prevention, and public health
management. It can lead to improved patient
outcomes and reduced healthcare costs.
• Scientific Research: In scientific fields, data analytics
plays a vital role in processing and analyzing large
datasets, enabling researchers to make discoveries,
solve complex problems, and advance knowledge in
various domains.
22.
• Government andPublic Policy: Data analytics assists
governments in making informed decisions about public policy,
resource allocation, and emergency response. It can also help identify
and address social and economic issues more effectively.
• Personalization: In the digital era, data analytics powers
personalization in various industries, such as e-commerce, content
recommendation, and online advertising. By analyzing user behavior,
organizations can deliver tailored experiences to individuals.
23.
Evolution of analyticscalability
The evolution of analytic scalability has been closely tied to
dvancements in technology, data processing methods, and the
growing demands for handling vast amounts of data efficiently. Here's
an overview of the key stages in the evolution of analytic scalability:
• Manual Analysis (Pre-Computer Era): Before the advent of
computers, data analysis was a manual and labor-intensive process.
Analysts had to work with relatively small datasets, and scaling up
analytical processes was limited by human capacity.
24.
Evolution of analyticscalability
• Mainframes and Batch Processing (1950s-1960s): The introduction of
mainframe computers allowed for more extensive data processing
capabilities. However, analysis was typically performed in batch mode,
where data was collected over a period and then processed in a single
batch job. Scalability was still limited by the capacity of the mainframe.
• Relational Databases (1970s-1980s): The development of relational
database management systems (RDBMS) brought significant improvements
in data management and scalability. SQL-based queries allowed for more
complex data analysis, but scalability was constrained by the limitations of
hardware and the rigid structures of relational databases.
25.
Evolution of analyticscalability
• Data Warehousing (1980s-1990s): Data warehousing solutions
emerged, which involved the extraction, transformation, and loading
(ETL) of data from multiple sources into a centralized repository. This
allowed for historical data analysis and scalability by adding more
storage capacity.
• Parallel Processing (1990s-2000s): The rise of parallel processing
architectures, such as Massively Parallel Processing (MPP) databases,
enabled data analytics to be distributed across multiple nodes or
servers. This parallelization significantly improved the scalability of
data analytics.
26.
Evolution of analyticscalability
• Big Data and NoSQL (Mid-2000s-Present): The advent of big data
technologies, including Hadoop and NoSQL databases, marked a
significant shift in analytic scalability. These technologies allowed
organizations to store and process vast amounts of unstructured or
semi-structured data across distributed clusters of commodity
hardware. Scalability was no longer limited by a single server's
capacity.
• Cloud Computing (2000s-Present): Cloud computing platforms like
Amazon Web Services (AWS), Google Cloud Platform (GCP), and
Microsoft Azure have revolutionized analytic scalability. They
provide scalable, on-demand resources that can be easily
provisioned or de-provisioned based on workload needs. Cloud-
based data warehouses and analytics services have made it more
accessible for organizations to scale their analytics operations.
27.
Evolution of analyticscalability
In-Memory Computing (2010s-Present): The adoption of in-memory
computing technologies, such as Apache Spark and in-memory databases,
has further improved analytic scalability by enabling real-time processing
and analysis of large datasets. Data can be loaded into memory for faster
access and analysis.
Machine Learning and AI Integration (2010s-Present): The integration of
machine learning and artificial intelligence into analytics processes has
introduced scalable predictive and prescriptive analytics capabilities. These
technologies can analyze large datasets and make real-time decisions or
recommendations at scale.
28.
Evolution of analyticscalability
• Serverless and Containerization (2010s-Present): Serverless
computing and containerization technologies, like Docker and
Kubernetes, have made it easier to scale analytics applications
dynamically, allocating resources as needed and optimizing
infrastructure utilization.
• Edge Analytics (Emerging): The growing importance of edge
computing is bringing analytics closer to the data source, allowing
real-time analysis of data at the edge of the network. This is especially
important for IoT and other applications requiring immediate insights
without transmitting data to centralized locations.
29.
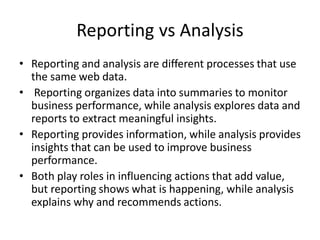
Reporting vs Analysis
•Reporting and analysis are different processes that use
the same web data.
• Reporting organizes data into summaries to monitor
business performance, while analysis explores data and
reports to extract meaningful insights.
• Reporting provides information, while analysis provides
insights that can be used to improve business
performance.
• Both play roles in influencing actions that add value,
but reporting shows what is happening, while analysis
explains why and recommends actions.
30.
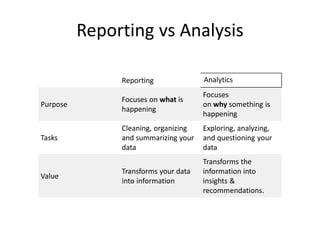
Reporting vs Analysis
ReportingAnalytics
Purpose
Focuses on what is
happening
Focuses
on why something is
happening
Tasks
Cleaning, organizing
and summarizing your
data
Exploring, analyzing,
and questioning your
data
Value
Transforms your data
into information
Transforms the
information into
insights &
recommendations.
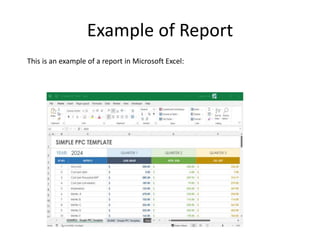
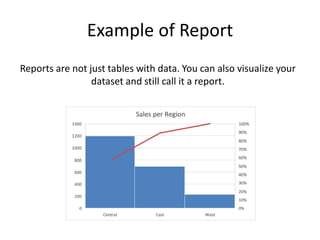
Reports are notjust tables with data. You can also visualize your
dataset and still call it a report.
Example of Report
33.
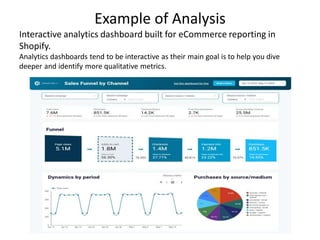
Interactive analytics dashboardbuilt for eCommerce reporting in
Shopify.
Analytics dashboards tend to be interactive as their main goal is to help you dive
deeper and identify more qualitative metrics.
Example of Analysis
34.
Reporting vs. analytics:What should
you choose?
• If your main goal is to understand what is going
on with your business, how different
departments performed or how many users have
subscribed to your service then you should just
focus on the reporting side.
• However, if you want to understand why you are
seeing these numbers or if you want to
understand if there is a correlation between two
reported metrics, then you will need to take it
one step further and focus on analytics