Download to read offline
![Tracking
Click continue
Select section [section=2]
Select section [section=3]](https://image.slidesharecdn.com/dayx-dataanalystforsaas-170616074700/85/Data-analyst-for-SaaS-9-320.jpg)
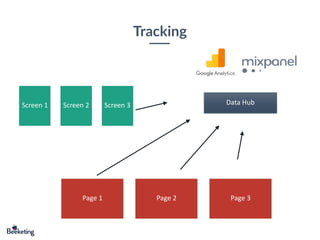
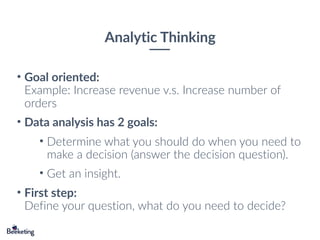
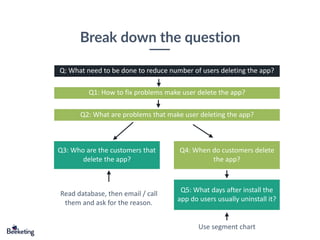
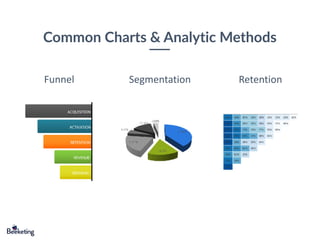
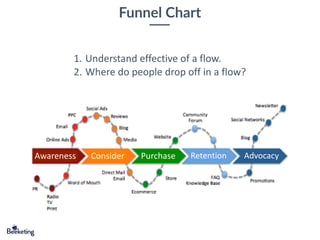
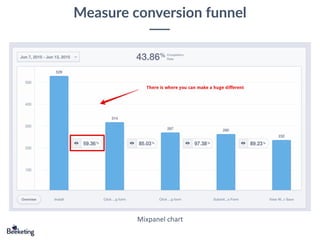
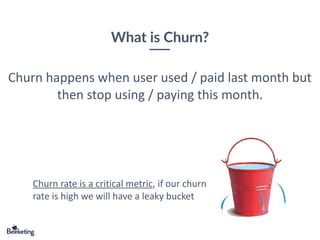
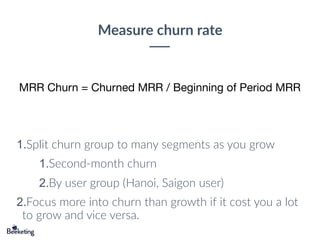
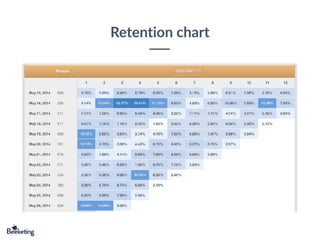
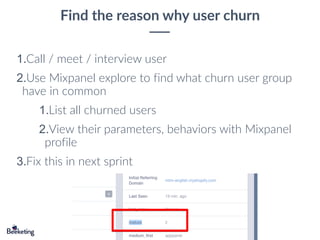
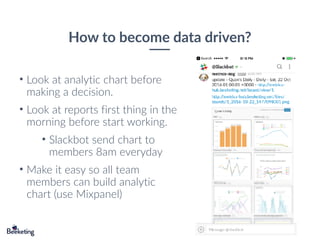

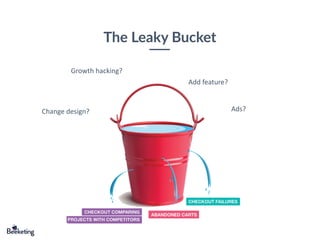
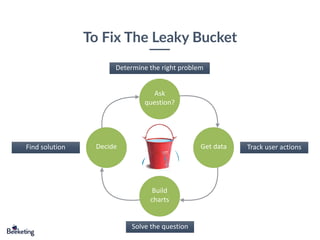
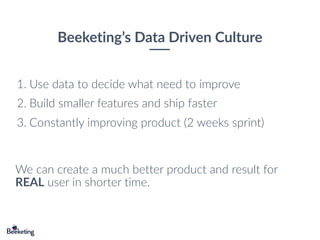
This document discusses how Beeketing became data-driven and achieved $720k in ARR and raised $400k in funding. It outlines Beeketing's data-driven culture of using data to improve the product through 2-week sprints. Key metrics like funnels, segmentation, and retention are tracked to understand user behavior and identify areas for improvement. Common questions are broken down and data is analyzed to determine the root causes of issues and make decisions.


![[DSC Europe 25] Marcos Heidemann - Beyond the Hype: Making AI Coding Assistan...](https://cdn.slidesharecdn.com/ss_thumbnails/eexkhvldrjsopspdjbur-marcos-heidemann-beyond-the-hype-getting-real-value-out-of-ai-assisted-coding-260121115910-7e9d41ec-thumbnail.jpg?width=640&height=640&fit=bounds)


![[DSC Europe 25] Tamas Srancsik - How To Teach Your AI Football? An Argument f...](https://cdn.slidesharecdn.com/ss_thumbnails/bcjh1m9xtbosv20ucftb-tamas-srancsik-how-to-teach-your-ai-football-260121115910-08b53e9e-thumbnail.jpg?width=640&height=640&fit=bounds)


![[DSC Europe 25] Srdj Stanisic - Local and Private AI in UX.pdf](https://cdn.slidesharecdn.com/ss_thumbnails/vwmetykqmztgmokmmkfa-3-srdjan-stanisic-local-and-small-ai-in-ux-260120105855-55a31869-thumbnail.jpg?width=640&height=640&fit=bounds)