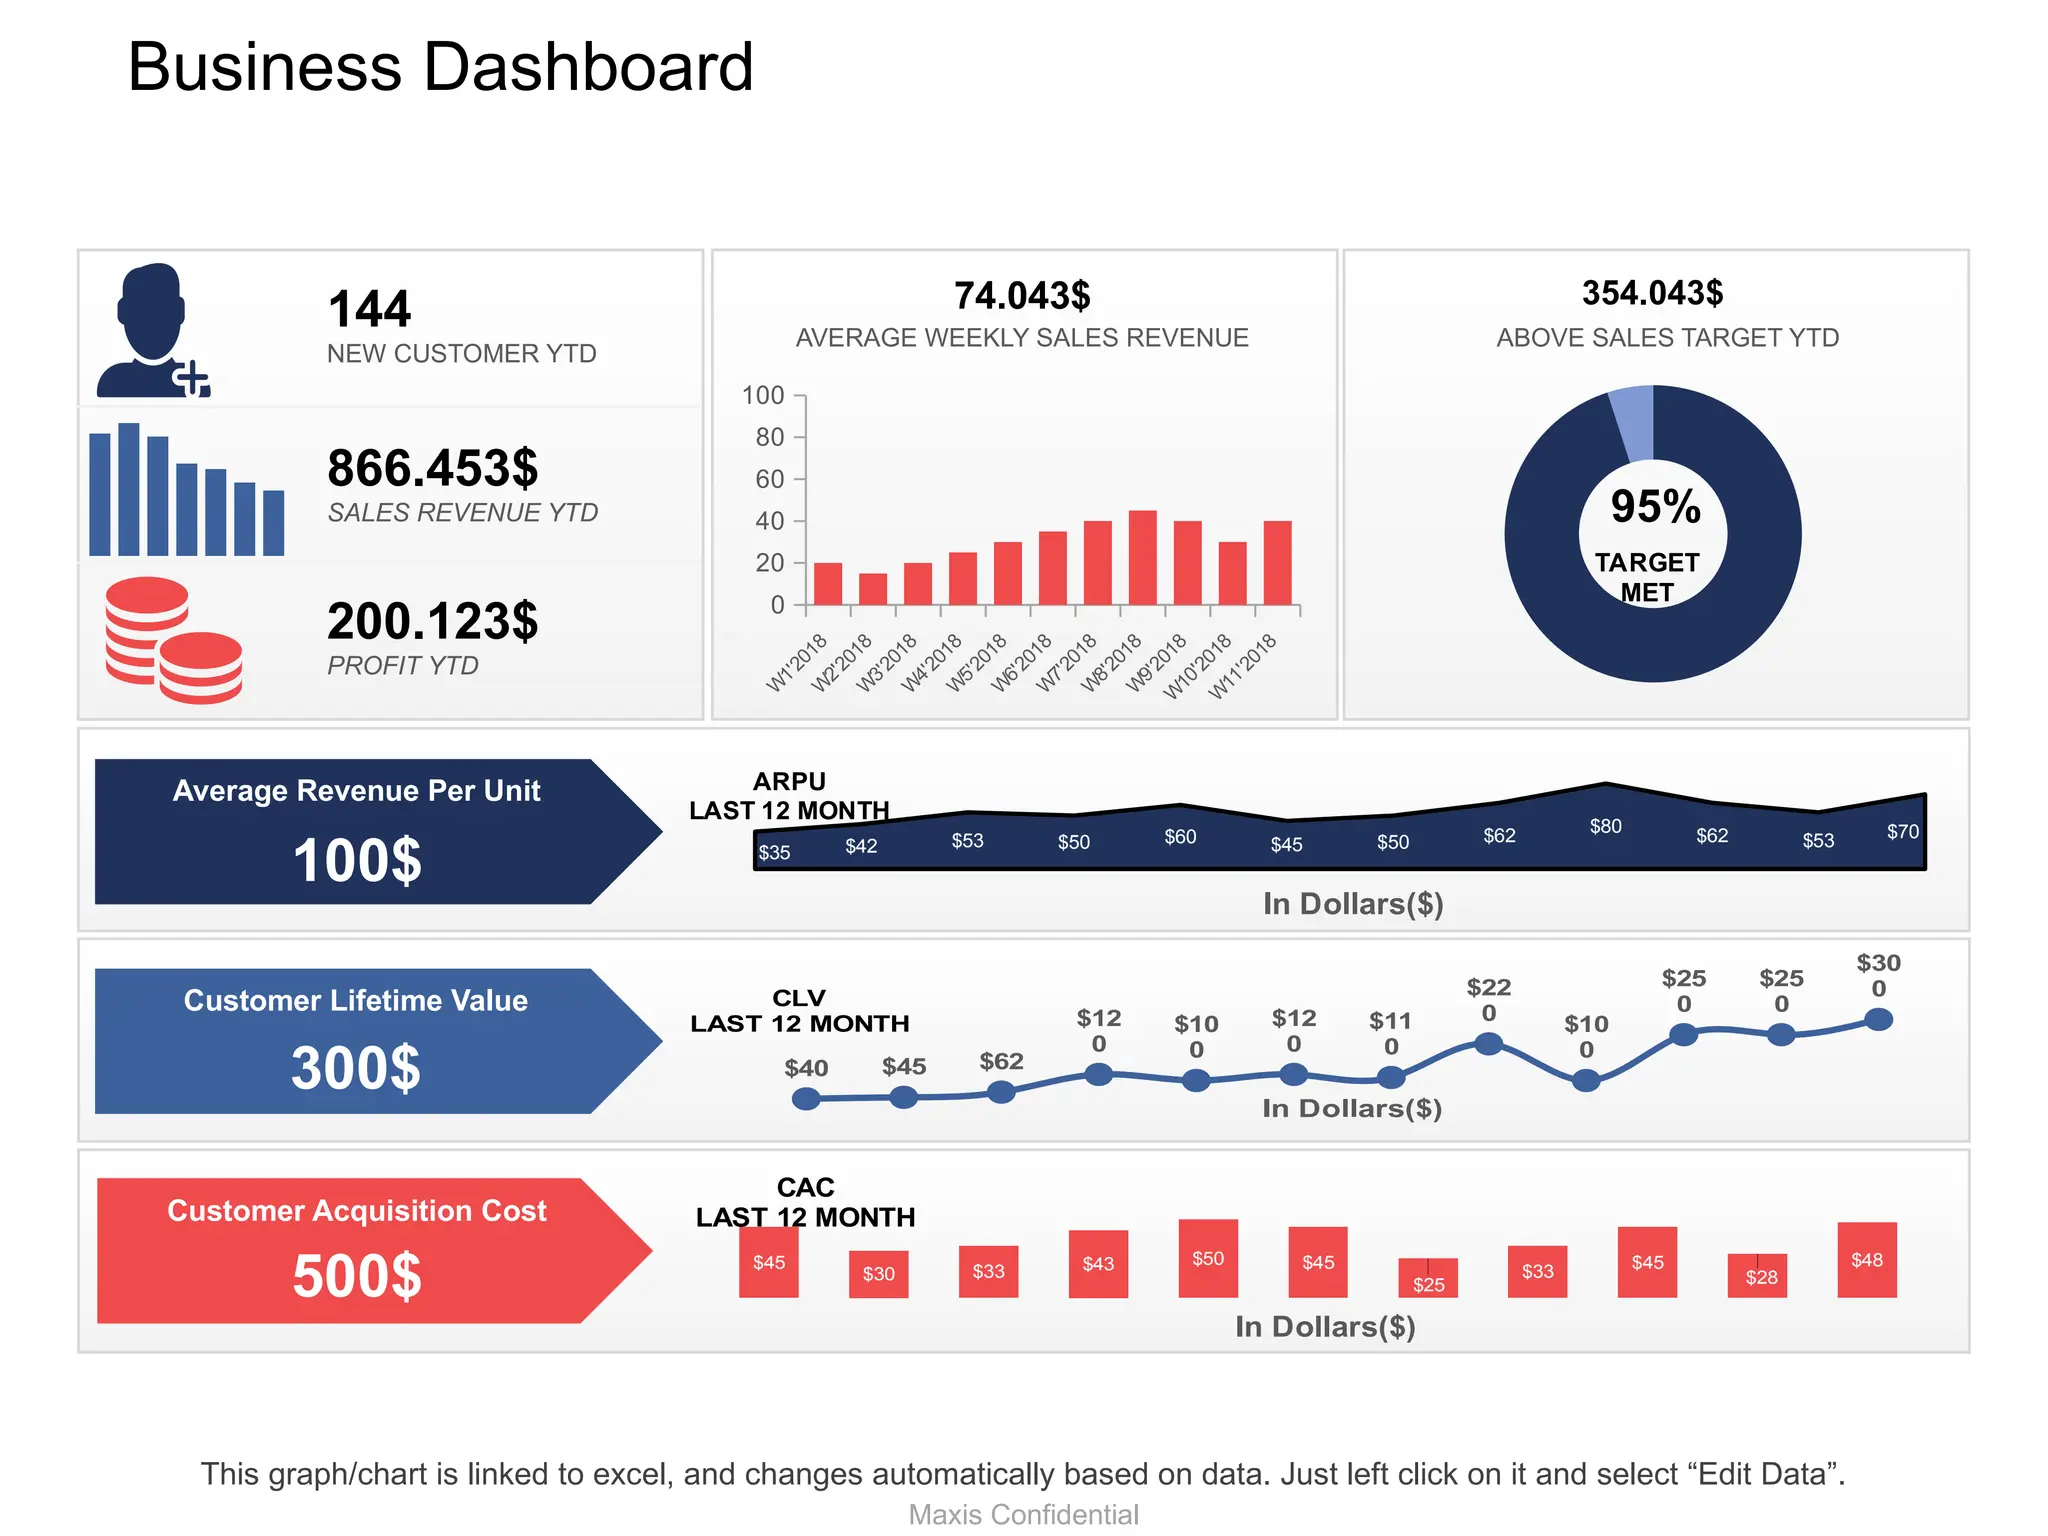
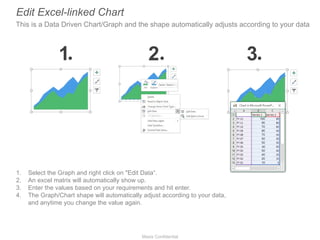
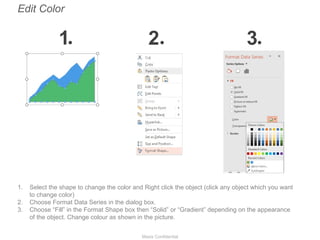
The document provides financial performance metrics for Maxis, including customer acquisition cost, average revenue per unit, and sales revenue year-to-date, alongside instructions for editing linked Excel charts in a PowerPoint presentation. Notably, it highlights achieving 95% of sales targets and includes guidelines for customizing graph colors and shapes. Additionally, it references resources for editable icons available online.