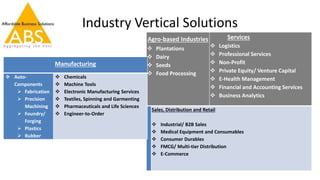
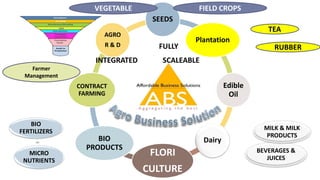
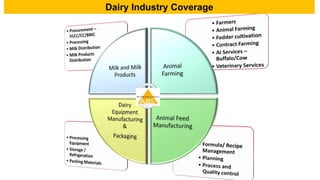
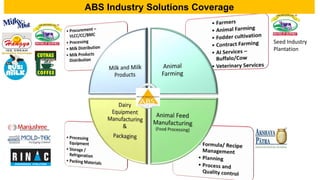
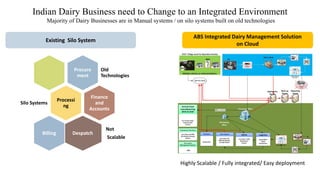
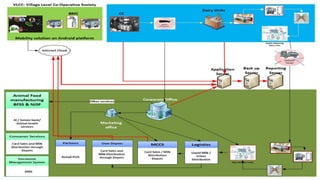
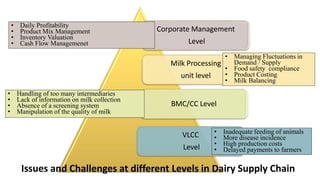
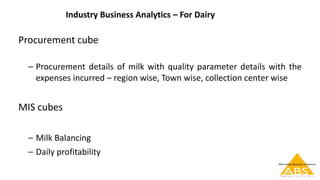
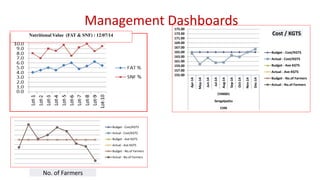
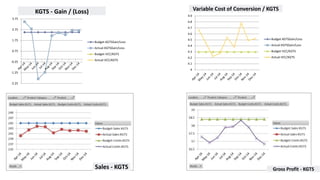
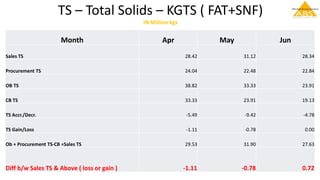
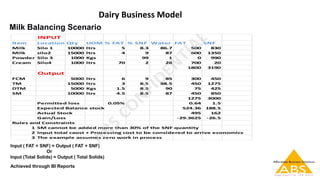
Perspective on Cloud Technology
for
Dairy Business
Dairy Connect 2015 – ERODE – 18th June 2015
Agenda
• ABS Intro
• Agro / Dairy Business Vertical Overview
• Dairy Industry Business Analytics
• Dairy Industry Eco System
• Dairy Business Model
• Key Industry Challenges
• Unique requirements of Dairy Industry
• Q & A
Affordable Business Solutions
ABS
Strategy Maps
and Balanced
Scorecard
“Cash-to-Cash
Cycle”
Management
LEAN /Global
Manufacturing
Family
Business
HR/ People
Practice
Industry Vertical Solutions
Our Value Proposition
ABS (www.abs.in) enables organizations to become globally
competitive by establishing business processes and analytics
essential for consistent, profitable growth - transforming them
from an “individual-dependent” to a “process-centric” mode of
operation.
Industry Vertical Solutions
Agro-based Industries
 Plantations
 Dairy
 Seeds
 Food Processing
Services
 Logistics
 Professional Services
 Non-Profit
 Private Equity/ Venture Capital
 E-Health Management
 Financial and Accounting Services
 Business Analytics
Sales, Distribution and Retail
 Industrial/ B2B Sales
 Medical Equipment and Consumables
 Consumer Durables
 FMCG/ Multi-tier Distribution
 E-Commerce
Manufacturing
 Auto-
Components
 Fabrication
 Precision
Machining
 Foundry/
Forging
 Plastics
 Rubber
 Chemicals
 Machine Tools
 Electronic Manufacturing Services
 Textiles, Spinning and Garmenting
 Pharmaceuticals and Life Sciences
 Engineer-to-Order
ABS Agro
Industry
Solution
SEEDS
Plantation
Edible
Oil
Dairy
FLORI
CULTURE
BIO
PRODUCTS
CONTRACT
FARMING
AGRO
R & D
BEVERAGES &
JUICES
MILK & MILK
PRODUCTS
MICRO
NUTRIENTS
BIO
FERTILIZERS
VEGETABLE FIELD CROPS
TEA
RUBBER
Farmer
Management
Dairy Industry Coverage
ABS Industry Solutions Coverage
Seed Industry
Plantation
ABS Integrated Dairy Management Solution
on Cloud
Existing Silo System
Indian Dairy Business need to Change to an Integrated Environment
Majority of Dairy Businesses are in Manual systems / on silo systems built on old technologies
Procure
ment
Old
Technologies
Processi
ng
Silo Systems
Finance
and
Accounts
Despatch
Not
Scalable
Billing
Highly Scalable / Fully integrated/ Easy deployment
• Dodla Dairy Video Case study
....ABS case studiesvideo case studiesDodlaDodla diary
Testimonial.mp4
Milk Processing
unit level
Corporate Management
Level
BMC/CC Level
VLCC
Level
• Inadequate feeding of animals
• More disease incidence
• High production costs
• Delayed payments to farmers
• Handling of too many intermediaries
• Lack of information on milk collection
• Absence of a screening system
• Manipulation of the quality of milk
• Managing Fluctuations in
Demand / Supply
• Food safety compliance
• Product Costing
• Milk Balancing
• Daily Profitability
• Product Mix Management
• Inventory Valuation
• Cash Flow Managemenet
Issues and Challenges at different Levels in Dairy Supply Chain
Industry Business Analytics – For Dairy
Procurement cube
– Procurement details of milk with quality parameter details with the
expenses incurred – region wise, Town wise, collection center wise
MIS cubes
– Milk Balancing
– Daily profitability
Management Dashboards
Nutritional Value (FAT & SNF) : 12/07/14
155.00
157.00
159.00
161.00
163.00
165.00
167.00
169.00
171.00
173.00
175.00
Apr-14
May-14
Jun-14
Jul-14
Aug-14
Sep-14
Oct-14
Nov-14
Dec-14
CHN001
Sengalpattu
CHN
Budget - Cost/KGTS
Actual - Cost/KGTS
Budget - Ave KGTS
Actual - Ave KGTS
Budget - No.of Farmers
Actual - No.of Farmers
Cost / KGTS
Budget - Cost/KGTS
Actual - Cost/KGTS
Budget - Ave KGTS
Actual - Ave KGTS
Budget - No.of Farmers
Actual - No.of Farmers
No. of Farmers
-2.25
-1.25
-0.25
0.75
1.75
2.75
3.75
Budget-KGTSGain/Loss
Actual-KGTSGain/Loss
Budget-VCC/KGTS
Actual-VCC/KGTS
4
4.1
4.2
4.3
4.4
4.5
4.6
4.7
4.8
4.9
Budget-KGTSGain/Loss
Actual-KGTSGain/Loss
Budget-VCC/KGTS
Actual-VCC/KGTS
KGTS - Gain / (Loss) Variable Cost of Conversion / KGTS
Sales - KGTS Gross Profit - KGTS
TS – Total Solids – KGTS ( FAT+SNF)
IN Million kgs
Month Apr May Jun
Sales TS 28.42 31.12 28.34
Procurement TS 24.04 22.48 22.84
OB TS 38.82 33.33 23.91
CB TS 33.33 23.91 19.13
TS Accr./Decr. -5.49 -9.42 -4.78
TS Gain/Loss -1.11 -0.78 0.00
Ob + Procurement TS-CB =Sales TS 29.53 31.90 27.63
Diff b/w Sales TS & Above ( loss or gain ) -1.11 -0.78 0.72
Dairy Business Model
Milk Balancing Scenario
INPUT
Item Location Qty UOM % FAT % SNF Water FAT SNF
Milk Silo 1 10000 ltrs 5 8.3 86.7 500 830
Milk silo2 15000 ltrs 4 9 87 600 1350
Powder Silo 3 1000 Kgs 99 1 0 990
Cream Silo4 1000 ltrs 70 2 28 700 20
1800 3190
Output
FCM 5000 ltrs 6 9 85 300 450
TM 15000 ltrs 3 8.5 88.5 450 1275
DTM 5000 Kgs 1.5 8.5 90 75 425
SM 10000 ltrs 4.5 8.5 87 450 850
1275 3000
Permitted loss 0.05% 0.64 1.5
Expected Balance stock 524.36 188.5
Actual Stock 495 162
Gain/Loss -29.3625 -26.5
Rules and Constraints
1 SM cannot be added more than 30% of the SNF quantity
2 Input total caost + Processing cost to be considered to arrive economics
3 The example assumes zero work in process
Input ( FAT + SNF) = Output ( FAT + SNF)
Or
Input (Total Solids) = Output ( Total Solids)
Achieved through BI Reports
18
Affordable Business Solutions
Operation “Baadal”/ “Megham”
Business Model
• Minimal Capital Expenditure
• One-time Start-up Fee
• Quarterly Subscription Payments from customers.
• Back to Back payment to business partners
Finally Who are we
• Just an IT Provider
• Just a consultant
• Expert with Domain knowledge who are both a
Consultant and an IT provider
X
X
Thank You
Akshayapatra – Video case study – Most Social
Impactful ABS Implementation

DAIRY CLOUD COMPUTING

  • 1.
    Perspective on CloudTechnology for Dairy Business Dairy Connect 2015 – ERODE – 18th June 2015
  • 2.
    Agenda • ABS Intro •Agro / Dairy Business Vertical Overview • Dairy Industry Business Analytics • Dairy Industry Eco System • Dairy Business Model • Key Industry Challenges • Unique requirements of Dairy Industry • Q & A
  • 3.
    Affordable Business Solutions ABS StrategyMaps and Balanced Scorecard “Cash-to-Cash Cycle” Management LEAN /Global Manufacturing Family Business HR/ People Practice Industry Vertical Solutions
  • 4.
    Our Value Proposition ABS(www.abs.in) enables organizations to become globally competitive by establishing business processes and analytics essential for consistent, profitable growth - transforming them from an “individual-dependent” to a “process-centric” mode of operation.
  • 5.
    Industry Vertical Solutions Agro-basedIndustries  Plantations  Dairy  Seeds  Food Processing Services  Logistics  Professional Services  Non-Profit  Private Equity/ Venture Capital  E-Health Management  Financial and Accounting Services  Business Analytics Sales, Distribution and Retail  Industrial/ B2B Sales  Medical Equipment and Consumables  Consumer Durables  FMCG/ Multi-tier Distribution  E-Commerce Manufacturing  Auto- Components  Fabrication  Precision Machining  Foundry/ Forging  Plastics  Rubber  Chemicals  Machine Tools  Electronic Manufacturing Services  Textiles, Spinning and Garmenting  Pharmaceuticals and Life Sciences  Engineer-to-Order
  • 6.
    ABS Agro Industry Solution SEEDS Plantation Edible Oil Dairy FLORI CULTURE BIO PRODUCTS CONTRACT FARMING AGRO R &D BEVERAGES & JUICES MILK & MILK PRODUCTS MICRO NUTRIENTS BIO FERTILIZERS VEGETABLE FIELD CROPS TEA RUBBER Farmer Management
  • 7.
  • 8.
    ABS Industry SolutionsCoverage Seed Industry Plantation
  • 9.
    ABS Integrated DairyManagement Solution on Cloud Existing Silo System Indian Dairy Business need to Change to an Integrated Environment Majority of Dairy Businesses are in Manual systems / on silo systems built on old technologies Procure ment Old Technologies Processi ng Silo Systems Finance and Accounts Despatch Not Scalable Billing Highly Scalable / Fully integrated/ Easy deployment
  • 11.
    • Dodla DairyVideo Case study ....ABS case studiesvideo case studiesDodlaDodla diary Testimonial.mp4
  • 12.
    Milk Processing unit level CorporateManagement Level BMC/CC Level VLCC Level • Inadequate feeding of animals • More disease incidence • High production costs • Delayed payments to farmers • Handling of too many intermediaries • Lack of information on milk collection • Absence of a screening system • Manipulation of the quality of milk • Managing Fluctuations in Demand / Supply • Food safety compliance • Product Costing • Milk Balancing • Daily Profitability • Product Mix Management • Inventory Valuation • Cash Flow Managemenet Issues and Challenges at different Levels in Dairy Supply Chain
  • 13.
    Industry Business Analytics– For Dairy Procurement cube – Procurement details of milk with quality parameter details with the expenses incurred – region wise, Town wise, collection center wise MIS cubes – Milk Balancing – Daily profitability
  • 14.
    Management Dashboards Nutritional Value(FAT & SNF) : 12/07/14 155.00 157.00 159.00 161.00 163.00 165.00 167.00 169.00 171.00 173.00 175.00 Apr-14 May-14 Jun-14 Jul-14 Aug-14 Sep-14 Oct-14 Nov-14 Dec-14 CHN001 Sengalpattu CHN Budget - Cost/KGTS Actual - Cost/KGTS Budget - Ave KGTS Actual - Ave KGTS Budget - No.of Farmers Actual - No.of Farmers Cost / KGTS Budget - Cost/KGTS Actual - Cost/KGTS Budget - Ave KGTS Actual - Ave KGTS Budget - No.of Farmers Actual - No.of Farmers No. of Farmers
  • 15.
  • 16.
    TS – TotalSolids – KGTS ( FAT+SNF) IN Million kgs Month Apr May Jun Sales TS 28.42 31.12 28.34 Procurement TS 24.04 22.48 22.84 OB TS 38.82 33.33 23.91 CB TS 33.33 23.91 19.13 TS Accr./Decr. -5.49 -9.42 -4.78 TS Gain/Loss -1.11 -0.78 0.00 Ob + Procurement TS-CB =Sales TS 29.53 31.90 27.63 Diff b/w Sales TS & Above ( loss or gain ) -1.11 -0.78 0.72
  • 17.
    Dairy Business Model MilkBalancing Scenario INPUT Item Location Qty UOM % FAT % SNF Water FAT SNF Milk Silo 1 10000 ltrs 5 8.3 86.7 500 830 Milk silo2 15000 ltrs 4 9 87 600 1350 Powder Silo 3 1000 Kgs 99 1 0 990 Cream Silo4 1000 ltrs 70 2 28 700 20 1800 3190 Output FCM 5000 ltrs 6 9 85 300 450 TM 15000 ltrs 3 8.5 88.5 450 1275 DTM 5000 Kgs 1.5 8.5 90 75 425 SM 10000 ltrs 4.5 8.5 87 450 850 1275 3000 Permitted loss 0.05% 0.64 1.5 Expected Balance stock 524.36 188.5 Actual Stock 495 162 Gain/Loss -29.3625 -26.5 Rules and Constraints 1 SM cannot be added more than 30% of the SNF quantity 2 Input total caost + Processing cost to be considered to arrive economics 3 The example assumes zero work in process Input ( FAT + SNF) = Output ( FAT + SNF) Or Input (Total Solids) = Output ( Total Solids) Achieved through BI Reports
  • 18.
  • 19.
    Business Model • MinimalCapital Expenditure • One-time Start-up Fee • Quarterly Subscription Payments from customers. • Back to Back payment to business partners
  • 20.
    Finally Who arewe • Just an IT Provider • Just a consultant • Expert with Domain knowledge who are both a Consultant and an IT provider X X
  • 21.
    Thank You Akshayapatra –Video case study – Most Social Impactful ABS Implementation