The document is a daily analysis report from TP Global FX that provides an overview of recent economic data releases and events from Asia and other regions. It also analyzes key currency pairs and gold and provides technical analysis and trading recommendations for AUD/USD, EUR/USD, GBP/USD, USD/CAD, USD/JPY, and XAU/USD. Technical indicators like moving averages, RSI levels, and Fibonacci retracement levels are examined to identify potential support and resistance levels and determine current trends on hourly charts. Buy and sell signals are given based on breaks of identified price levels.

![BUY SELL
R
E
P
O
R
T
F
R
O
M
:
T
P
G
LO
B
A
L
F
X
Technical Summary
Trend Up Trend
Moving Average (Period=75) Above MA
H 1
RSI (Period=26) Above RSI LEVEL 50
FIBO Levels PIVOT
R1 S1
1762
R2 S2
1767
R3 S3
1772
R4
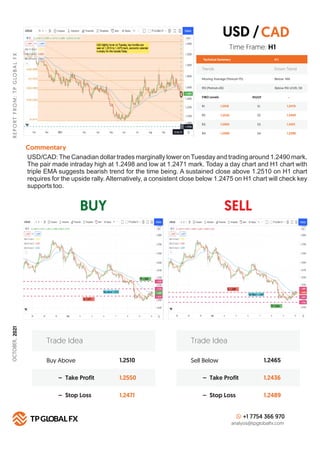
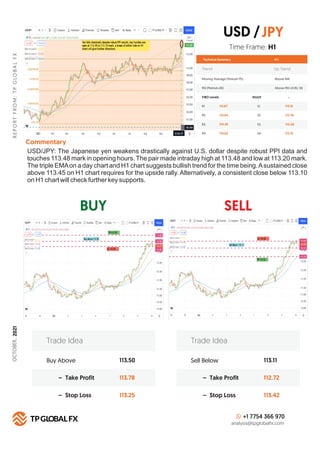
Commentary
S4
1778
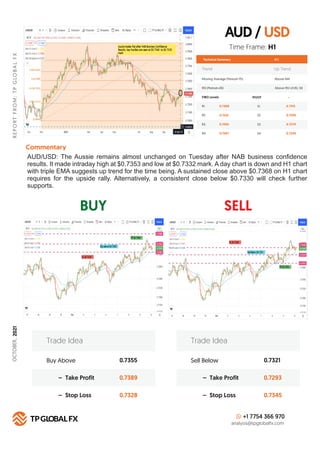
Buy Above 1762
1768
1757
– Take Profit
– Stop Loss
Trade Idea
Sell Below 1754
1747
1758
– Take Profit
– Stop Loss
Trade Idea
+1 7754 366 970
analysis@tpglobalfx.com
-
Time Frame: H1
XAU/USD (GOLD): Gold recovers slightly from previous losses but remains well supported around
$1,760 mark. Today pair made intraday high at $1,759 and low at $1,750 mark. A day chart and H1
chart with triple EMA suggests down trend for the time being. A sustained close above $1,762 on H1
chart requires for the upside rally. Alternatively, a consistent close below $1,747 will check further
supports. Later today U.S. JOLTS Job Openings data will be in focus.
XAU [GOLD]
USD
/
1747
1741
1736
1730
OCTOBER,
2021](https://image.slidesharecdn.com/daily-analysis-report-october-12-2021-211012050027/85/DAILY-ANALYSIS-REPORT-OCTOBER-12-2021-8-320.jpg)