
More Related Content
What's hot
Similar to D3 mbb per
Similar to D3 mbb per (20)
More from CoryHogue2
Recently uploaded
Recently uploaded (20)
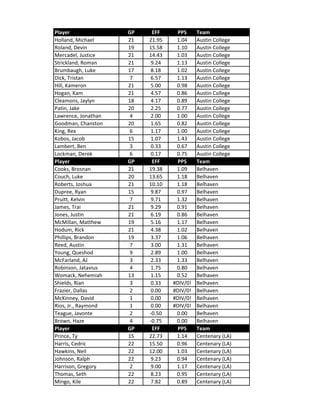
D3 mbb per
- 1. Player GP EFF PPS Team Holland, Michael 21 21.95 1.04 Austin College Roland, Devin 19 15.58 1.10 Austin College Mercadel, Justice 21 14.43 1.03 Austin College Strickland, Roman 21 9.24 1.13 Austin College Brumbaugh, Luke 17 8.18 1.02 Austin College Dick, Tristan 7 6.57 1.13 Austin College Hill, Kameron 21 5.00 0.98 Austin College Hogan, Kam 21 4.57 0.86 Austin College Cleamons, Jaylyn 18 4.17 0.89 Austin College Patin, Jake 20 2.25 0.77 Austin College Lawrence, Jonathan 4 2.00 1.00 Austin College Goodman, Chanston 20 1.65 0.82 Austin College King, Rex 6 1.17 1.00 Austin College Kobos, Jacob 15 1.07 1.43 Austin College Lambert, Ben 3 0.33 0.67 Austin College Lockman, Derek 6 0.17 0.75 Austin College Player GP EFF PPS Team Cooks, Brosnan 21 19.38 1.09 Belhaven Couch, Luke 20 13.65 1.18 Belhaven Roberts, Joshua 21 10.10 1.18 Belhaven Dupree, Ryan 15 9.87 0.97 Belhaven Pruitt, Kelvin 7 9.71 1.32 Belhaven James, Trai 21 9.29 0.91 Belhaven Jones, Justin 21 6.19 0.86 Belhaven McMillan, Matthew 19 5.16 1.17 Belhaven Hodum, Rick 21 4.38 1.02 Belhaven Phillips, Brandon 19 3.37 1.06 Belhaven Reed, Austin 7 3.00 1.31 Belhaven Young, Queshod 9 2.89 1.00 Belhaven McFarland, AJ 3 2.33 1.33 Belhaven Robinson, Jatavius 4 1.75 0.80 Belhaven Womack, Nehemiah 13 1.15 0.52 Belhaven Shields, Rian 3 0.33 #DIV/0! Belhaven Frazier, Dallas 2 0.00 #DIV/0! Belhaven McKinney, David 1 0.00 #DIV/0! Belhaven Rios, Jr., Raymond 1 0.00 #DIV/0! Belhaven Teague, Javonte 2 -0.50 0.00 Belhaven Brown, Haze 4 -0.75 0.00 Belhaven Player GP EFF PPS Team Prince, Ty 15 22.73 1.14 Centenary (LA) Harris, Cedric 22 15.50 0.96 Centenary (LA) Hawkins, Neil 22 12.00 1.03 Centenary (LA) Johnson, Ralph 22 9.23 0.94 Centenary (LA) Harrison, Gregory 2 9.00 1.17 Centenary (LA) Thomas, Seth 22 8.23 0.95 Centenary (LA) Mingo, Kile 22 7.82 0.89 Centenary (LA)
- 2. Hall, AJ 17 4.00 1.06 Centenary (LA) Wiggins, Joseph 7 3.43 0.86 Centenary (LA) Small, CJ 13 3.38 0.82 Centenary (LA) Young, Drew 11 2.36 1.11 Centenary (LA) Singleton, Tykeem 14 2.36 0.86 Centenary (LA) Hardy, Raylon 2 2.00 1.00 Centenary (LA) Johnson, Xavier 13 1.69 0.55 Centenary (LA) Smith, Dakota 2 1.50 0.00 Centenary (LA) Washington, Trent 1 1.00 #DIV/0! Centenary (LA) Keeble, Oliver 4 0.75 1.00 Centenary (LA) Compton, Joshua 3 0.00 0.50 Centenary (LA) Varela, Jonas 1 0.00 #DIV/0! Centenary (LA) Young, Kobe 2 -0.50 0.00 Centenary (LA) Player GP EFF PPS Team Black, Cooxooeii 20 22.20 1.10 Colorado College Acosta, Aaron 15 13.07 1.05 Colorado College Rounaghi, Charlie 20 8.90 0.98 Colorado College Jonas, Eric 20 8.20 0.90 Colorado College McRoskey, Jack 19 7.11 1.04 Colorado College Cunningham, Scott 20 5.70 0.96 Colorado College Elabdeia, Nabeel 20 4.75 1.16 Colorado College Dennis, DeAnte' 15 3.80 0.86 Colorado College Taylor, Jackson 6 3.33 1.10 Colorado College Kinney, Sam 20 2.85 0.76 Colorado College Hester, Niklas 5 2.80 1.10 Colorado College Woods, JJ 14 2.71 1.36 Colorado College Zechem, Isaac 15 2.27 1.03 Colorado College Tanner, Jackson 17 1.47 0.92 Colorado College Nisbet, Will 11 0.45 0.00 Colorado College Player GP EFF PPS Team Holiday, Tommy 21 11.86 1.09 Concordia (TX) Munoz, Gonzalo 20 11.65 1.19 Concordia (TX) Meikle, Philip 21 11.48 0.98 Concordia (TX) Henderson, Antoine 21 10.24 1.37 Concordia (TX) Gonzalez, Luis 21 8.10 1.10 Concordia (TX) Harris, Zaid 21 7.57 0.83 Concordia (TX) Estrada, Alexander 21 5.90 1.27 Concordia (TX) Hamilton, Ronnie 18 5.28 0.98 Concordia (TX) Harbor, Greg 1 5.00 0.90 Concordia (TX) Hester, Trevon 21 4.33 0.96 Concordia (TX) Bone, Spencer 17 3.06 0.98 Concordia (TX) Jones, Cameron 18 2.44 0.78 Concordia (TX) Bennett, Dillion 7 2.29 0.90 Concordia (TX) Berry, Jordan 21 1.81 0.81 Concordia (TX) Hammett, Christian 15 1.80 0.87 Concordia (TX) Jones, Darryl 1 1.00 #DIV/0! Concordia (TX) Natal, Joseph 3 1.00 2.00 Concordia (TX)
- 3. Williamson, Quinton 7 0.86 0.88 Concordia (TX) Johnson, Carlos 5 -0.20 0.33 Concordia (TX) Stephens, Antwan 2 -2.00 0.00 Concordia (TX) Player GP EFF PPS Team Wambsganss, Michael 15 11.93 0.97 Dallas Mathis, Dustin 21 11.24 1.10 Dallas Toussaint, Letrell 21 10.86 1.16 Dallas Love, Jai 14 9.86 0.73 Dallas Giunta, Jacob 21 7.62 0.90 Dallas Russell, John 21 7.52 0.99 Dallas Hyde, Cameran 21 6.24 0.97 Dallas Hayes, Isaiah 21 5.95 1.02 Dallas Bolen, Scott 19 3.00 1.04 Dallas Holloway, Matt 17 2.47 0.95 Dallas Lockhart, Chance 13 2.46 1.10 Dallas King, Exclamation Mark 2 2.00 2.00 Dallas Nunn, Joshua 4 1.75 0.39 Dallas Burns, Ian 7 1.29 0.91 Dallas Young, Garrett 3 0.00 0.40 Dallas Gallant, Jack 7 -0.29 0.55 Dallas Player GP EFF PPS Team Dooley, Robby 21 19.95 1.23 East Texas Baptist Haynes, Chris 21 17.95 1.24 East Texas Baptist Brown, Landin 21 13.29 0.95 East Texas Baptist Gray, Jordan 21 9.29 1.19 East Texas Baptist Taylor, Jarell 15 6.27 1.26 East Texas Baptist Fontenot, Nathan 21 6.14 1.01 East Texas Baptist Collins, Colton 19 6.11 1.06 East Texas Baptist Riddick, Westin 21 5.43 1.02 East Texas Baptist Caldwell, Ahmad 14 5.00 1.31 East Texas Baptist Williams, Jayden 21 4.86 1.10 East Texas Baptist Cochran, Spencer 4 3.75 0.69 East Texas Baptist Conner, Jaden 16 2.19 0.72 East Texas Baptist Baker, Tevin 10 1.90 0.90 East Texas Baptist Owens, Jacob 10 1.80 0.73 East Texas Baptist Johnson, Nolan 6 1.33 0.67 East Texas Baptist Hunter, Cody 7 1.29 1.00 East Texas Baptist Adams, Christian 7 1.00 1.00 East Texas Baptist Bricker, Lane 1 1.00 #DIV/0! East Texas Baptist Player GP EFF PPS Team Barrett, Chris 20 16.05 0.88 Hardin-Simmons Edwards, Ricky 2 13.00 1.17 Hardin-Simmons Wooldridge, Trey 19 12.68 1.23 Hardin-Simmons Chambliss, Neal 19 11.21 1.14 Hardin-Simmons Quinn, Steven 19 10.89 0.96 Hardin-Simmons Brennon, Kyle 21 8.90 0.91 Hardin-Simmons Holdman, Keenan 20 6.80 0.78 Hardin-Simmons
- 4. Hunter, Anthony 13 4.85 1.06 Hardin-Simmons Hudson, Quinton 4 4.25 1.22 Hardin-Simmons Cobb, Chase 21 4.10 1.13 Hardin-Simmons Sharp, Layton 14 3.64 0.91 Hardin-Simmons Walsh, Aidan 18 3.22 1.31 Hardin-Simmons Roberts, Kyle 6 2.50 0.82 Hardin-Simmons Henderson, Chris 21 2.00 0.85 Hardin-Simmons Nance, Keilyn 13 1.69 0.81 Hardin-Simmons Brown, Trey 6 1.33 0.50 Hardin-Simmons Lovvorn, Justin 13 0.23 0.50 Hardin-Simmons Player GP EFF PPS Team Miguez, Jase 21 15.71 1.13 Howard Payne Thompson, Tyrell 17 10.29 0.98 Howard Payne Aguero, Timothy 4 7.00 0.78 Howard Payne Davis, Talen 21 6.76 0.74 Howard Payne Ballou, Jaylan 20 6.75 0.82 Howard Payne Cox, Luke 18 5.94 1.05 Howard Payne Kildare, Kyle 21 5.14 0.94 Howard Payne Moore, Brady 1 5.00 #DIV/0! Howard Payne Modrall, Jayden 17 4.82 0.98 Howard Payne Taylor, Joshua 21 4.81 0.67 Howard Payne Otts, Colton 10 4.00 1.09 Howard Payne Smith, Jacob 17 3.06 0.73 Howard Payne Pruitt, Eliajah 8 2.50 0.63 Howard Payne Adkins, Evan 19 2.42 1.09 Howard Payne Erskin, Brad 8 1.63 0.87 Howard Payne Jones, Javaris 18 1.39 0.76 Howard Payne Thomas, Isiah 7 1.29 0.56 Howard Payne Eisenbach, Bret 4 1.00 0.46 Howard Payne Green, Mason 10 -0.60 0.28 Howard Payne Myart, Harold 1 -1.00 0.00 Howard Payne Player GP EFF PPS Team West, Nate 21 26.14 1.03 LeTourneau Moore, Justin 21 15.19 1.02 LeTourneau Argue, John 21 14.81 1.08 LeTourneau Fosnight, Brick 14 10.14 1.14 LeTourneau Eberhardt, Andrew 21 10.00 1.02 LeTourneau Matthews, Kyle 21 6.90 1.06 LeTourneau Richardson, Warren 21 5.57 0.87 LeTourneau Taylor, Korrin 20 4.80 1.10 LeTourneau Gerber, Elijah 21 3.10 1.00 LeTourneau Beene, Garrett 16 1.63 0.96 LeTourneau Johnson, Rashard 5 1.40 0.88 LeTourneau Wilson, Kyce 13 0.85 0.76 LeTourneau Guidry, Josh 9 0.56 0.50 LeTourneau Jones, Breyden 3 0.33 0.00 LeTourneau Thelen, Paul 9 0.33 0.40 LeTourneau
- 5. Hester, Demarcus 8 0.13 1.00 LeTourneau Paulk, Tyler 1 0.00 #DIV/0! LeTourneau Player GP EFF PPS Team Baker, Kae'ron 21 19.57 1.17 Louisiana College Bilbo, KJ 21 11.76 1.09 Louisiana College Austin, Denzel 20 10.65 1.11 Louisiana College Rhone, Jaylen 19 8.74 0.98 Louisiana College Wallace, K.D. 18 7.17 0.94 Louisiana College Ames, Trey 19 6.00 0.93 Louisiana College Broussard, Keandre 14 5.43 0.85 Louisiana College Blakes, Louis 15 5.13 0.89 Louisiana College Hardy, Bailey 13 5.00 0.96 Louisiana College McGhee, Aaron 16 4.75 0.47 Louisiana College Murphy, C.J. 13 3.38 1.28 Louisiana College Calais, Donald 17 2.06 0.60 Louisiana College Longino, Desmond 5 2.00 0.25 Louisiana College Antoine, Jamal 2 1.50 1.25 Louisiana College Howe, Caleb 11 1.00 0.82 Louisiana College Dandridge, Dominic 9 0.89 1.50 Louisiana College Owusu, Jamael 4 0.50 1.33 Louisiana College Cutright, Ladarius 1 0.00 #DIV/0! Louisiana College Player GP EFF PPS Team Armour, Casey 19 20.53 1.22 Mary Hardin-Baylor Moore, Sam 21 19.57 1.04 Mary Hardin-Baylor Mitchell, Joseph 10 13.80 1.16 Mary Hardin-Baylor Hicks, Logan 21 13.67 1.03 Mary Hardin-Baylor Carter, Byrale 5 12.20 0.82 Mary Hardin-Baylor Smith, Salomon 20 10.00 1.02 Mary Hardin-Baylor Brewton, Devyn 20 6.55 0.91 Mary Hardin-Baylor Welch, Aedan 20 6.25 1.20 Mary Hardin-Baylor Everett, Pat 20 5.20 1.02 Mary Hardin-Baylor Little, Kendal 21 3.19 0.83 Mary Hardin-Baylor Pride, Jordan 9 3.00 0.77 Mary Hardin-Baylor Musa, Darius 17 2.59 0.83 Mary Hardin-Baylor Dorsey, Dreshawn 1 2.00 2.00 Mary Hardin-Baylor Roberts, William 2 1.00 0.67 Mary Hardin-Baylor Burns, Vernon 9 0.33 0.25 Mary Hardin-Baylor Stevenson, Isaiah 4 0.25 1.00 Mary Hardin-Baylor Player GP EFF PPS Team Williams Jr., Mike 19 17.79 1.11 McMurry Terry, Krishawn 21 12.86 1.16 McMurry Butler, Khalil 16 10.94 0.97 McMurry Berry Jr., Dedrick 21 10.14 1.05 McMurry Carter, Zacc 21 9.62 0.92 McMurry Taylor, Colin 16 8.63 0.83 McMurry LeBlanc, Cody 21 7.38 0.91 McMurry Sherman, Jordan 21 3.19 0.79 McMurry
- 6. Milliorn, Brad 19 2.68 0.91 McMurry Malokwu, Sherack 19 1.74 1.00 McMurry Bullock, Brandon 3 1.33 0.83 McMurry Campbell, Shaydon 19 0.95 0.59 McMurry Charles, Rob 6 0.50 1.25 McMurry Hall, Ron 3 -1.00 0.00 McMurry Player GP EFF PPS Team Davis, Jacobe 21 13.62 1.05 Ozarks (AR) Renelique, Darnel 20 12.15 1.18 Ozarks (AR) Wilhelm, Cory 21 10.33 1.33 Ozarks (AR) Winston, Cordy 21 10.10 0.97 Ozarks (AR) Bowman, Ethan 7 9.86 1.51 Ozarks (AR) Bobo, Zach 14 9.71 0.92 Ozarks (AR) Turpin, Tim 20 6.90 1.11 Ozarks (AR) Johnson, Bryson 21 6.67 0.88 Ozarks (AR) Cohns, Sean 4 3.25 0.67 Ozarks (AR) Davis, Casey 6 2.50 1.15 Ozarks (AR) Helzer, James 20 2.40 0.82 Ozarks (AR) Duke, Seth 13 1.54 0.74 Ozarks (AR) Knight, Kelvin 12 1.25 0.80 Ozarks (AR) Gipson, Lynden 2 1.00 #DIV/0! Ozarks (AR) Wheeler, Coleman 11 1.00 1.00 Ozarks (AR) Wright, Hunter 4 0.50 1.50 Ozarks (AR) Player GP EFF PPS Team Rindahl, Matthew 21 18.95 1.04 Schreiner Dehoyos, Alex 21 12.24 0.91 Schreiner Wells, Paul 19 12.16 0.99 Schreiner Pinter, Chase 19 11.11 1.21 Schreiner Miller, J'Sean 10 7.00 0.79 Schreiner Davis, Cameron 16 5.75 0.77 Schreiner Sparks, Andrew 19 5.11 1.00 Schreiner Boyce, Adam 3 5.00 0.90 Schreiner Evans, Bronson 14 4.79 1.21 Schreiner Urbina, Jordan 2 4.00 1.00 Schreiner Berry, Josh 19 3.00 0.77 Schreiner Frederick, Aries 11 2.27 0.83 Schreiner Reichert-Blume, Gabe 12 1.67 0.56 Schreiner Hurd, Corbin 11 1.64 0.95 Schreiner Sanchez, David 2 1.00 0.00 Schreiner Maina, Tim 18 0.56 0.64 Schreiner Anthony, Carl 2 0.00 #DIV/0! Schreiner Costantino, Dillon 4 0.00 0.40 Schreiner Hutchinson, Jaylen 1 0.00 #DIV/0! Schreiner Moore, Myles 5 0.00 0.00 Schreiner Lanier, Josiah 2 -0.50 0.00 Schreiner Player GP EFF PPS Team Alexander, Brandon 21 11.00 0.83 Southwestern (TX)
- 7. Howard, Kyle 21 11.00 0.92 Southwestern (TX) Garrett, Trenton 21 8.71 1.10 Southwestern (TX) Martinez, Joel 21 7.48 0.86 Southwestern (TX) Puhl, Andrew 21 7.38 0.99 Southwestern (TX) Hicks, Luke 18 6.94 0.96 Southwestern (TX) Black, Zac 21 6.90 1.00 Southwestern (TX) Poerschke, Kyle 17 5.88 0.98 Southwestern (TX) Hannah, Preston 21 5.38 1.19 Southwestern (TX) Williams, Calvin 16 3.56 0.70 Southwestern (TX) Jones, Josh 15 2.33 1.53 Southwestern (TX) McCormack, Justin 15 1.33 0.88 Southwestern (TX) Kimbell, Evan 1 1.00 #DIV/0! Southwestern (TX) Toussaint, Leo 15 0.47 0.83 Southwestern (TX) O'Neil, Jack 6 0.17 0.00 Southwestern (TX) Murphy, Mason 8 -0.25 0.50 Southwestern (TX) Player GP EFF PPS Team Licon, Tristen 21 20.86 1.19 Sul Ross St. Dixon, Logan 20 12.90 0.97 Sul Ross St. Hollis, B.J. 21 12.33 1.02 Sul Ross St. Bond, Cailen 16 11.25 1.05 Sul Ross St. Fry, Brayden 15 10.60 1.24 Sul Ross St. Griffin, Jezreel 18 8.00 1.18 Sul Ross St. Avery, Cole 18 6.72 1.20 Sul Ross St. Johnson, Aldon 12 6.00 1.02 Sul Ross St. Lopez, Jake 21 4.43 0.89 Sul Ross St. Paredes, Julian 19 3.32 1.04 Sul Ross St. Dawson, Conner 16 3.06 0.72 Sul Ross St. Gilliam, Giles 19 2.47 1.00 Sul Ross St. Morrison, Larry 10 2.40 0.67 Sul Ross St. Minix, Deveraux 1 2.00 1.00 Sul Ross St. Anderson, Aaron 6 1.33 0.56 Sul Ross St. Huey, Tyshaun 6 1.17 0.33 Sul Ross St. Perkins, Jace 5 0.80 0.83 Sul Ross St. Banks, Mikal 1 0.00 0.00 Sul Ross St. Brown, Keinen 1 0.00 #DIV/0! Sul Ross St. Edwards, Trace 1 -5.00 0.00 Sul Ross St. Player GP EFF PPS Team Lister, Caleb 21 16.48 1.04 Texas Lutheran Kite, Jorden 21 12.57 1.03 Texas Lutheran Andrade, Sebastian 21 12.48 0.80 Texas Lutheran Mason, Jamir 21 9.00 0.99 Texas Lutheran Silas, Trystin 17 5.41 1.00 Texas Lutheran Fontenot, Cameron 19 4.37 1.00 Texas Lutheran Torres, Royce 19 3.32 0.95 Texas Lutheran Sekinger, Noah 18 2.83 0.91 Texas Lutheran Wyzykowski, Andrew 14 2.14 1.04 Texas Lutheran Rodriguez, Noah 10 1.40 1.17 Texas Lutheran
- 8. Weaver, Brock 21 0.90 0.50 Texas Lutheran Green, Mason 2 0.00 #DIV/0! Texas Lutheran Watson, JT 5 -0.20 0.00 Texas Lutheran Theus, Avery 9 -0.44 0.33 Texas Lutheran Vrapcani, Andi 2 -1.00 0.00 Texas Lutheran Player GP EFF PPS Team Burwitz, Hans 21 21.05 1.16 Texas-Dallas Pruitt, Kelden 21 15.71 1.13 Texas-Dallas Weber, Jalen 21 13.86 1.01 Texas-Dallas Forster, Michael 21 13.38 1.04 Texas-Dallas Ferrell, Xavier 21 7.90 0.94 Texas-Dallas Ezekwe, Kavin 6 7.33 0.95 Texas-Dallas Soname, Simeon 7 7.29 1.73 Texas-Dallas Stevens, Hunter 21 4.71 1.01 Texas-Dallas Pruitt, Kolton 20 4.65 1.09 Texas-Dallas Gibson, Jeremiah 17 3.06 1.42 Texas-Dallas Curtis, James 8 1.38 0.60 Texas-Dallas Isaac, Will 17 1.24 0.83 Texas-Dallas Williams, Cole 6 0.83 0.50 Texas-Dallas Rainey, Josh 7 0.71 0.80 Texas-Dallas Carlson, Jeremiah 4 0.25 #DIV/0! Texas-Dallas Allen, Curtis 1 0.00 0.00 Texas-Dallas Player GP EFF PPS Team Hanley, Ben 21 14.29 1.03 Trinity (TX) Nickell, David 20 12.05 1.12 Trinity (TX) Clark, A.J. 18 10.06 0.90 Trinity (TX) Lippman, Jordan 18 10.00 0.91 Trinity (TX) Molina, Stephen 21 7.86 0.95 Trinity (TX) Williams, Jack 19 7.74 0.97 Trinity (TX) Laramore, Carter 21 6.86 0.80 Trinity (TX) Canady, Ben 21 5.19 1.02 Trinity (TX) Stuart, Luke 21 5.05 1.13 Trinity (TX) Roberts, Mason 16 3.19 1.17 Trinity (TX) Di Tullio, John-Anthony 8 2.88 0.82 Trinity (TX) Patterson, Kobe 14 1.79 0.94 Trinity (TX) White, Jalen 6 1.67 0.65 Trinity (TX) Oldham, Lucas 20 1.65 1.22 Trinity (TX)