This document contains statistical data on basketball players from various NCAA Division II teams, including their games played, efficiency, points per game, and team. It lists the player name, statistics, and team for multiple players from 18 different teams. The top performers in efficiency for each team are highlighted, such as Brian Halums of Arkansas-Fort Smith with 27.62 efficiency and 1.17 points per game.
This document contains statistics for multiple college basketball players including games played (GP), efficiency (EFF), and points per shot (PPS) for the 2021-2022 season. It includes stats for players from 15 different teams in the Lone Star Conference including Angelo State, Cameron, Dallas Baptist, Eastern New Mexico, Lubbock Christian, Midwestern State, Oklahoma Christian, St. Edward's, St. Mary's, Tarleton, Texas A&M International, Texas A&M-Commerce, Texas A&M-Kingsville, Arkansas-Fort Smith, and UT Permian Basin. The top performers in efficiency for each team are listed.
This document contains statistics for basketball players from various teams including their games played, efficiency, points per shot, and team. It shows that Andres Ibarguen of Angelo State had the highest efficiency of 19.21 over 24 games played. Wayne Stewart of Texas A&M-Commerce had the highest efficiency of 23.30 over 23 games played. Pat Dembley of UT Permian Basin had the highest efficiency of 18.93 over 30 games played.
This document contains statistical data on players from various college basketball teams, including their games played, efficiency rating, points per shot, and team. It lists players from A&M-Corpus Christi, Abilene Christian, Baylor, Houston, Houston Baptist, Lamar, North Texas, Prairie View A&M, Rice, Sam Houston State, SFA, SMU, TCU, Texas, Texas A&M, and Texas Southern. For each team, it provides the players' names, games played, efficiency rating, points per shot, and their affiliated team.
The document contains statistics for women's college basketball players from various teams, including their games played (GP), efficiency (EFF), and points per second (PPS). The players are from teams such as A&M-Corpus Christi, Abilene Christian, Baylor, Houston, Houston Baptist, Lamar, North Texas, Prairie View A&M, Rice, Sam Houston State, SFA, SMU, TCU, Texas, Texas A&M, and Texas Southern. Bryant, Alexes of A&M-Corpus Christi led the team with 22 games played, 16.14 efficiency, and 1.02 points per second.
The document displays statistical data for multiple college basketball players organized by their team. It includes each player's games played (GP), efficiency rating (EFF), and points per shot (PPS). The players are grouped together under their respective college teams including Austin College, Belhaven, Centenary (LA), Colorado College, Concordia (TX), Dallas, East Texas Baptist, Hardin-Simmons, Howard Payne, LeTourneau, Louisiana College, and Mary Hardin-Baylor.
This document contains statistics for women's basketball players from various teams, including Angelo State, Arkansas-Fort Smith, Cameron, Eastern New Mexico, Lubbock Christian, Midwestern State, Oklahoma Christian, St. Edward's, St. Mary's (TX), Tarleton, Texas A&M International, Texas A&M-Commerce, Texas A&M-Kingsville, Texas Permian Basin, and others. The statistics provided are games played (GP), efficiency (EFF), and points per shot (PPS) for each player.
The document contains statistics for women's college basketball players from various teams, including their games played, efficiency, points per shot, and team. It lists the players, their stats, and the team they play for across multiple teams in the conference.
This document contains statistical data on college basketball players from various teams, including their games played, efficiency rating, points per shot, and team. It lists players from A&M-Corpus Christi, Abilene Christian, Baylor, Houston, Houston Baptist, Lamar, North Texas, Prairie View A&M, Rice, Sam Houston State, SFA, SMU, TCU, Texas, Texas A&M, and Texas Southern. For each team, it provides the players' names, games played, efficiency rating, points per shot, and their affiliated team.
The document contains statistical data on player efficiency and points per shot for various college basketball teams, including Austin College, Belhaven, Centenary (LA), Colorado College, Concordia (TX), Dallas, East Texas Baptist, Hardin-Simmons, Howard Payne, LeTourneau, Louisiana College, and Mary Hardin-Baylor. It lists each player's name, number of games played, efficiency rating, and points per shot. The statistics are grouped by team.
This document contains statistics for women's basketball players from various NCAA Division III teams, including their games played (GP), efficiency (EFF), and points per game (PPS). The players are grouped by team and some teams have multiple players listed.
This document contains statistics for women's basketball players from various NCAA Division III teams, including their games played (GP), efficiency (EFF), and points per second (PPS). It lists each player's stats individually grouped by their team. The teams represented include Austin College, Belhaven University, Centenary College of Louisiana, Colorado College, Concordia University Texas, Dallas Baptist University, East Texas Baptist University, Hardin-Simmons University, Howard Payne University, Johnson & Wales University Denver, LeTourneau University, Louisiana College, and Mary Hardin-Baylor University.
This document contains statistics for basketball players from 14 different teams, including their games played (GP), efficiency (EFF), and points per second (PPS). The player with the highest efficiency for each team is listed, with Michael Holland of Austin College having the highest efficiency of 21.96 across 25 games played.
The document provides statistics on women's basketball players from various NCAA Division II teams in Texas, including their games played, efficiency, points per game, and team. It lists the top performers in efficiency from several teams, including De'Anira Moore of Angelo State with an efficiency of 18.86 and Maddi Chitsey of Lubbock Christian with an efficiency of 16.58.
Angelo State Golf (UCO/RBC Bank Classic Final Results)AngeloStateSports
Central Oklahoma won the UCO Classic women's golf tournament with a total score of 571 (+3), followed by Oklahoma Christian University in second place at 590 (+22). Daniela Martinez of Central Oklahoma had the lowest individual score of 138 (-4) to finish first. The tournament was held from October 6-7, 2014 at Lincoln Park East Golf Course in Oklahoma City, Oklahoma.
Campionato nazionale sci 2017 - Classifica slalom gigante femminileGiuliano Ganassi
1) Beatrice Lottici of Sci Club Free Mountain won the women's race in a time of 1:04.22.
2) Andrea Desire' Grassi of Sci Club Valle di Scalve finished second, 0.31 seconds behind.
3) Nicole Albertinelli of Sci Club Valle di Scalve finished third, 1.41 seconds behind the winner.
Campionato nazionale sci 2017 - Classifica slalom gigante babyGiuliano Ganassi
1. A ski race was held on March 17th, 2017 at Passo San Pellegrino on the CAMPIGOL course with 30 gates.
2. The results are provided for several categories including Super Baby Female, Super Baby Male, Baby Female, and Baby Male. Elisa Marie Gandelli of Sci Club Spiazzi won the Super Baby Female category.
3. Davide Andrigo of Sci Club Valbiois won the Baby Male category with a time of 30.03.
Campionato italiano sci 2017 - Classifiche slalom gigante maschileGiuliano Ganassi
This document contains the results of a ski race held on March 17, 2017 at Passo San Pellegrino. It lists the placement, time, and club of each competitor organized by age group: Ragazzi, Allievi, and Juniores. The top qualifier for the Trofeo RUNNERS in each group is also indicated in bold. There were a total of 35 competitors in the Ragazzi group, 41 in the Allievi, and 15 in the Juniores.
The document provides results from a cross country race held on September 4, 2015. It includes overall finish lists for college men and women competitors, listing their placement, name, team, time, and pace. It also includes a team summary showing the top five finishers and times for several of the competing men's college teams. Texas-Tyler finished first in the men's college division with 48 total points. Their top five finishers and times are listed.
This document summarizes the results of several swimming events that were part of the Peruvian Swim Federation Championships from October 8-10, 2014. It provides the names and times of the top finishers in each event, including the men's and women's 100m and 200m freestyle, men's and women's 200m breaststroke, women's 50m butterfly, and several other events. The document also includes records and qualifying times for comparison.
This document summarizes the results of a cross country invitational held on September 4th, 2015 in Texas. Texas-Tyler won both the women's and men's team competitions. Brittany Brunson of Texas-Tyler finished first in the women's 3.1 mile run with a time of 20:40.6. Leonard Kiprono of Wiley finished first in the men's 3.1 mile run with a time of 16:25.
The NCAA West Regional Spring Preview provides results from a two-day, 19-team college golf tournament. Barry won the team competition with a total score of 608, followed by West Texas A&M and Newman. Individually, Maria Paola Fiorio of Barry won with a score of 150, while Francesca Perini and Brianna Areia tied for second with 151. The tournament was held at Foxtail GC in Rohnert Park, CA from April 6-7, 2015 with 95 women golfers competing across 19 teams.
This document provides results from the Lone Star Conference Indoor Championship track meet held in Lubbock, TX on February 28-March 1, 2015. It lists the top finishers in various women's track events including the 55m dash, 200m dash, 400m dash, 800m run, mile run, 3000m run, 55m hurdles, 4x400m relay, and distance medley relay. It also includes the top height in the women's high jump. Kaina Martinez of Texas A&M-Kingsville won the 55m dash and 200m dash. Amber Perry of Texas A&M-Kingsville won the 400m dash.
RESULTADOS DE I FECHA BOLIVARIANOS TRUJILLO 2013Judith Chuquipul
This document summarizes the results of swimming competitions at the 17th Bolivarian Games held in Trujillo, Peru from November 17-20, 2013. It provides results for men's and women's 50m butterfly, men's 800m freestyle, women's 400m freestyle, men's 200m backstroke, and women's 100m breaststroke events, including rankings, times, ages, and countries of participating swimmers.
This document summarizes the results of track and field events at the 2015 National Primary School Competition held from September 6th to November 6th. It lists the top finishers and their times in several 150m, 300m, and 600m running events for boys and girls aged 11-12 from different Mexican states. The events included 150m and 300m races for both boys and girls in the 2004 and 2003 age groups, as well as a 600m race for girls in the 2003 age group.
This document contains results from various track and field events at the 2015 National Primary School Competition held from September 6th to November 6th. The results include event names, participant names, ages, teams, seeding times, final times, and wind readings. Over 30 events are listed with multiple heats of girls and boys competing in sprinting events ranging from 60 meters to 75 meters for various age groups from primary school.
This document contains the results of track and field competitions for primary school students in Mexico. It lists the top finishers in various running and jumping events separated by gender and age group. Times, distances, and placements are provided for preliminary and final heats in events like the 60m dash, 75m dash, and long jump. The document provides details of two multi-day meets organized by Mexico's Ministry of Education and held at the CODE Sports Complex in Revolucion.
Kamron Daftari is a freshman defensive back from Agoura High School in Agoura Hills, CA. He has a jersey number of #42, weighs 165 lbs, and has a shuttle time of 4.33 seconds. His bench press max is 200 lbs. Academically, he has a 3.85 GPA and is preparing to take the SAT in May and ACT in April. He was voted most relentless and is part of the leadership committee for his high school football team.
This document contains 3 lists of names organized in order. The names include first and last names as well as scores represented by letters A, B, and M. There are 42 names listed in the first section, 41 in the second, and 32 in the third for a total of 115 names across the 3 sections.
The document contains statistical data on college basketball players from various teams, including their games played, efficiency rating, points per shot, and team. It lists multiple players from teams like A&M-Corpus Christi, Abilene Christian, Baylor, Houston, Houston Baptist, Lamar, North Texas, Prairie View A&M, Rice, Sam Houston State, SFA, SMU, TCU, Texas, Texas A&M, and Texas Southern.
This document contains statistical data on college basketball players from various teams in the Southland Conference including their games played, efficiency, points per shot, and team. It lists multiple players for each team with their statistics. The highest rated players include Ian DuBose of Houston Baptist with 18.56 efficiency and T.J. Atwood of Lamar with 16.82 efficiency.
This document contains statistics for women's basketball players from various teams, including Angelo State, Arkansas-Fort Smith, Cameron, Eastern New Mexico, Lubbock Christian, Midwestern State, Oklahoma Christian, St. Edward's, St. Mary's (Texas), Tarleton, Texas A&M International, Texas A&M-Commerce, Texas A&M-Kingsville, Texas Permian Basin, and others. The statistics provided are games played (GP), efficiency (EFF), and points per shot (PPS) for each player.
This document contains statistics for women's basketball players from various NCAA Division III teams, including their games played (GP), efficiency (EFF), and points per game (PPS). The players are grouped by team. Ally Longaker of Austin had the highest efficiency of 21.00 over 21 games played. Katey Guzman of JWU (Denver) was the most efficient player with 11.69 efficiency over 16 games. Allaira Jones of Mary Hardin-Baylor led her team with 15.10 efficiency and 1.00 points per game across 21 games played.
The document contains statistics for women's college basketball players from various teams, including their games played, efficiency, points per shot, and team. It lists the players, their stats, and their respective teams, which include schools like Texas A&M, Baylor, Houston, North Texas, and others.
American Southwest Conference Championship (Men's 2015)UTTylerPatriots
Matthew Markert of Texas-Tyler won the men's race at the 2015 ASC XC Championship with a time of 27:36.00. Conner Benson and Taber Miyauchi of Texas-Tyler finished second and third, respectively. Texas-Tyler won the team competition with five runners finishing in the top 13 places and a combined time of 2 hours, 21 minutes and 52 seconds. LeTourneau finished second in the team competition. The results provided the finishing places, times and teams for 79 male runners who competed in the championship cross country race.
This document summarizes the results of the men's 200 meter dash event at the 2017 Lone Star Conference Indoor Championships hosted at the High Altitude Training Center from February 18-19, 2017. It lists the top qualifying times from each preliminary heat, with Steven Cooper of West Texas A&M advancing first in 21.73 seconds. A total of 31 athletes competed across 7 heats, with the top 8 advancing to the finals based on time. Meet records and qualifying standards for regionals and nationals are also provided for reference.
This document summarizes the preliminary results of the men's 200 meter dash event at the 2016 Lone Star Conference Track & Field Championships held from May 5-7, 2016 at Oscar Frazier Track. In the preliminaries, Luis Perez of Angelo State University finished first with a time of 21.16 seconds. A total of 26 athletes across 4 heats competed in the preliminaries to qualify for the finals. The top 8 finishers in each heat along with the next 8 fastest times advanced to the finals of the men's 200 meter dash.
East Texas Prairie Dog Classic - Men's ResultsUTTylerPatriots
The document reports results from a track and field meet hosted by UT Tyler at Grace Community School. Quinton Bryson of UT Tyler won the men's 1,500 meters race. Eddier Shoots of Jarvis Christian took first in the men's 300 meter hurdles. Jarvis Christian also won the men's 4x400 meter relay. Texas College finished first in the men's 4x100 meter relay.
The document summarizes the results of the men's 200 meter dash event at the 2017 Lone Star Conference Indoor Championships hosted at the Adams State University High Altitude Training Center. Marcus Parker of Eastern New Mexico won the event with a time of 21.46 seconds. Steven Cooper of West Texas A&M finished second followed by Kenneth Turner of Angelo State in third. Texas A&M-Commerce led the team rankings after 15 events with 186 points, followed by Texas A&M-Kingsville in second and Angelo State in third.
2014 varsity football roster (updated 8 22-14)sandersr2
This document contains the 2014 varsity football roster for Chester High School. It lists the players' numbers, names, positions, heights, weights, and years. It also lists the coaching staff, administration, and team physician. There are over 80 players listed on the roster across various offensive and defensive positions.
The document shows statistics for various baseball teams including their BABIP, OPS, runs created, strikeout percentage, walk percentage, and how each team compares to the average. It displays these statistics for 18 different college baseball teams in the American Southwest Conference. The average BABIP was 0.335, average OPS was 0.803, and average runs created was 36.
This document contains statistics for 20 college baseball teams, including their batting average on balls in play (BABIP), on-base plus slugging percentage (OPS), runs created (RC), strikeout percentage (K%), and walk percentage (BB%). On average, teams had a 0.342 BABIP, 0.795 OPS, scored 42 runs, and struck out 18.5% of batters while walking 10.9%. The table provides a statistical overview of several seasons' worth of performance metrics for various NCAA Division III baseball programs.
The document shows statistics for 16 college baseball teams including their BABIP, OPS, runs created, strikeout percentage, walk percentage and how each team compares to the average. It finds that on average teams had a BABIP of 0.335, OPS of 0.820, scored 70 runs and had a strikeout percentage of 14.4% and walk percentage of 9.2%. Individual team stats varied compared to these averages.
The document shows statistics for 14 college baseball teams, including their BABIP, OPS, runs created, strikeout percentage, walk percentage, and how each team compares to average. On average, teams had a 0.338 BABIP, 0.779 OPS, scored 65 runs, and had strikeout and walk percentages of 21.8% and 12.5%, respectively.
The document contains statistics for various baseball teams including BABIP, OPS, RC, K%, BB%, and league averages. It shows each team's performance in these categories compared to the league average. Some notable teams include Texas A&M with significantly higher than average OPS, RC, and K%; TCU with much higher than average OPS and RC; and Texas Southern with far above average RC. The averages listed at the bottom provide an overall view of performance across the league.
The document contains statistics for various baseball teams including BABIP, OPS, RC, K%, BB%, and compares the team stats to league averages. It shows the team statistics and rankings for batting average on balls in play (BABIP), on-base plus slugging percentage (OPS), runs created (RC), strikeout percentage (K%), and walk percentage (BB%). The averages for all teams are also included at the bottom.
The document displays statistics for various NCAA Division III men's basketball teams across multiple performance metrics including field goal percentage, turnover percentage, offensive rebounding percentage, and points scored and allowed per possession. On average, teams shot 41.9% from the field, committed turnovers on 20.8% of possessions, secured offensive rebounds on 34% of missed shots, and scored 0.854 points while allowing 0.869 points per possession.
The document displays statistical data for various NCAA Division II men's basketball teams across multiple metrics like field goal percentage, turnovers, offensive and defensive rebounding percentages, and points scored and allowed per 100 possessions. The teams covered include schools from Texas and surrounding states. Overall averages are provided at the bottom.
This document contains statistics for 18 NCAA Division II men's basketball teams, including their free throw rate (FT%), effective field goal percentage (EFG%), turnover rate (TO%), offensive rebound percentage (OREB%), and offensive and defensive efficiency ratings (OPPP and DPPP). On average, teams had a free throw rate of 0.365, effective field goal percentage of 51.3%, turnover rate of 16.6%, offensive rebounding percentage of 33.3%, and offensive and defensive efficiency ratings near 1.036 and 1.019 respectively.
This document contains statistics for various basketball teams in the FTR, EFG%, TO%, OREB%, OPPP, and DPPP categories, including averages. The teams include various universities from Texas and surrounding areas like Baylor, Houston, Rice, Texas, Texas A&M and others.
This document contains statistics for basketball teams in the American Athletic Conference including effective field goal percentage, turnover percentage, offensive and defensive rebounding percentages, and offensive and defensive efficiency ratings. The statistics are averaged across all teams and include individual stats for each school.
The document shows offensive statistics for XFL teams in 2020, including offensive points per play, yards per play, yards per point, and defensive yards allowed per play and per point. The Houston Roughnecks had the highest offensive points per play while the Tampa Bay Vipers scored the most points per game. Defensively, the Dallas Renegades allowed the fewest yards per play and per point.
This document contains statistics for various college baseball teams, including their batting average on balls in play (BABIP), on-base plus slugging percentage (OPS), runs created (RC), strikeout percentage (K%), and walk percentage (BB%). It lists these stats for individual teams as well as averages across all teams. On average, teams had a 0.329 BABIP, 0.790 OPS, scored 170 runs, struck out 10.5% of the time, and walked 7.9% of the time.
This document contains statistics for various baseball teams, including batting average on balls in play (BABIP), on-base plus slugging percentage (OPS), runs created (RC), strikeout percentage (K%), and walk percentage (BB%). It shows each team's stats as well as league averages. Overall, the averages show a BABIP of 0.336, OPS of 0.790, RC of 27, K% of 18.8%, and BB% of 10.7%.
This document contains statistics for 16 college baseball teams, including their BABIP, OPS, runs created, strikeout percentage, walk percentage, and how each statistic compares to the average. On average, teams had a BABIP of 0.337, OPS of 0.806, scored 55 runs, and had strikeout and walk percentages of 14.8% and 9.3% respectively. Oklahoma Christian had the highest OPS at 1.068 while scoring 108 runs and allowing the fewest strikeouts at 9.2%.
This document contains statistics for 14 baseball teams including their BABIP, OPS, runs created, strikeout percentage, walk percentage, and how each team compares to the league average. On average, teams had a 0.337 BABIP, 0.771 OPS, scored 47 runs, had a 22.0% strikeout percentage and 12.5% walk percentage.
The document contains statistics for various baseball teams including BABIP, OPS, RC, K%, BB%, and compares each team's stats to the league average. It shows Texas has the highest OPS and RC above average while Lamar University is below average in many stats including BABIP, OPS, and RC. The averages listed at the bottom provide an overall comparison point for the stats.
The document contains statistics for various college baseball teams, including batting average on balls in play (BABIP), on-base plus slugging percentage (OPS), runs created (RC), strikeout percentage (K%), and walk percentage (BB%). It shows each team's stats compared to the average of their opponents (denoted with an "o"). Some notable teams include Texas Tech, which has the highest OPS, RC, and BABIP above average, and Houston Baptist, which has the highest OPSo and RCo above average. The averages for all teams are provided at the bottom.
Gabriel Kalembo A Rising Star in the World of Football Coachinggabrielkalembous
Gabriel Kalembo is a player's coach who connects with his teams on a deep level. With a strong background in sports science and a passion for the game, Kalembo has developed a unique coaching philosophy that emphasizes player development and tactical flexibility. His ability to connect with players and create a positive team culture has led to success at every level he has coached.
Understanding Golf Simulator Equipment A Beginner's Guide.pdfMy Garage Golf
Dive into golf simulation with our beginner's guide, perfect for anyone new to the concept. Understand the critical components like sturdy frames, high-quality impact screens, and side netting that ensure your safety and enrich your practice sessions. Learn the benefits of proper projector mounts and compatibility with your existing setup. This guide helps you make informed choices, transforming your home into a realistic and effective golfing practice environment.
For More Information-: https://mygaragegolf.com/shop
Match By Match Detailed Schedule Of The ICC Men's T20 World Cup 2024.pdfmouthhunt5
20 Teams, One Trophy: What to Expect from the ICC Men's T20 World Cup 2024
The ICC Men's T20 World Cup 2024 is set to be an exciting event, co-hosted by the West Indies and the USA from June 1 to June 29, 2024. This edition of the tournament will feature a record 20 teams divided into four groups, competing across 55 matches for the prestigious title.
Belgium vs Romania Ultimate Guide to Euro Cup 2024 Tactics, Ticketing, and Qu...Eticketing.co
Euro Cup 2024 fans worldwide can book Belgium vs Romania Tickets from our online platform www.eticketing.co. Fans can book Euro Cup Germany Tickets on our website at discounted prices.
Georgia vs Portugal Georgia UEFA Euro 2024 Squad Khvicha Kvaratskhelia Leads ...Eticketing.co
UEFA Euro 2024 fans worldwide can book Georgia vs Portugal Tickets from our online platform www.eticketing.co. Fans can book Euro Cup Germany Tickets on our website at discounted prices.
Netherlands vs Austria Netherlands Face Familiar Foes in Euro Cup Germany Gro...Eticketing.co
The Netherlands are in Group D in Euro Cup Germany - and, unpaid to this, they will be coming up against familiar foes. Remarkably, they have played France, who have fashioned some of the greatest players of all time, 30 times throughout history. Despite France being more effective in major competitions, including captivating the World Cup in 2018, Holland have the greater head-to-head record.
We offer Euro Cup Tickets to admirers who can get Netherlands vs Austria Tickets through our trusted online ticketing marketplace. Eticketing.co is the most reliable source for booking Euro Cup Final Tickets. Sign up for the latest Euro Cup Germany Ticket alert.
UEFA Euro 2024 Tickets | Euro 2024 Tickets | Netherlands vs Austria Tickets
However, in 2023, they played one another twice, with France endearing both matches 4-0 and 2-1 individually. Against Poland and Austria, the Netherlands also have a stout record, winning just under half the matches. They faced Austria at Euro 2020, engaging 2-0, and they haven't lost to Poland since 1979.
The lettering is on the wall for Holland to qualify for the knockouts, but nothing is failsafe. The Netherlands kickstart their Euros campaign against Poland on Sunday, June 16th. In Hamburg, they will have to go up against one of the best strikers in the world, Robert Lewandowski.
Netherlands vs Austria: Tough Challenges Await the Netherlands in Euro Cup Germany
Five days later, they travel south to face France in Leipzig, a side led by Kylian Mbappe - one of the finest players in the world currently and one of the most impressive players in his nation's history. To conclude, they face Austria in Berlin, knowing it could be the end of the road if they don't perform.
Ronald Koeman is widely considered one of the more successful Dutch managers in Premier League history, considering the nation has a reputation for struggling to replicate their talents in England. The former Everton manager went against that script and shone — and now he is back managing his nation.
UEFA Euro 2024 Tickets | Euro 2024 Tickets | Euro Cup Germany Tickets | Netherlands vs Austria Tickets
Euro fans worldwide can book Euro Cup Germany Tickets from our online platform, www.eticketing.co. Fans can book Euro Cup 2024 Tickets on our website at discounted prices.
Netherlands vs Austria: Ronald Koeman's Tactical Approach For UEFA Euro 2024
As well as being the highest-scoring defender in history, Koeman is a man with immense tactical knowledge. He returned to manage Holland at the start of 2023 after it was announced Louis van Gaal would retire. His life back in the dugout with the team wasn't easy, as he lost his first match 4-0 to France after going 3-0 down within 21 minutes.
However, he eventually helped them qualify for Euro Cup Germany. The 61-year-old likes to organize his team with a defensive mindset. Some might call it pragmatic as he defends with minimal space between the lines, but that's often needed for international football.
Croatia vs Italy Modric's Last Dance Croatia's UEFA Euro 2024 Journey and Ita...Eticketing.co
UEFA Euro 2024 fans worldwide can book Croatia vs Italy Tickets from our online platform www.eticketing.co. Fans can book Euro Cup Germany Tickets on our website at discounted prices.
Hesan Soufi's Legacy: Inspiring the Next GenerationHesan Soufi
Hesan Soufi's impact on the game extends far beyond his on-field exploits. With his humility, sportsmanship, and unwavering commitment to excellence, Soufi has become a role model for aspiring footballers worldwide. His legacy lies not only in his achievements but also in the inspiration he provides to the next generation of talented players.
Italy vs Albania Soul and sacrifice' are the keys to success for Albania at E...Eticketing.co
We offer UEFA Euro 2024 Tickets to admirers who can get Italy vs Albania Tickets through our trusted online ticketing marketplace. Eticketing. co is the most reliable source for booking Euro Cup Final Tickets. Sign up for the latest Euro Cup Germany Ticket alert.
Belgium vs Romania Injuries and Patience in Belgium’s Euro Cup Germany Squad....Eticketing.co
Belgium coach Domenico Tedesco will wait for several key players to recover from injury. Even if it means they miss the opening Euro Cup Germany stages of the European Championship in Germany this month. Veteran defender Jan Vertonghen, midfielder Youri Tielemans and defender Arthur. Theate are being given time to play in the tournament because they are considered vital to Belgium’s cause, Tedesco said on Tuesday.
We offer Euro Cup Tickets to admirers who can get Belgium vs Romania Tickets through our trusted online ticketing marketplace. Eticketing.co is the most reliable source for booking Euro Cup Final Tickets. Sign up for the latest Euro Cup Germany Ticket alert.
UEFA Euro 2024 Tickets | Euro 2024 Tickets | Euro Cup Germany Tickets | Belgium vs Romania Tickets
"Of course, you prefer to take players who are fully fit, but that's okay. We want to wait and be patient for some players even if they cannot play in those first matches," he told a press conference. The 37-year-old Vertonghen, Belgium’s Euro Cup 2024 most-capped international with 154 appearances, is struggling to shake off a groin injury.
"He will be there normally. This also applies to Youri Tielemans and Arthur Theate. The latter's position is very sensitive. We don't have many choices at left back. "It will only change if it turns out that they will only be available when, say, the final of the Euro 2024 Championship comes around. That's too long to wait. "However, I am confident that the injured boys are on track for the Euros.
Belgium vs Romania: Radu Dragusin Prepares for Crucial Role in Euro Cup Germany
Some of them have taken not one but two steps forward in their rehabilitation," he said. None of the injured players will feature in this week’s warm-up friendlies against Montenegro and Luxembourg. Romania centre-back Radu Dragusin found chances limited at Tottenham Hotspur in the second half of the 2023-24 season.
But is crucial to his country's cause at UEFA Euro 2024 where his aerial ability, physicality and hard graft make him a standout player. The 22-year-old moved to North London from Italian side Genoa in January but was kept on the sidelines by the form of another new arrival for the season, Mickey van de Ven, something Romania coach Edward Iordanescu admitted was a concern.
It will mean limited game-time going into the finals, but Dragusin, who cites Netherlands defender Virgil van Dijk as a role model, started every Euro Cup Germany qualifier as Romania went through the campaign unbeaten in their 10 games. He will be among their most important players in their first game in Germany against Ukraine in Munich on June 17, taking the right centre-back role in what is likely to be a back four.
UEFA Euro 2024 Tickets | Euro 2024 Tickets | Euro Cup Germany Tickets | Belgium vs Romania Tickets
Euro fans worldwide can book Euro Cup Germany Tickets from our online platform, www.eticketing.co. Fans can book Euro Cup 2024 Tickets on our website at discounted prices.
Boletin de la I Copa Panamericana de Voleibol Femenino U17 Guatemala 2024Judith Chuquipul
holaesungusto.- Boletín final de la I Copa Panamericana de Voleibol Femenino U17 - Ciudad de Guatemala 2024 que se realizó del 27 de mayo al 01 de julio, en el Domo Polideportivo Zona 13.
Fuente: norceca.net
Turkey vs Georgia Tickets: Turkey's Provisional Squad for UEFA Euro 2024, Key...Eticketing.co
Euro Cup Germany fans worldwide can book Euro 2024 Tickets from our online platform www.eticketing.co.Fans can book Euro Cup 2024 Tickets on our website at discounted prices.
Spain vs Croatia Spain aims to put aside the RFEF crisis as they chase Euro C...Eticketing.co
We offer UEFA Euro 2024 Tickets to admirers who can get Spain vs Croatia Tickets through our trusted online ticketing marketplace. Eticketing. co is the most reliable source for booking Euro Cup Final Tickets. Sign up for the latest Euro Cup Germany Ticket alert.
Luciano Spalletti Leads Italy's Transition at UEFA Euro 2024.docxEuro Cup 2024 Tickets
Italy are the defending European champs, but after Luciano Spalletti swapped Roberto Mancini last September, they are still taking the cautious first steps of a new era
Spain vs Croatia Euro 2024 Spain's Chance to Shine on the International Stage...Eticketing.co
Euro 2024 fans worldwide can book Spain vs Croatia Tickets from our online platform www.eticketing.co. Fans can book Euro Cup Germany Tickets on our website at discounted prices.
Spain vs Croatia Euro 2024 Spain's Chance to Shine on the International Stage...
D2 mbb per
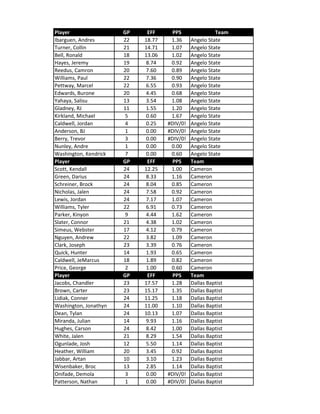
1. Player GP EFF PPS Team
Ibarguen, Andres 22 18.77 1.36 Angelo State
Turner, Collin 21 14.71 1.07 Angelo State
Bell, Ronald 18 13.06 1.02 Angelo State
Hayes, Jeremy 19 8.74 0.92 Angelo State
Reedus, Camron 20 7.60 0.89 Angelo State
Williams, Paul 22 7.36 0.90 Angelo State
Pettway, Marcel 22 6.55 0.93 Angelo State
Edwards, Burone 20 4.45 0.68 Angelo State
Yahaya, Salisu 13 3.54 1.08 Angelo State
Gladney, RJ 11 1.55 1.20 Angelo State
Kirkland, Michael 5 0.60 1.67 Angelo State
Caldwell, Jordan 4 0.25 #DIV/0! Angelo State
Anderson, BJ 1 0.00 #DIV/0! Angelo State
Berry, Trevor 3 0.00 #DIV/0! Angelo State
Nunley, Andre 1 0.00 0.00 Angelo State
Washington, Kendrick 7 0.00 0.60 Angelo State
Player GP EFF PPS Team
Scott, Kendall 24 12.25 1.00 Cameron
Green, Darius 24 8.33 1.16 Cameron
Schreiner, Brock 24 8.04 0.85 Cameron
Nicholas, Jalen 24 7.58 0.92 Cameron
Lewis, Jordan 24 7.17 1.07 Cameron
Williams, Tyler 22 6.91 0.73 Cameron
Parker, Kinyon 9 4.44 1.62 Cameron
Slater, Connor 21 4.38 1.02 Cameron
Simeus, Webster 17 4.12 0.79 Cameron
Nguyen, Andrew 22 3.82 1.09 Cameron
Clark, Joseph 23 3.39 0.76 Cameron
Quick, Hunter 14 1.93 0.65 Cameron
Caldwell, JeMarcus 18 1.89 0.82 Cameron
Price, George 2 1.00 0.60 Cameron
Player GP EFF PPS Team
Jacobs, Chandler 23 17.57 1.28 Dallas Baptist
Brown, Carter 23 15.17 1.35 Dallas Baptist
Lidiak, Conner 24 11.25 1.18 Dallas Baptist
Washington, Jonathyn 24 11.00 1.10 Dallas Baptist
Dean, Tylan 24 10.13 1.07 Dallas Baptist
Miranda, Julian 14 9.93 1.16 Dallas Baptist
Hughes, Carson 24 8.42 1.00 Dallas Baptist
White, Jalen 21 8.29 1.54 Dallas Baptist
Ogunlade, Josh 12 5.50 1.14 Dallas Baptist
Heather, William 20 3.45 0.92 Dallas Baptist
Jabbar, Artan 10 3.10 1.23 Dallas Baptist
Wisenbaker, Broc 13 2.85 1.14 Dallas Baptist
Onifade, Demola 3 0.00 #DIV/0! Dallas Baptist
Patterson, Nathan 1 0.00 #DIV/0! Dallas Baptist
2. Player GP EFF PPS Team
Pullum, Devin 23 9.83 1.07 Eastern New Mexico
Serrano, Jose 23 9.78 1.06 Eastern New Mexico
Meadows, Brandon 23 8.30 1.17 Eastern New Mexico
Cobas, Yosnier 22 8.09 1.06 Eastern New Mexico
Kuany , Deng 23 6.52 0.80 Eastern New Mexico
Murphy, Isaiah 23 6.17 0.93 Eastern New Mexico
Zaid, Ibn 23 5.78 1.10 Eastern New Mexico
Sherrod, Garrick 23 5.65 0.92 Eastern New Mexico
Mapaga, Marvin 11 5.18 0.94 Eastern New Mexico
Mazique, Mathew 23 4.83 0.97 Eastern New Mexico
Sawyer, Darius 23 4.74 1.14 Eastern New Mexico
Jongkor, Mangistu 2 0.50 0.67 Eastern New Mexico
Carter, Tanner 1 0.00 #DIV/0! Eastern New Mexico
Matheus, Nicolas 7 -0.43 0.23 Eastern New Mexico
Player GP EFF PPS Team
Daniels, Lloyd 23 16.43 1.21 Lubbock Christian
Caswell, Ty 23 14.17 1.30 Lubbock Christian
Hicks, Parker 23 13.30 1.10 Lubbock Christian
Copley, Cameron 23 12.65 1.05 Lubbock Christian
Thompson, Kobe 7 11.86 1.07 Lubbock Christian
Proctor, Rashaan 22 9.14 0.96 Lubbock Christian
Muhammad, Aamer 23 7.00 0.86 Lubbock Christian
Crisler, Silas 23 4.09 0.98 Lubbock Christian
McDowell, Cade 6 2.67 1.27 Lubbock Christian
Davey, Joshua 10 2.40 1.11 Lubbock Christian
Stepp, Zach 14 1.86 1.08 Lubbock Christian
Mackenzie, Rowan 1 0.00 #DIV/0! Lubbock Christian
Player GP EFF PPS Team
Harris, D'monta 24 14.92 1.15 Midwestern State
Thompson, Darius 20 13.90 1.05 Midwestern State
Brown, Jalin 22 11.59 1.02 Midwestern State
Lee, Elijah 19 8.79 0.95 Midwestern State
Ayodele, Ola 21 7.81 1.18 Midwestern State
Jones, Trae 24 6.54 1.03 Midwestern State
Rivera, Reggie 22 5.32 1.04 Midwestern State
McCarthy, Evan 21 5.10 1.02 Midwestern State
Herrick, Derrick 22 2.86 0.90 Midwestern State
Mosley, Daniel 20 2.40 0.85 Midwestern State
Dusek, Drake 14 2.07 1.33 Midwestern State
Weger, John 18 2.06 0.77 Midwestern State
Barnes, Kadevon 5 1.60 1.00 Midwestern State
Davis II, Ben 7 0.86 0.71 Midwestern State
Carter, Sheldon 2 -0.50 0.00 Midwestern State
Player GP EFF PPS Team
Lienhard, Will 19 16.63 1.13 Oklahoma Christian
Parmer Jr., Dedrian 22 14.77 1.00 Oklahoma Christian
3. Johnson, Aubrey 22 10.32 1.09 Oklahoma Christian
Blackwell, Marcus 22 7.86 0.82 Oklahoma Christian
Johnson, Anthony 11 7.45 0.89 Oklahoma Christian
Reyes, Johnatan 22 6.50 0.84 Oklahoma Christian
Walter, D.J. 22 4.23 0.97 Oklahoma Christian
Benjamin, York 22 2.18 0.83 Oklahoma Christian
Staten, Hunter 16 1.38 1.09 Oklahoma Christian
Martin, Harrison 2 1.00 2.00 Oklahoma Christian
Johnson, Conner 19 0.63 0.79 Oklahoma Christian
Bagwell, James 10 0.40 0.60 Oklahoma Christian
Gregg, Robert 2 -0.50 #DIV/0! Oklahoma Christian
Glover, Travis 7 -0.57 0.00 Oklahoma Christian
Player GP EFF PPS Team
Spears, Ashton 25 17.60 1.20 St. Edward's
Lopez, Dorian 25 16.60 1.16 St. Edward's
Krafka, Jake 24 14.38 1.31 St. Edward's
Haas, August 25 14.36 1.10 St. Edward's
Shervill, Corey 25 11.00 1.12 St. Edward's
Doria, Lucas 25 9.72 1.46 St. Edward's
Garza, Ryan 25 8.28 1.26 St. Edward's
Cook, Logan 12 4.67 0.92 St. Edward's
Pluymen, Luke 24 4.63 0.93 St. Edward's
Phillips, Sean 20 3.10 0.78 St. Edward's
Robinson, Justin 2 0.50 0.50 St. Edward's
Player GP EFF PPS Team
Magee, Kobe 25 15.04 1.09 St. Mary's
Isenhower, Dylan 24 11.21 1.14 St. Mary's
Jordan, Caleb 25 10.80 0.91 St. Mary's
Houston, Markques 24 10.54 0.89 St. Mary's
Gaspert, Matej 25 8.48 1.05 St. Mary's
Ewuzie, Emmanuel 25 7.88 1.17 St. Mary's
Traylor, Lamont 23 7.78 1.26 St. Mary's
Pena, Marco 1 7.00 2.50 St. Mary's
Wesley, Curtlon 16 5.94 1.16 St. Mary's
Presley, Jaron 25 3.40 1.01 St. Mary's
Daschner, Akiem 1 3.00 #DIV/0! St. Mary's
Keller, Zach 12 2.75 1.47 St. Mary's
Laing, Noah 22 1.09 0.85 St. Mary's
Harris, Terrell 4 0.50 0.50 St. Mary's
Benavides, Timmy 1 -1.00 0.00 St. Mary's
Player GP EFF PPS Team
Hawley, Josh 24 20.29 1.11 Tarleton
Gaffney, Clashon 24 12.71 1.29 Tarleton
Broddie, Randall 24 9.50 1.07 Tarleton
Range, Isaiah 24 8.46 1.08 Tarleton
Bethely, Devin 24 8.42 0.88 Tarleton
Naylor, Zach 24 7.83 0.96 Tarleton
5. Bradley, Jamell 20 4.80 0.93 Texas A&M-Kingsville
Majors, Jake 6 2.17 1.43 Texas A&M-Kingsville
Guerra, John 23 2.00 0.81 Texas A&M-Kingsville
Stovall, Wellington 16 1.38 0.61 Texas A&M-Kingsville
Brooks, Casey 1 -1.00 0.00 Texas A&M-Kingsville
Player GP EFF PPS Team
Halums, Brian 21 27.62 1.17 Arkansas-Fort Smith
Wilson, Matthew 24 10.46 1.01 Arkansas-Fort Smith
Botchway, Charles 24 9.25 0.90 Arkansas-Fort Smith
Rollins, Chris 24 9.17 0.96 Arkansas-Fort Smith
Morgan, Matt 24 5.75 1.21 Arkansas-Fort Smith
Anderson, Evan 24 5.25 0.96 Arkansas-Fort Smith
Sivins, Matiss 16 3.44 1.21 Arkansas-Fort Smith
Hawley, Seth 18 3.00 1.09 Arkansas-Fort Smith
Boyer, Braden 21 2.57 1.47 Arkansas-Fort Smith
McElrath , Daryl 19 0.84 0.75 Arkansas-Fort Smith
Ekezie, David 9 0.44 0.67 Arkansas-Fort Smith
Smith, Major 4 -0.25 0.00 Arkansas-Fort Smith
Player GP EFF PPS Team
Dembley, Pat 28 19.46 1.13 UT Permian Basin
Newsome, Carson 21 13.71 1.12 UT Permian Basin
Horn, Jordan 7 12.86 1.18 UT Permian Basin
Washington, Miles 26 12.38 1.17 UT Permian Basin
Carlisle, Donoven 27 11.89 1.19 UT Permian Basin
Rivera, Adam 28 10.86 1.14 UT Permian Basin
Rodriguez, Elvin 28 7.29 1.08 UT Permian Basin
Hernandez, Isaac 11 4.82 1.10 UT Permian Basin
Anderson, Malik 27 4.74 1.26 UT Permian Basin
Jones, Fermandez 28 4.64 1.04 UT Permian Basin
Sanoe, Minfeke 5 4.60 1.11 UT Permian Basin
Deravine, Brandon 18 4.28 1.30 UT Permian Basin
Kieke, Ethan 16 1.13 1.27 UT Permian Basin
Danielson, Cale 7 0.71 1.50 UT Permian Basin
Lee, Deaunte 12 0.25 0.62 UT Permian Basin
Tabor, Preston 1 0.00 #DIV/0! UT Permian Basin
Player GP EFF PPS Team
Glover, Ty 23 14.65 1.01 UT Tyler
Fuller, Micah 21 11.52 0.97 UT Tyler
Davis, Jerekius 8 9.00 0.87 UT Tyler
Sesay, Ansu 18 7.44 1.20 UT Tyler
Smith, Quinn 10 7.10 1.37 UT Tyler
Alford, Darius 23 6.83 1.05 UT Tyler
Bennett, Ty 4 6.75 0.92 UT Tyler
Wyche, Da'Zhon 7 6.57 0.67 UT Tyler
Power, Bryson 23 5.04 1.11 UT Tyler
Jenkins, Jared 19 5.00 0.88 UT Tyler
Giles, Chris 18 4.94 0.84 UT Tyler
6. Riddick, JT 12 4.67 1.10 UT Tyler
Mason, Bradley 22 4.05 0.91 UT Tyler
Fogle, Xavier 21 2.19 0.78 UT Tyler
Mohamed, Omar 18 1.67 0.63 UT Tyler
Brown, Tevin 8 -0.38 0.00 UT Tyler
Player GP EFF PPS Team
Grant, Qua 26 21.35 1.07 West Texas A&M
Murray, Joel 26 18.77 1.10 West Texas A&M
Geddis, Derrick 26 12.31 1.27 West Texas A&M
Fugett, Jon'il 26 10.96 0.97 West Texas A&M
Mosley, Eric 26 9.46 1.16 West Texas A&M
Brown, John 26 7.81 1.19 West Texas A&M
Toussaint, Zach 24 7.21 1.26 West Texas A&M
Collins, Jordan 26 5.38 1.02 West Texas A&M
Blankley, Hayden 19 3.53 1.25 West Texas A&M
Booker, Kavon 19 2.16 1.03 West Texas A&M
Warren, JT 25 1.88 0.98 West Texas A&M
Gerber, Jake 19 1.53 1.05 West Texas A&M
Bryant, Ty 13 0.77 0.58 West Texas A&M
Johnson, Marshal 7 0.43 1.33 West Texas A&M
Bell, Cameron 1 0.00 #DIV/0! West Texas A&M
Player GP EFF PPS Team
Holifield, Elijah 25 12.76 1.13 Western New Mexico
Sanders , Malik 22 10.36 0.92 Western New Mexico
Simon , Rodney 24 9.50 1.09 Western New Mexico
Vanbeekum, CJ 25 8.76 0.96 Western New Mexico
Cash, Amarion 19 7.84 1.02 Western New Mexico
Giron, Eddie 25 7.32 1.02 Western New Mexico
McDougal , Michael 2 6.50 0.64 Western New Mexico
Leonard , Andrew 25 6.00 0.98 Western New Mexico
Avalos , Tony 24 5.92 0.97 Western New Mexico
Hohenstein, Ian 19 4.21 1.23 Western New Mexico
Pelissier, Nathan 20 3.20 0.79 Western New Mexico
Dunnell , Cyree 2 3.00 0.81 Western New Mexico
Mosialos, George 13 1.46 1.24 Western New Mexico
Rodriguez, Alfredo 9 0.22 0.00 Western New Mexico
Moore , Tristin 1 0.00 #DIV/0! Western New Mexico
Barnes , Rajan 2 -1.50 0.53 Western New Mexico