Download to read offline


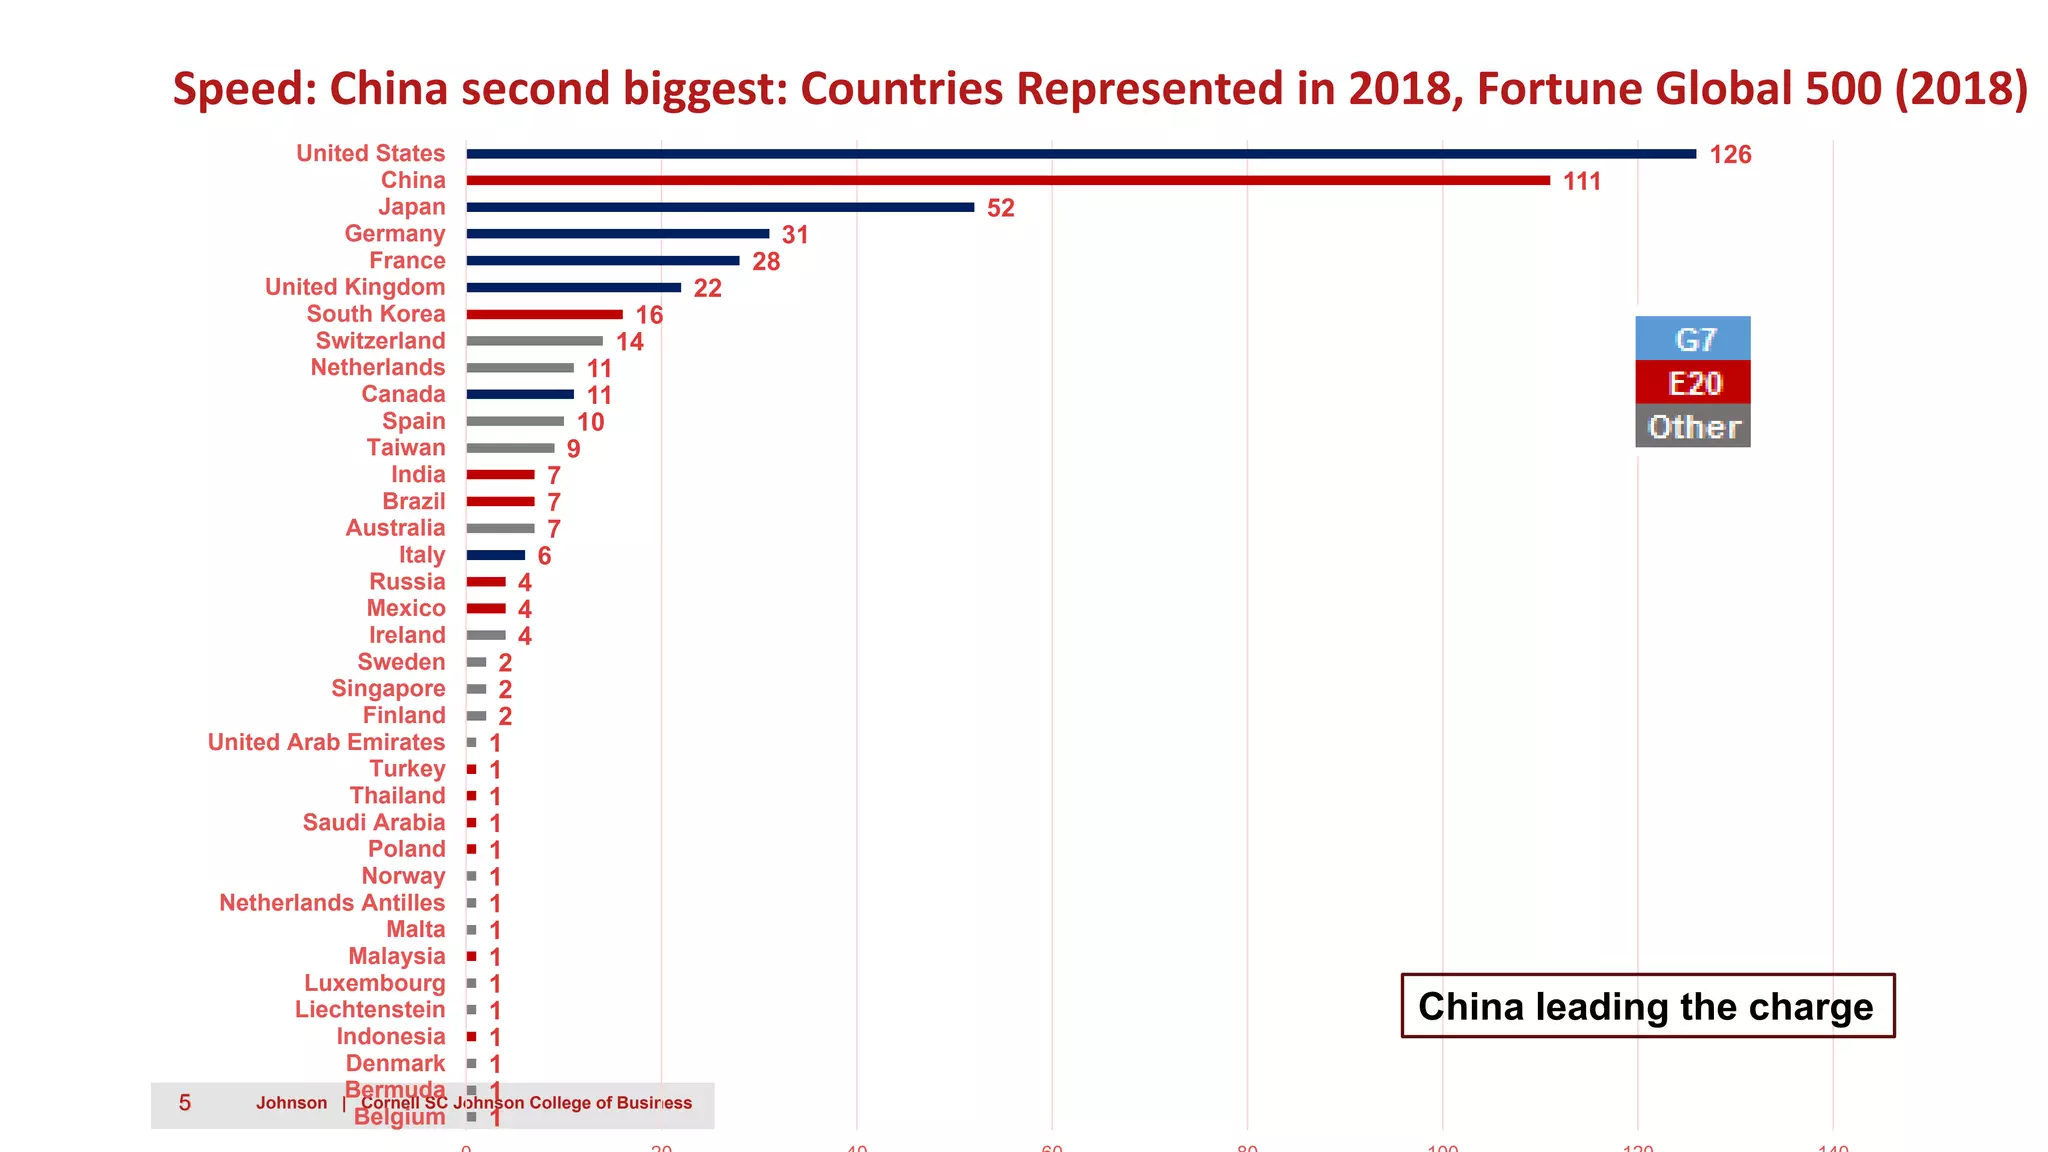
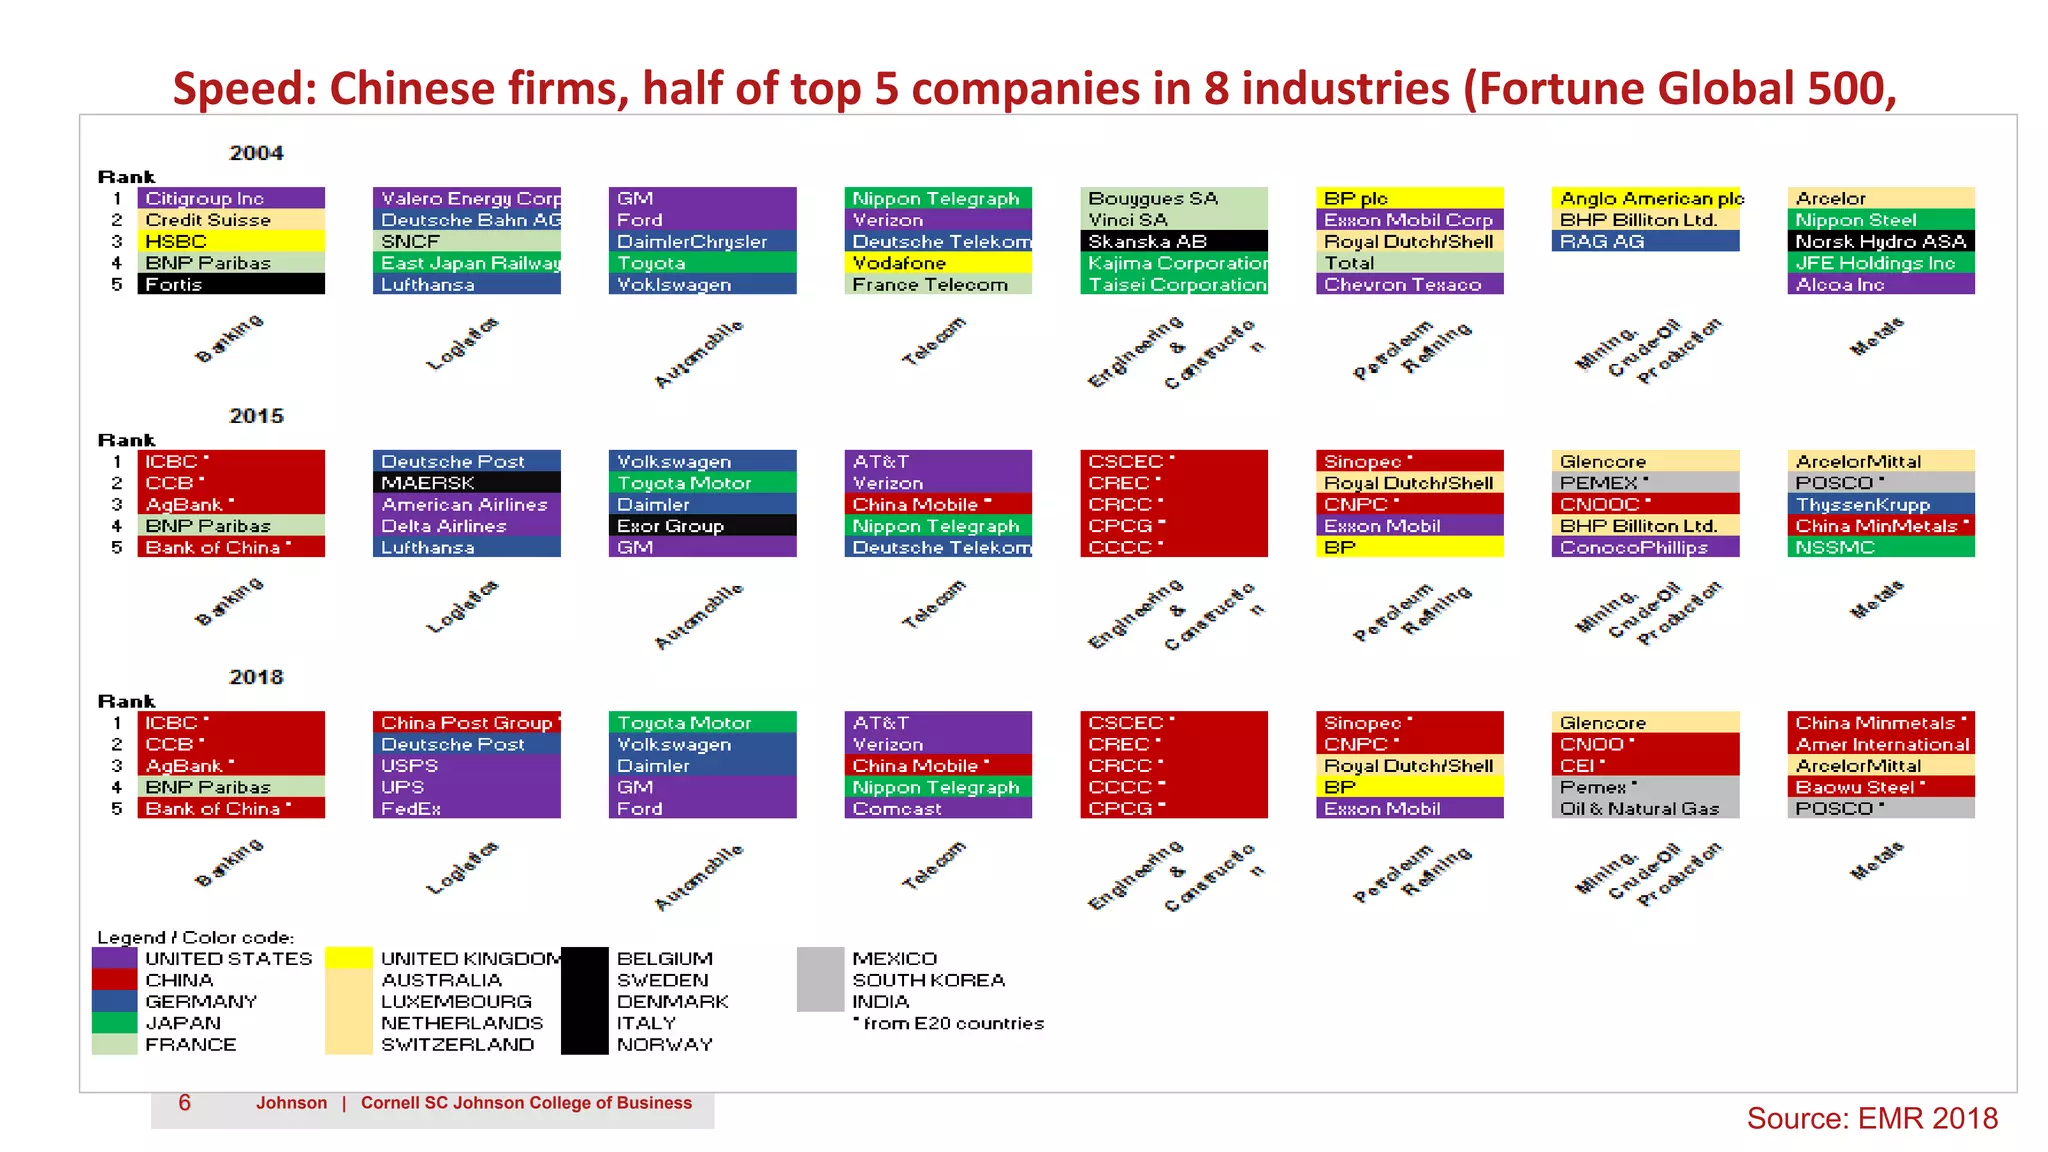
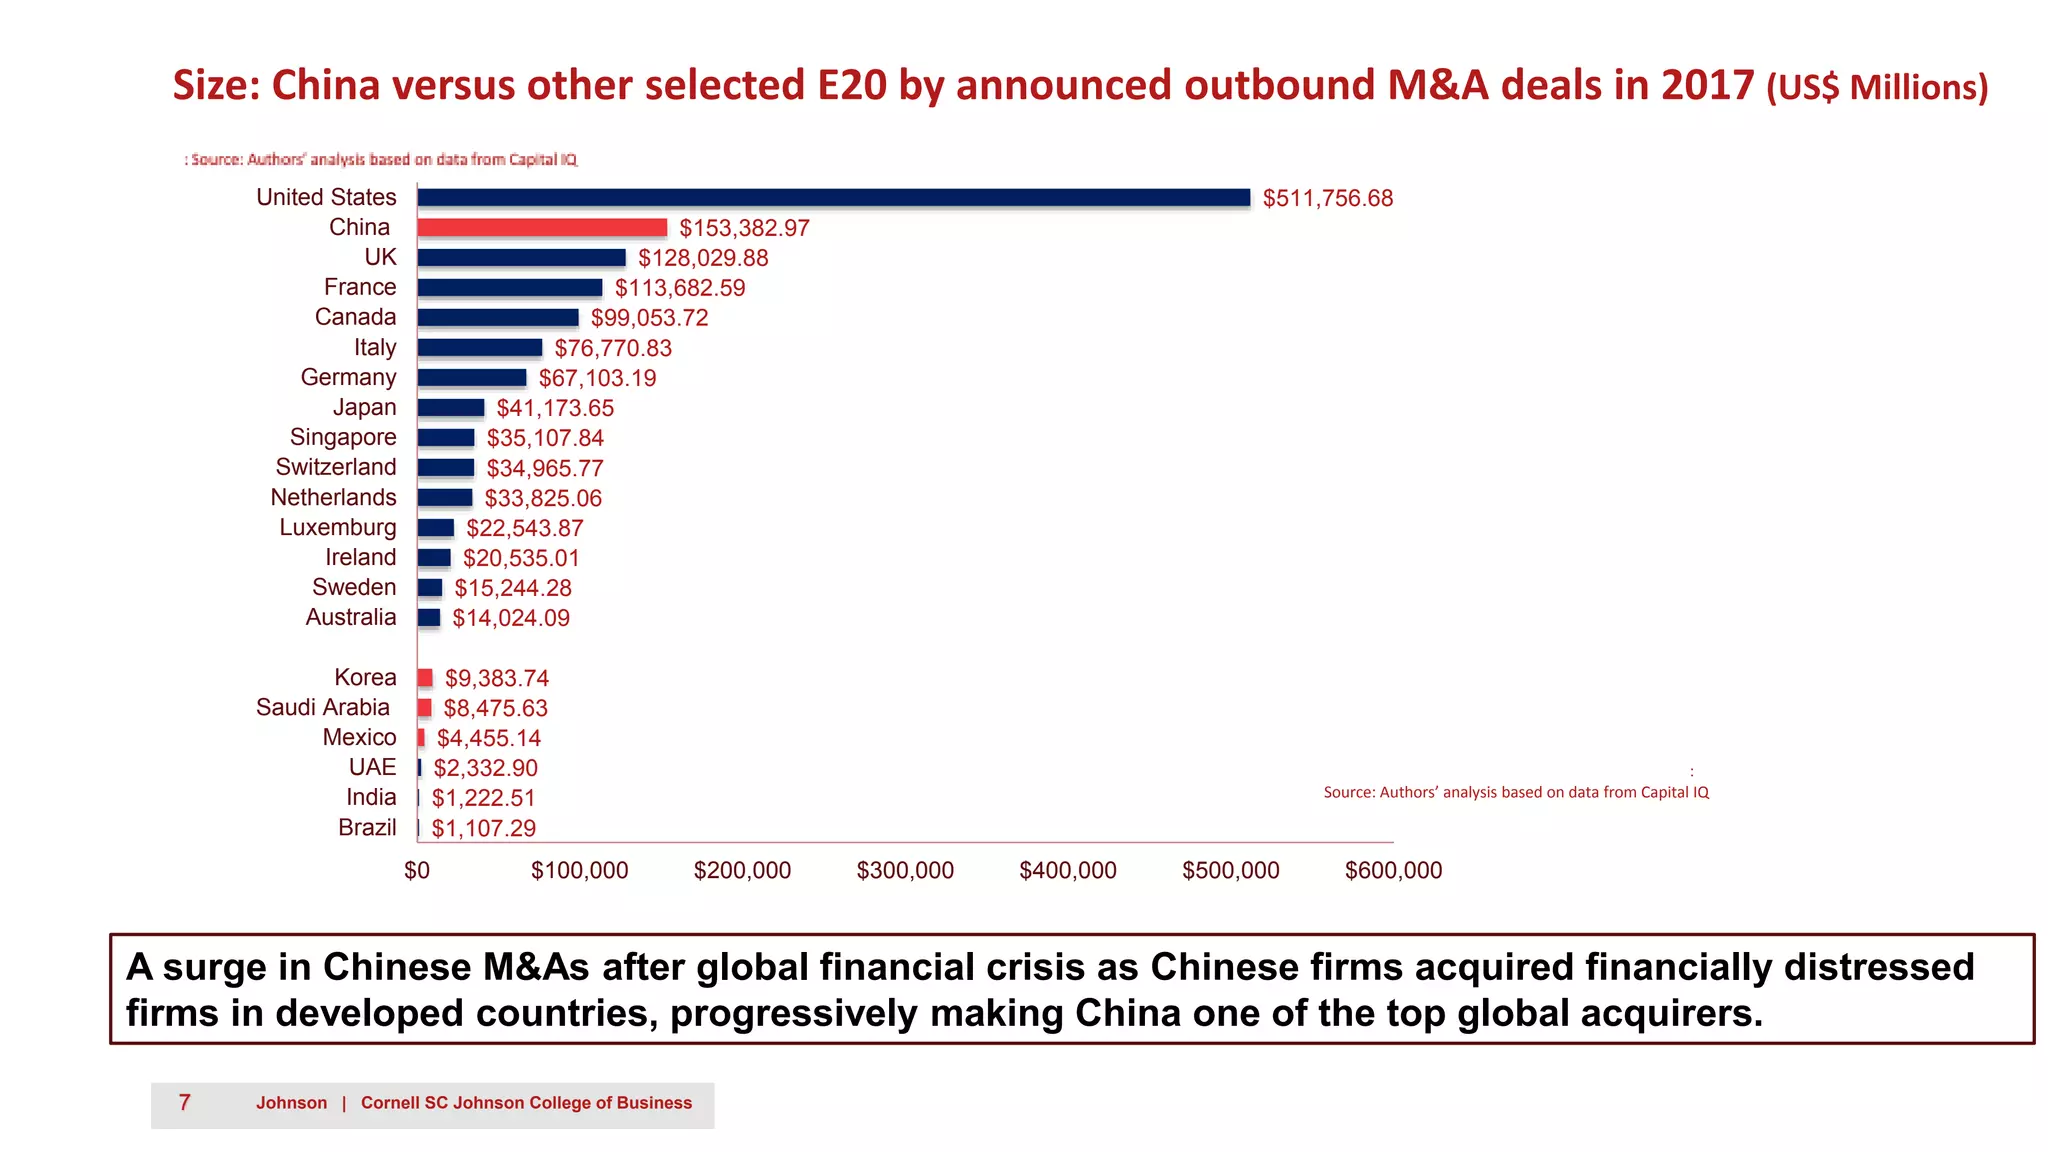
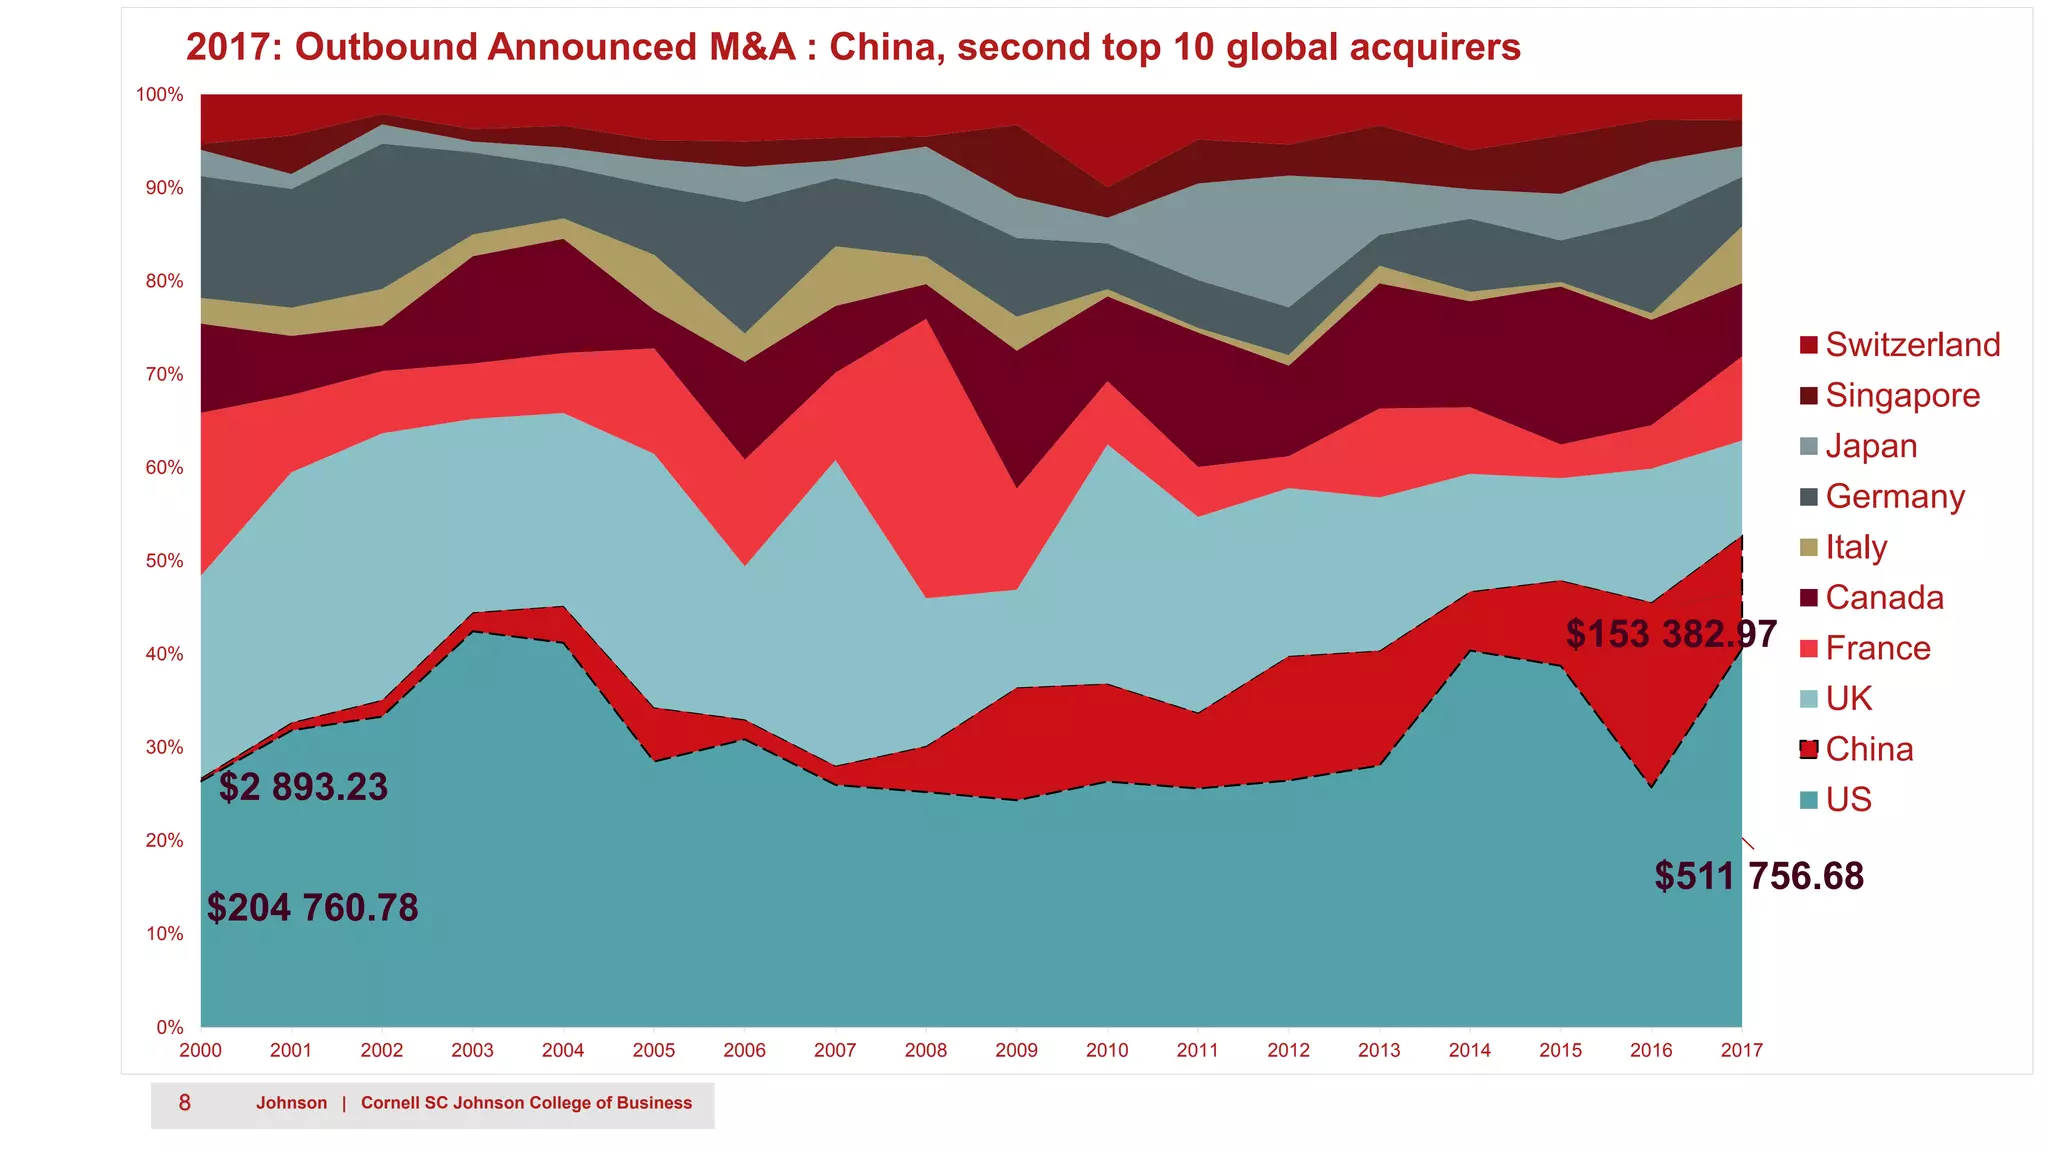


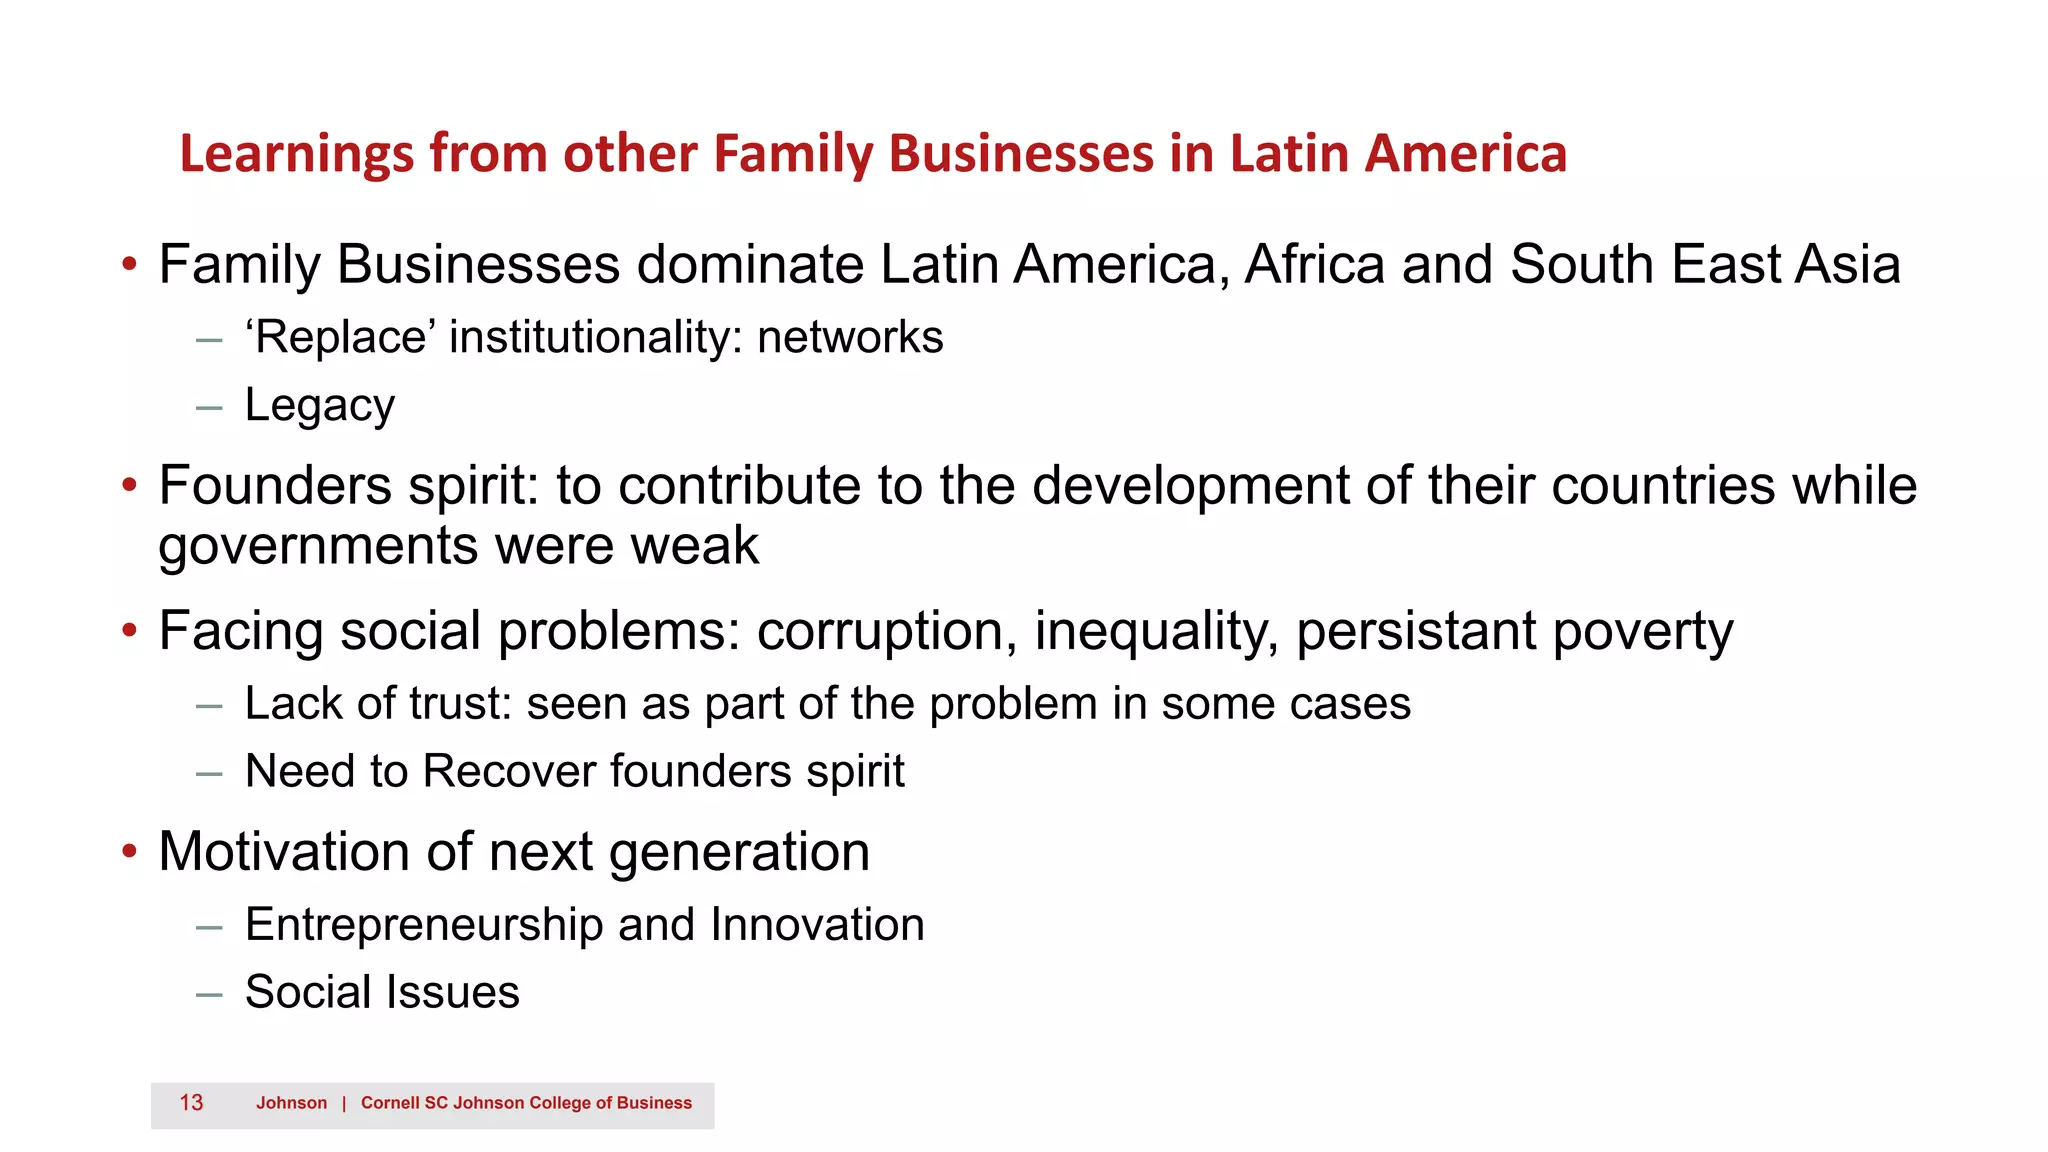


This document summarizes key findings from the Emerging Markets Institute's 2018 yearly report on emerging multinationals, with a focus on Chinese companies. It notes that Chinese representation in the Fortune Global 500 has grown significantly, with Chinese firms now accounting for 30% of the list compared to only 7% in 2005. Chinese firms also make up half of the top 5 companies in 8 industries. The document also discusses China's increasing size and speed in outbound M&A deals and greenfield investments since the global financial crisis, as well as opportunities and challenges facing family businesses in China.


