
Recommended
Recommended
More Related Content
Similar to CT CLSA - Sri Lanka Monthly Report - January 2023.pdf
Similar to CT CLSA - Sri Lanka Monthly Report - January 2023.pdf (20)
Recently uploaded
Recently uploaded (20)
CT CLSA - Sri Lanka Monthly Report - January 2023.pdf
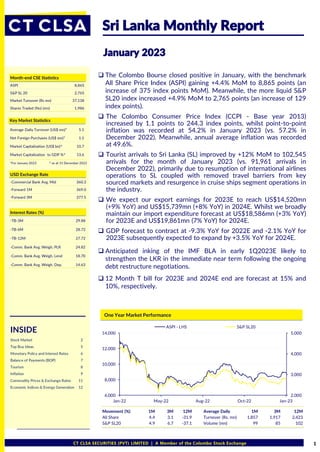
- 1. CT CLSA SECURITIES (PVT) LIMITED | A Member of the Colombo Stock Exchange 1 ❑ The Colombo Bourse closed positive in January, with the benchmark All Share Price Index (ASPI) gaining +4.4% MoM to 8,865 points (an increase of 375 index points MoM). Meanwhile, the more liquid S&P SL20 index increased +4.9% MoM to 2,765 points (an increase of 129 index points). ❑ The Colombo Consumer Price Index (CCPI - Base year 2013) increased by 1.1 points to 244.3 index points, whilst point-to-point inflation was recorded at 54.2% in January 2023 (vs. 57.2% in December 2022). Meanwhile, annual average inflation was recorded at 49.6%. ❑ Tourist arrivals to Sri Lanka (SL) improved by +12% MoM to 102,545 arrivals for the month of January 2023 (vs. 91,961 arrivals in December 2022), primarily due to resumption of international airlines operations to SL coupled with removed travel barriers from key sourced markets and resurgence in cruise ships segment operations in the industry. ❑ We expect our export earnings for 2023E to reach US$14,520mn (+9% YoY) and US$15,739mn (+8% YoY) in 2024E. Whilst we broadly maintain our import expenditure forecast at US$18,586mn (+3% YoY) for 2023E and US$19,861mn (7% YoY) for 2024E. ❑ GDP forecast to contract at -9.3% YoY for 2022E and -2.1% YoY for 2023E subsequently expected to expand by +3.5% YoY for 2024E. ❑ Anticipated inking of the IMF BLA in early 1Q2023E likely to strengthen the LKR in the immediate near term following the ongoing debt restructure negotiations. ❑ 12 Month T bill for 2023E and 2024E end are forecast at 15% and 10%, respectively. January 2023 INSIDE Stock Market 2 Top Buy Ideas 5 Monetary Policy and Interest Rates 6 Balance of Payments (BOP) 7 Tourism 8 Inflation 9 Commodity Prices & Exchange Rates 11 Economic Indices & Energy Generation 12 Sri Lanka Monthly Report Month-end CSE Statistics ASPI 8,865 S&P SL 20 2,765 Market Turnover (Rs mn) 37,138 Shares Traded (No) (mn) 1,986 USD Exchange Rate -Commercial Bank Avg. Mid 360.3 -Forward 1M 369.0 -Forward 3M 377.5 Interest Rates (%) -TB-3M 29.88 -TB-6M 28.72 -TB-12M 27.72 -Comm. Bank Avg. Weigh. PLR 24.82 -Comm. Bank Avg. Weigh. Lend 18.70 -Comm. Bank Avg. Weigh. Dep. 14.63 One Year Market Performance Average Daily Turnover (US$ mn)* 5.1 Net Foreign Purchases (US$ mn)* 1.1 Market Capitalization (US$ bn)^ 10.7 Market Capitalization to GDP %^ 13.6 Key Market Statistics *For January 2023 ^ as at 31 December 2022 2,000 3,000 4,000 5,000 6,000 8,000 10,000 12,000 14,000 Jan-22 May-22 Aug-22 Oct-22 Jan-23 ASPI - LHS S&P SL20 Movement (%) 1M 3M 12M Average Daily 1M 3M 12M All Share 4.4 3.1 -31.9 Turnover (Rs. mn) 1,857 1,917 2,423 S&P SL20 4.9 6.7 -37.1 Volume (mn) 99 85 102
- 2. A CT HOLDINGS GROUP AND CLSA GROUP COMPANY 2 ❑ The Colombo Bourse closed positive in January, with the benchmark All Share Price Index (ASPI) gaining +4.4% MoM to 8,865 points (an increase of 375 index points MoM). Meanwhile, the more liquid S&P SL20 index increased +4.9% MoM to 2,765 points (an increase of 129 index points). ❑ Average daily turnover decreased to Rs.1,857mn in January 2023 (vs. Rs.2,387mn in December 2022). Top contributors to monthly turnover were Softlogic Capital (SCAP, Rs.6,595mn, 445mn shares), Softlogic Life Insurance (AAIC, Rs.3,435mn, 32mn shares), and Lanka IOC (LIOC, Rs.3,260mn, 16mn shares). ❑ Net foreign inflows decreased to Rs.413mn in January 2023 following a net foreign inflow of Rs.13,039mn in December 2022. ❑ During the month, net foreign buying was seen in Hemas Holdings (HHL, +Rs.289mn), John Keells Holdings (JKH, +Rs.156mn), and Browns Investments (BIL, +Rs.55mn), whilst net foreign selling was seen in Hatton National Bank (HNB, -Rs.155mn), LOLC Finance (LOFC, - Rs.103mn), and Melstacorp (MELS, -Rs.64mn). Stock Market Daily Turnover and Index Values – January 2023 Source : CSE Regional Market Performance – % MoM Source : Bloomberg Note - Share prices adjusted for capital issues (if any) Top Gainers and Losers – January 2023 Top Gainers Company Code MPS % MoM Turnover (Rs. mn) Capital Alliance CALT 32.8 +65.0 1,401.0 Softlogic Capital SCAP 15.9 +54.9 6,594.6 Softlogic Life Insurance AAIC 120.5 +42.2 3,434.9 First Capital Holdings CFVF 39.4 +37.6 1,193.5 People's Leasing & Finance PLC 6.8 +33.3 224.6 Top Losers Company Code MPS % MoM Turnover (Rs. mn) Jetwing Symphony JETS 95.0 -33.0 43.4 LOLC Development Finance NIFL 360.0 -28.0 2.1 Softlogic Finance CRL 8.7 -25.2 5.7 Industrial Asphalts (Ceylon) ASPH 0.3 -25.0 15.7 Hunters & Company HUNT 603.8 -23.2 0.4 0 500 1,000 1,500 2,000 2,500 3,000 8,200 8,300 8,400 8,500 8,600 8,700 8,800 8,900 9,000 2-Jan 3-Jan 4-Jan 5-Jan 9-Jan 10-Jan 11-Jan 12-Jan 13-Jan 17-Jan 18-Jan 19-Jan 20-Jan 23-Jan 24-Jan 25-Jan 26-Jan 27-Jan 30-Jan 31-Jan Turnover (Rs mn) ASI - LHS -5% 0% 5% 10% 15% Sri Lanka - ASI Bangladesh - DSE China - Shanghai Composite Hong Kong - HSI India - NSE Japan - TOPIX Malaysia - Bursa KLCI Mongolia - MSE Top 20 Pakistan - Karachi ASI Singapore - FTSE ASI South Korea - KOSPI Philippines - PSE Thailand - SET Vietnam - VN % MoM
- 3. CT CLSA SECURITIES (PVT) LIMITED | A Member of the Colombo Stock Exchange 3 Market Summary Stock Market Top 20 Companies by Turnover – January 2023 Top Net Foreign Purchases – January 2023 Top Net Foreign Sales – January 2023 Source – CSE, CT CLSA *Voting Shares * Market cap of non-voting share has been included 2022 2022 2022 2022 2022 2022 2022 2022 2022 2023 2023 2022 Apr May Jun Jul Aug Sep Oct Nov Dec Jan Cumulative All Share Index 7,624 8,108 7,342 7,731 9,071 9,931 8,602 8,651 8,490 8,865 8,865 13,010 ASI % Change (MoM) -14.4 6.3 -9.4 5.3 17.3 9.5 -13.4 0.6 -1.9 4.4 4.4 6.4 S&P SL20 Index 2,509 2,679 2,334 2,448 2,929 3,165 2,591 2,730 2,636 2,765 2,765 4,398 S&P SL20 % Change (MoM) -17.2 6.8 -12.9 4.9 19.6 8.1 -18.2 5.4 -3.5 4.9 4.9 3.9 Turnover (Rs mn) 17,740 32,445 24,567 20,594 82,095 95,760 39,699 32,078 47,744 37,138 37,138 154,563 Market Days 11 18 21 20 23 22 19 21 20 20 20 19 Avg. Daily T/O (Rs mn) 1,613 1,802 1,170 1,030 3,569 4,353 2,089 1,528 2,387 1,857 1,857 8,135 Foreign Purch (Rs mn) 1,341 1,403 1,460 1,661 4,503 18,346 3,267 1,823 14,112 1,621 1,621 15,332 Foreign Sales (Rs mn) 957 1,253 1,398 877 3,553 3,621 780 1,990 1,073 1,208 1,208 18,061 Net For. In / (Out) (Rs mn) 384 150 62 784 950 14,725 2,487 -167 13,039 413 413 -2,729 Foreign Activity (%) 6.5 4.1 5.8 6.2 4.9 11.5 5.1 5.9 15.9 3.8 3.8 10.8 Market P/E (X) 6.4 6.3 4.7 4.9 5.5 5.7 5.0 5.1 5.0 5.0 5.0 14.5 Dividend Yield (%) 4.0 3.8 4.6 4.3 4.0 3.6 4.1 4.0 4.1 4.1 4.1 2.1 Market PBV (X) 0.9 1.0 0.8 0.8 1.0 1.0 0.9 0.9 0.9 0.9 0.9 1.8 Market Cap (Rs bn) 3,226 3,611 3,184 3,322 3,964 4,341 3,779 3,888 3,847 3,881 3,881 5,815 Company Code Current Foreign Holding (%) Net Foreign Purchases (mn) Hemas Holdings HHL 15.5 288.8 John Keells Holdings JKH 37.1 156.1 Browns Investments BIL 0.3 55.1 Lion Brewery Ceylon LION 36.1 53.4 Tokyo Cement- Non-Vot TKYO 19.5 36.7 LB Finance LFIN 2.2 33.8 Agstar - Voting AGST 0.5 33.3 Sunshine Holdings SUN 13.7 13.9 Aitken Spence SPEN 23.5 13.8 Teejay Lanka TJL 94.4 13.3 Company Code Current Foreign Holding (%) Net Foreign Sales (mn) Hatton National Bank* HNB 13.0 155.3 LOLC Finance LOFC 13.6 103.0 Melstacorp MELS 15.5 64.2 Lanka Tiles TILE 0.47 42.2 Horana Plantations HOPL 1.3 21.7 Chevron Lubricants Lanka LLUB 62.5 18.4 hSenid Business Solutions HBS 10.9 17.8 BPPL Holdings BPPL 2.2 7.8 Galle Face Capital Partners WAPO 2.0 6.6 Royal Ceramics Lanka RCL 0.9 6.5 Company Code MPS (Rs) 31 January 2023 % MoM Turnover (Rs mn) Shares Traded (mn) As a % of Mkt T/O Softlogic Capital SCAP 15.9 54.9 6,594.6 444.7 6.9 Softlogic Life Insurance AAIC 120.5 42.2 3,434.9 32.4 3.6 Lanka IOC LIOC 206.3 1.0 3,260.4 16.2 3.4 Expolanka Holdings EXPO 185.8 1.6 1,946.2 10.5 2.0 Agstar - Voting AGST 15.0 -1.3 1,870.4 118.7 2.0 Capital Alliance CALT 32.8 65.0 1,401.0 47.6 1.5 Browns Investments BIL 6.5 -7.0 1,388.0 204.2 1.4 John Keells Holdings JKH 139.5 2.4 1,320.0 9.6 1.4 First Capital Holdings CFVF 39.4 37.6 1,193.5 33.2 1.2 LOLC Finance LOFC 6.9 -17.3 1,125.3 154.5 1.2 First Capital Treasuries FCT 25.0 6.4 820.8 31.4 0.9 Hayleys HAYL 69.9 2.8 748.7 10.5 0.8 Sampath Bank SAMP 43.5 25.0 562.0 13.9 0.6 Melstacorp MELS 53.1 11.6 551.8 11.2 0.6 LOLC Holdings LOLC 412.8 2.6 494.5 1.2 0.5 Hemas Holdings HHL 59.0 5.0 487.7 8.3 0.5 ACL Cables ACL 74.3 7.1 473.8 6.4 0.5 Taprobane Holdings TAP 11.0 9.1 465.1 38.3 0.5 Amana Bank ABL 2.9 3.5 368.8 126.8 0.4 Lankem Developments LDEV 32.6 4.5 354.0 10.7 0.4
- 4. A CT HOLDINGS GROUP AND CLSA GROUP COMPANY 4 Recent Capital Issues *To be announced ^ Closing price as at 31 Jan 2023 ^^ Issue Price Company Code Type Ratio Market Price (Rs)^ Price (Rs)^^ XR Date No. of shares to be issued (mn) Hunas Falls HUNA Sub-Division 1:150 N/A - 21-Apr-22 838.1 Nation Lanka Finance CSF Rights Issue 212 : 100 0.5 0.7 26-Aug-22 1,516.2 Abans Finance AFSL Rights Issue 3 : 28 21.5 28.0 5-Sep-22 7.1 Balangoda Plantations BALA Rights Issue 1 : 1 80.1 85.0 23-Nov-22 23.6 Jetwing Symphony JETS Rights Issue 1 : 5.02 7.0 5.0 28-Nov-22 100.0 Ceylon Cold Stores CCS Sub-division 1 : 10 37.0 N/A 5-Sep-22 855.4 Serendip Hotels SHOT.N Rights Issue 3 : 1 8.5 7.0 25-Oct-22 226.5 Serendip Hotels SHOT.X Rights Issue 3 : 1 5.3 4.0 25-Oct-22 108.0 Softlogic Finance CRL Rights Issue 100 : 423 8.7 7.3 21-Oct-22 116.5 Ceylon Hospitals CHL.N Rights Issue 1 : 16 141.8 112.5 15-Feb-23 1.6 Ceylon Hospitals CHL.X Rights Issue 1 : 16 109.5 90.0 15-Feb-23 0.5 Marawila Resorts MARA Rights Issue 2 : 3 2.2 2.0 - 152.0 Performance of Top 20 Listed Companies – January 2023 * Market cap of non-voting share has been included Company Name MPS (Rs) 31 Jan 2023 Indexed Shares (No. mn) Mkt Cap (Rs bn) Est. Free Float % Est. Free Float Adj. Mkt Cap (Rs bn) Price Movement Absolute MoM (%) Price Movement Index Rel (%) Shares Traded ('000) Expolanka Holdings 185.8 1,954.9 363.1 9.9 36.0 1.6 -2.8 10,461.9 LOLC Holdings 412.8 475.2 196.1 15.1 29.6 2.6 -1.9 1,185.1 John Keells Holdings 139.5 1,384.9 193.2 98.5 190.4 2.4 -2.0 9,594.9 LOLC Finance 6.9 19,251.3 132.8 6.6 8.8 -17.3 -21.7 154,474.3 Ceylon Tobacco Company 640.0 187.3 119.9 15.9 19.0 5.0 0.6 97.2 Sri Lanka Telecom 65.0 1,804.9 117.3 5.5 6.5 -2.2 -6.6 1,415.9 Lanka IOC 206.3 532.5 109.8 24.9 27.3 1.0 -3.4 16,227.0 Browns Investments 6.5 14,369.7 93.4 20.1 18.7 -7.0 -11.5 204,174.2 Dialog Axiata 9.4 8,247.6 77.5 16.7 12.9 10.6 6.2 12,286.2 Distilleries Co of Sri Lanka 14.4 4,600.0 66.2 3.3 2.2 7.4 3.0 1,336.1 Commercial Bank of Ceylon* 56.2 1,167.2 65.6 99.8 65.5 12.3 7.8 1,048.1 Melstacorp 53.1 1,165.4 61.9 42.9 26.5 11.6 7.2 11,238.4 Cargills (Ceylon) 229.8 257.7 59.2 20.7 12.3 -2.1 -6.6 115.3 Aitken Spence 140.0 406.0 56.8 45.7 26.0 7.7 3.3 342.6 Hayleys 69.9 750.0 52.4 37.6 19.7 2.8 -1.6 10,504.1 Carson Cumberbatch 257.0 196.4 50.5 14.4 7.3 2.6 -1.8 5.6 Nestle Lanka 930.0 53.7 50.0 9.2 4.6 1.1 -3.3 39.2 Sampath Bank 43.5 1,144.4 49.8 90.6 45.1 25.0 20.6 13,855.5 Lion Brewery Ceylon 599.5 80.0 48.0 13.9 6.7 6.6 2.2 90.7 Richard Pieris and Company 22.5 2,035.0 45.8 42.2 19.3 -7.0 -11.4 4,427.8 Stock Market 11% 30% 11% 14% 10% 15% 20% 25% 30% 35% Market Capitalization to GDP ratio (%) Source: CT CLSA, CSE, DCS Note: GDP for 4Q2022 based on current market prices was estimated based on our in-house forecast that anticipates -9% contraction.
- 5. A CT HOLDINGS GROUP AND CLSA GROUP COMPANY 5 Top Buy Ideas – 08 February 2023
- 6. A CT HOLDINGS GROUP AND CLSA GROUP COMPANY 6 Monetary Policy and Interest Rates Interest Rate Pressures Reducing – Money Market Illiquidity Declines Gradually Source: CBSL On 25 January 2023 Policy interest rates were maintained by the CBSL during its 1st monetary policy review with the Standing Deposit Facility Rate (SDFR) and the Standing Lending Facility Rate (SLFR) maintained at 14.5% and 15.5%, respectively along with Statutory Reserve Ratio (SRR) at 4% considering recent and expected developments and projections on the domestic and global macroeconomic fronts. The Board noted that the maintenance of a tight monetary policy stance is imperative to ensure that monetary conditions remain sufficiently tight to rein in inflationary pressures. Such policies, together with the tight fiscal policy, are expected to adjust inflation expectations downward, enabling the Central Bank to bring inflation rates towards the desired levels by the end of 2023, thereby restoring economic and price stability over the medium term. The deceleration in inflation is expected to continue, supported by subdued aggregate demand pressures, expected improvements in domestic supply conditions, global commodity prices, and the timely passthrough of such reductions to domestic prices. 4.00% Unchanged SDFR SLFR 14.50% Unchanged SRR 15.50% Unchanged ❑ Interest Rates likely to stabilise and reduce driven by near-term monetary policy directives. ❑ In order to control cost-push price pressures, market interest rates to be allowed to reduce in the near term. ❑ Anticipated inking of the IMF BLA in early 1Q2023E likely to strengthen the LKR in the immediate near term following the ongoing debt restructure negotiations. ❑ 12 Month T bill for 2023E and 2024E end are forecast at 15% and 10%, respectively. 0 5 10 15 20 25 30 35 0 500 1000 1500 2000 2500 BPS Change - LHS 03 February 2023 - AWPLR (%) -RHS -1000 -500 0 500 0 400 800 1,200 1,600 2,000 2,400 2,800 2/8/2017 2/8/2018 2/8/2019 2/8/2020 2/8/2021 2/8/2022 2/8/2023 CBSL Holdings T-Bill holding (Rs. bn) Excess Liquidity (Rs. bn) - RHS AWPLR Change of selected LCBs (bps) 2022-2023
- 7. CT CLSA SECURITIES (PVT) LIMITED | A Member of the Colombo Stock Exchange 7 Balance of Payments forecast for 2023E and 2024E * Outstanding payments to External Borrowers not adjusted for haircuts. ** IMF, World Bank and ADB Source: CT CLSA 2023E – US$mn -4,066 2024E – US$mn -4,122 Trade Account – Surplus/(Deficit) Item 800 900 Services 3,506 4,607 Earnings from Tourism 3,900 4,500 Workers’ Remittances -1,600 -1,600 Debt Servicing (Current) 2,540 4,285 Current Account - Net 250 500 Foreign Direct Investment 2,000 2,000 Multilateral Borrowings** -5,862 -4,916 External Payments* -3,612 -2,416 Financial Account - Net -1,072 1,869 Balance of Payments - Surplus/(Deficit) -1% 2% Balance of Payments as a % of GDP Balance of Payments
- 8. A CT HOLDINGS GROUP AND CLSA GROUP COMPANY 8 Tourism Source: SLTDA, CT CLSA Note 1: With the increased interests from key sourced markets in the near term, SL is expecting to achieve 1.9mn tourist arrivals for 2023E and 2.4mn for 2024E. Tourist arrivals to Sri Lanka (SL) improved by +12% MoM to 102,545 arrivals for the month of January 2023 (vs. 91,961 arrivals in December 2022), primarily due to resumption of international airlines operations to SL coupled with removed travel barriers from key sourced markets and resurgence in cruise ships segment operations in the industry. Tourist Arrivals to Sri Lanka (No. of persons) – Last 12 Months Tourist Arrivals (‘000) and Receipts from Tourism (US$ mn) – 2018 to 2024E Tourist Arrival Numbers for January 2023 is 102,545 Source: SLTDA Top 5 Source Markets (No. of persons) – 2018 to 2022 Source: SLTDA Near term tourism industry operations in SL is expected to grow significantly as air traffic to Sri Lanka have risen with multiple international airlines operating in Colombo. Overall, we assume the frequency levels have reached the pre-pandemic positions and expect the momentum to continue till April 2024. -60% -40% -20% 0% 20% 40% 60% 0 20,000 40,000 60,000 80,000 100,000 120,000 Feb-22 Mar-22 Apr-22 May-22 Jun-22 Jul-22 Aug-22 Sep-22 Oct-22 Nov-22 Dec-22 Jan-23 No. Tourist Arrivals YoY 0 1,000 2,000 3,000 4,000 5,000 0 500 1,000 1,500 2,000 2,500 3,000 2018 2019 2020 2021 2022 2023E 2024E Tourist Arrivals - 000's Earnings from Tourism Industry - US$ mn - RHS - 50 100 150 200 250 300 350 400 450 India UK Germany France Russia 2018 2019 2020 2021 2022
- 9. A CT HOLDINGS GROUP AND CLSA GROUP COMPANY 9 -3 -1 -8 -7 -1 -2 -8 -11 6 0 -3 -15 -10 -5 0 5 10 %MoM 26 44 53 113 42 48 25 40 28 130 56 0 25 50 75 100 125 150 175 200 %YoY Prices on some food items continued to decline MoM in January 2023; Meat and fish prices rose January 2023: MoM Price changes in select food items (%) Source : Department Of Census And Statistics, CBSL January 2023: CCPI Index Colombo Consumer Price Index (CCPI) – January 2023 Source : Department Of Census And Statistics, CBSL Overall Inflation +54.2% YoY; +0.5% MoM Food Inflation +60.1% YoY; +0.6% MoM Non-Food Inflation +51.0% YoY; +0.3% MoM December 2022: YoY Price changes in select food items (%) Source : Department Of Census And Statistics, CBSL However, some essential food prices are still up >50% YoY as of January 2023 100 120 140 160 180 200 220 240 260 244.2; +1.1 pts MoM Inflation
- 10. A CT HOLDINGS GROUP AND CLSA GROUP COMPANY 10 Bloomberg Commodity Index Source : Bloomberg Source: Department Of Census And Statistics Note: Petrol price was increased to Rs.400/litre from 01 Feb 2023 onwards. Litro Gas price was increased to Rs.4,743 per 12.5kg cylinder on 05 Feb 2023. Fuel prices are still up >100% YoY although prices have declined in recent months Type of Fuel January 2023 Price/litre (Rs.) % YoY % MoM Petrol (92 Oct) 370.0 +109.0 - Diesel 409.3 +238.3 -3.2 Kerosene 358.3 +311.9 -1.8 Gas (12.5kg Litro) 4,488.0 +67.8 -1.1 - 5.6kg Kekulu White Rice - 0.7kg Kekulu Samba White - 7.5kg Kekulu Red Rice - 0.3kg Kekulu Samba Red - 4.9kg Samba Rice - 1.1kg Nadu Red Rice - 10.6kg Nadu White Rice - 1.8kg Wheat - 3.5kg Bread - 2.3kg Mysoor Dhal - 1.7kg Chicken Average monthly household consumption on selected food items (Rs.) Source: CT CLSA *As per the national household survey of 2019 - 0.4kg Balaya Fish - 0.3kg Kelavalla Fish - 27 Coconuts - 2.6kg Big Onions - 1.3kg Milk Powder - 3.9kg Sugar Basket of goods considered (family of four) * CT CLSA: CCPI Forecast Year end CCPI Forecast (%) Forecast revision (pp) Remarks 2023 8 - • Current high YoY inflation levels are expected to reduce during 2023E primarily due to the higher base effect mainly in the second half of the year. • The easing of commodity prices in global markets is likely to continue to alleviate some inflationary pressure in 1H2023E. • Recent increases in fuel, gas and a possible increase in electricity rates could result in MoM inflation continuing over the next few months as well. 2024 6 - Source: CT CLSA Research Rs.13,685 Rs.20,416 Rs.20,108 10,000 14,000 18,000 22,000 26,000 50 75 100 125 150 Inflation
- 11. A CT HOLDINGS GROUP AND CLSA GROUP COMPANY 11 COPPER PRICES - LME 3 Month Seller – US$/MT CRUDE OIL PRICES – US$/Barrel RUBBER PRICES - TPC 1X – Rs. / Kg TEA PRICES - National Average – Rs. / Kg PALM OIL PRICES - FCPO – Spot Price MYR/MT GOLD PRICES - US$ / Ounce Commodity Prices & Exchange Rates Exchange Rates – LKR/Unit – Indexed 7000 8000 9000 10000 11000 Jan-22 Apr-22 Jul-22 Oct-22 Jan-23 60 80 100 120 140 Jan-22 Apr-22 Jul-22 Oct-22 Jan-23 WTI Crude Oil Brent Crude Oil 400 600 800 1000 1200 1400 1600 Jan-22 Apr-22 July-22 Oct-22 Jan-23 500 700 900 1,100 1,300 1,500 1,700 Jan-22 Mar-22 May-22 Aug-22 Oct-22 Jan-23 3000 4000 5000 6000 7000 8000 9000 Jan-22 Apr-22 Jul-22 Oct-22 Jan-23 1600 1700 1800 1900 2000 2100 Jan-22 Apr-22 Jul-22 Oct-22 Jan-23 90 110 130 150 170 190 210 Jan-22 Apr-22 Jul-22 Oct-22 Jan-23 EUR GBP HKD JPY SGD USD
- 12. A CT HOLDINGS GROUP AND CLSA GROUP COMPANY 12 Purchasing Manager's Index Index of Industrial Production Worker Remittances (US$ Mn) Producer Price Index Economic Indices & Energy Generation Electricity Generation (GWh) 80 90 100 110 120 Sep-21 Dec-21 Mar-22 Jun-22 Sep-22 35 40 45 50 55 60 65 70 Mar-21 Oct-21 May-22 Dec-22 Manufacturing PMI Services PMI 200 300 400 500 600 700 2021 2022 100.0 140.0 180.0 220.0 260.0 Nov 21 Feb-22 May-22 Aug-22 Nov-22 0 100 200 300 400 500 600 700 800 Nov-21 Dec-21 Jan-22 Feb-22 Mar-22 Apr-22 May-22 Jun-22 Jul-22 Aug-22 Sep-22 Oct-22 Nov-22 Hydro Coal Fuel Oil Wind
- 13. CT CLSA SECURITIES (PVT) LIMITED | A Member of the Colombo Stock Exchange 13 CT CLSA SECURITIES (PVT) LTD A Member of the Colombo Stock Exchange 4-14 Majestic City, 10 Station Road, Colombo 4, Sri Lanka General: +94 11 255 2290 to 2294 Facsimile: +94 11 255 2289 Email: info@ctclsa.lk Web: www.ctclsa.lk A CT HOLDINGS GROUP AND CLSA GROUP COMPANY Disclaimer: This document has been prepared and issued by CT CLSA Securities (Pvt) Ltd. on the basis of publicly available information, internally developed data and other sources, believed to be reliable. Whilst all reasonable care has been taken to ensure that the facts stated are accurate and the opinions given are fair and reasonable, neither CT CLSA Securities (Pvt) Ltd. nor any director, officer or employee, shall in any way be responsible for the contents. CT CLSA Securities (Pvt) Ltd. may act as a Broker in the investments which are the subject of this document or in related investments and may have acted upon or used the information contained in this document, or the research or analysis on which it is based, before its publication. CT CLSA Securities (Pvt) Ltd., its directors, officers or employees may also have a position or be otherwise interested in the investments referred to in this document. This is not an offer to buy or sell the investments referred to in this document. It is not intended to provide professional, investment or any other type of advice or recommendation and does not take into account the particular investment objectives, financial situation or needs of individual recipients. Before acting on any information in this publication/communication, you should consider whether it is suitable for your particular circumstances and, if appropriate, seek your own professional advice, including tax advice. The markets in which CT CLSA Securities (Pvt) Ltd. operates may not have regulation governing conflict of interest over preparation and publication of research reports (including but not limited to disclosure of perceived or actual conflict of interest) as may be found in more developed markets. Please contact your investment advisor / analyst should you require further information over the relevant regulation and particular disclosure over perceived or actual conflict of interest. Contact Information Trading & Sales Lasantha Iddamalgoda lasantha@ctclsa.lk +94 11 255 2295 +94 77 778 2103 Dyan Morris dyan@ctclsa.lk +94 11 255 2320 +94 77 722 4951 Nithila Talgaswatte nithila@ctclsa.lk +94 77 340 4386 Dhammika de Silva dhammika@ctclsa.lk +94 77 356 2699 Arusha Michael arusha@ctclsa.lk +94 77 395 6765 Nuwan Madusanka nuwan@ctclsa.lk +94 76 858 9722 Ryan Jansz ryan@ctclsa.lk +94 77 547 9233 Rajitha Weerakoon rajitha@ctclsa.lk +94 77 320 4939 Anther Adrian anther@ctclsa.lk +94 77 775 8377 Research Oshadha de Vas Gunasekara oshadha@ctclsa.lk +94 74 253 3364 Deshan Hettiwatte deshan@ctclsa.lk +94 11 255 2290 Stephenson Fernando stephenson@ctclsa.lk +94 11 255 2290 Kugaprasath Thilagaratnam kugaprasath@ctclsa.lk +94 11 255 2290 Kasun Herath kasun@ctclsa.lk +94 11 255 2290 Consultant / Sales Rohan Fernando rohan@ctclsa.lk +94 11 255 2297 +94 76 778 2101