Download to read offline


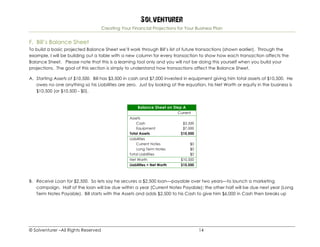
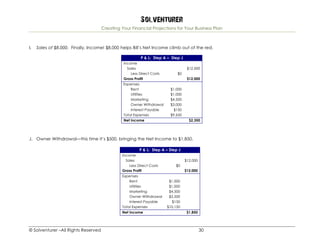
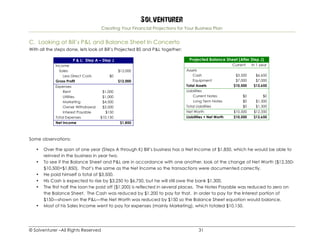
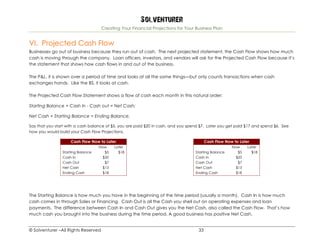
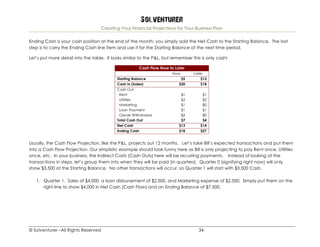
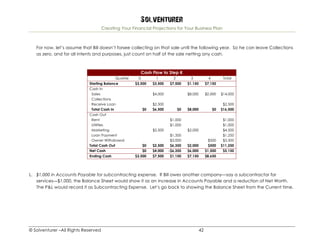
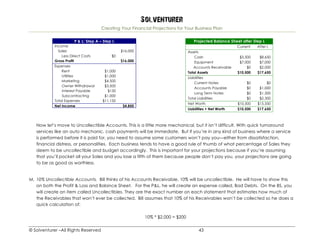
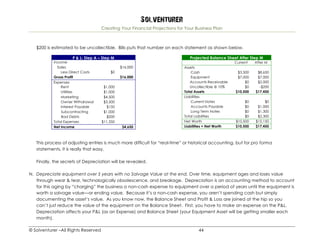
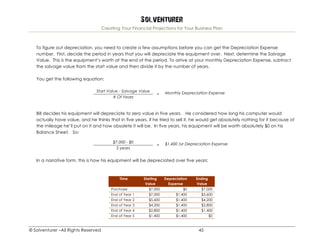
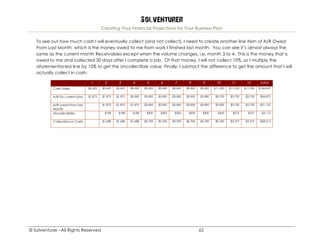
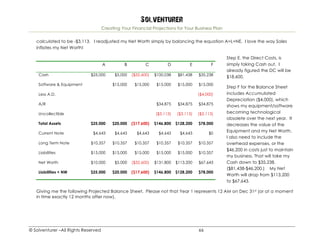
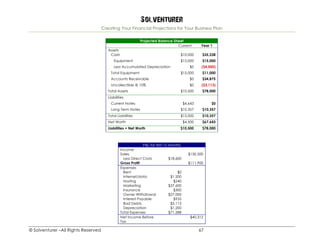
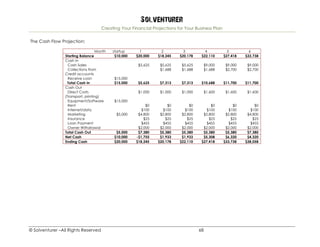
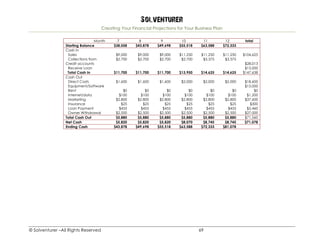

This document provides guidance on creating financial projections for a business plan. It introduces an example solopreneur business owner, Bill, to demonstrate how to project the balance sheet, profit and loss statement, and cash flow statement. Specific transactions are used at first to illustrate how each type of transaction affects the different financial statements. The goal is to empower the reader to understand the numbers behind their own business so they can create meaningful projections without advanced accounting knowledge. Projecting trends over time rather than isolated transactions is more realistic but concepts are introduced through isolated examples first for clarity.


