Downloaded 12 times


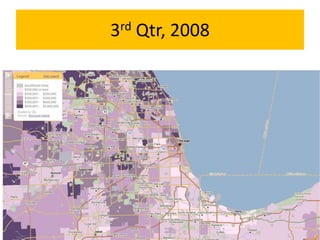


The document discusses the process of creating time series maps to track indicators over various time periods. It specifically mentions median home sale prices in Chicago and Philadelphia from 2007 to 2009. Users can create custom ranges for these indicators to analyze changes over time.


